Research
March 31, 2021
The School Breakfast Program and National School Lunch Program: A Primer
Executive Summary
- The federal government helps states provide meals to roughly 30 million children through the National School Lunch Program (NSLP) and the School Breakfast Program (SBP), with nearly 88 percent of school meals served in 2020 provided to low-income students for free or at a reduced price.
- Children in families with income at or below 130 percent of the federal poverty level (FPL) qualify for free breakfast and lunch, while those in households with incomes below 185 percent FPL pay 40 cents or less for either meal.
- Participation in the NSLP has declined slightly over the past decade, serving roughly 30 million students per day, while participation in the SBP has risen, serving nearly 15 million students daily in 2019. The number of students receiving free meals has risen in both programs since 2010.
- Total federal costs for school food programs were approaching $20 billion in 2019, and totaled nearly $25 billion in 2020, with the additional assistance provided as a result of the COVID-19 pandemic.
Introduction
The Food and Nutrition Service (FNS) of the United States Department of Agriculture (USDA) administers both the School Breakfast Program (SBP) and the National School Lunch Program (NSLP) to help ensure all children, particularly low-income children, receive breakfast and lunch while at school or childcare. States operate the programs through agreements with school food authorities. These programs generally operate in public or non-profit private elementary and secondary schools, as well as residential childcare institutions, and private and charter schools. The USDA supplies participating schools with 100 percent American grown and produced foods, supporting domestic farmers, and cash subsidies for each meal they serve.[i] Over 94,300 public and private K-12 schools, representing roughly 91 percent of all schools in the United States, participate in at least one of the federal programs, serving over 30 million students (60 percent) each day.[ii], [iii]
Background
The National School Lunch Program was signed into law by President Truman in 1946 after years of federal financial assistance for the purchase of food as well as the direct provision of food to schools across the country.[iv] In 1935, the federal government began distributing food to schools to make use of agricultural surpluses which were suppressing prices and limiting farmers’ income. In 1943, during World War II, the government began giving money to states to purchase food locally so as not to waste gasoline during the war. Part of the argument for a permanent federal school lunch program came from an acknowledgement that some men were unable to serve in the war because of their poor nutrition as children.[v]
Congress first established the School Breakfast Program (SBP) as a two-year pilot program in 1966 designed to provide grants to schools that serve breakfast to nutritionally needy children. To increase the incentive for schools in needy areas to participate, Congress approved higher federal payments for schools determined to have “severe need.”[vi] As the program began to gain popularity, Congress expanded the pilot program several times. In 1971, Congress changed the priority of the program to focus on children of working mothers or from low-income families. SBP received permanent authorization in 1975, and Congress declared that it would be made available to all schools with nutritionally at-risk students.
Eligibility
The SBP and NSLP have the same two eligibility requirements. The first requirement relates to household income: Children from families with incomes at or below 130 percent of the federal poverty level (FPL) receive free meals; nearly a quarter, or 16.2 million children in the United States in 2019, meet this requirement.[vii] Children from families above 130 percent FPL but less than 185 percent FPL pay 40 cents or less for lunch or breakfast; roughly eight million children fall into this category.[viii] For context, in the 2020-21 school year, 130 percent of the poverty level is $34,060 for a family of four and 185 percent is $48,470.[ix]
Children may be enrolled though a single household application, and categorical eligibility allows eligibility to be determined based on household participation in other needs-tested programs, such as the Supplemental Nutrition Assistance Program (SNAP), Temporary Assistance for Needy Families (TANF), or the Food Distribution Program on Indian Reservations (FDPIR).[x] Children enrolled in Head Start, in foster care, and migrants, runaways, and homeless children are also automatically eligible.[xi]
The Community Eligibility Provision (CEP) allows eligible schools and school districts in high-poverty areas to offer free meals school-wide if at least 40 percent of students are identified as automatically eligible from direct certification through other programs.[xii] In 2018-2019, nearly 29,000 schools used this provision to provide free meals to 13.6 million children.[xiii] The Food Research and Action Center found that in the 2020-2021 school year, nearly 27,000 schools participated in this provision, serving 12.5 million children.[xiv]
Participation
For the purposes of government data tracking, participation in the NSLP and SBP includes all students who receive a school-provided meal, whether for free, a reduced-price, or full price.
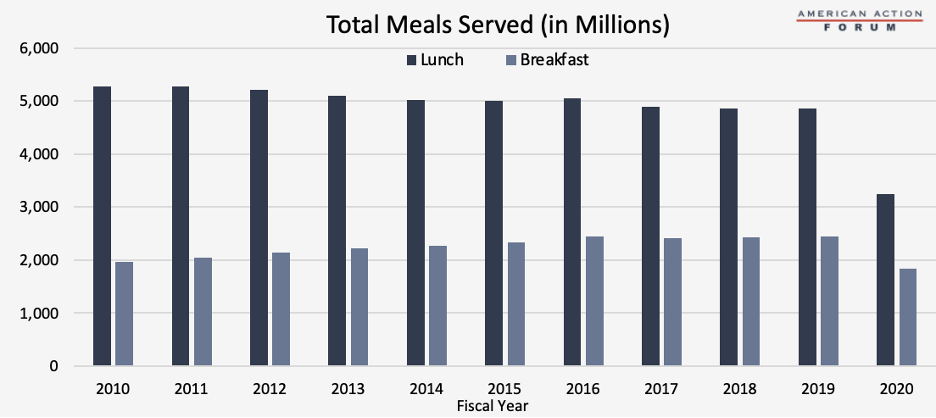 Source: https://fns-prod.azureedge.net/sites/default/files/resource-files/slsummar-3.pdf, https://fns-prod.azureedge.net/sites/default/files/resource-files/sbsummar-1.pdf
The chart above shows the total meals served in both the NLSP and the SBP each year. The NSLP served 5.3 billion lunches in 2010, the highest number of lunches served in the past decade, and participation has slowly declined since then.[xv] The SBP, conversely, has seen participation increase, and served its highest number of meals in 2019, serving 2.5 billion breakfasts that year.[xvi] In 2020, meals served for both programs decreased significantly as a result of COVID-19, though many students still received take-home meals in the first few months of the pandemic and an average of 6.8 million students later received financial assistance through the Pandemic-Electronic Benefit Transfer program (P-EBT) each month from March to September.
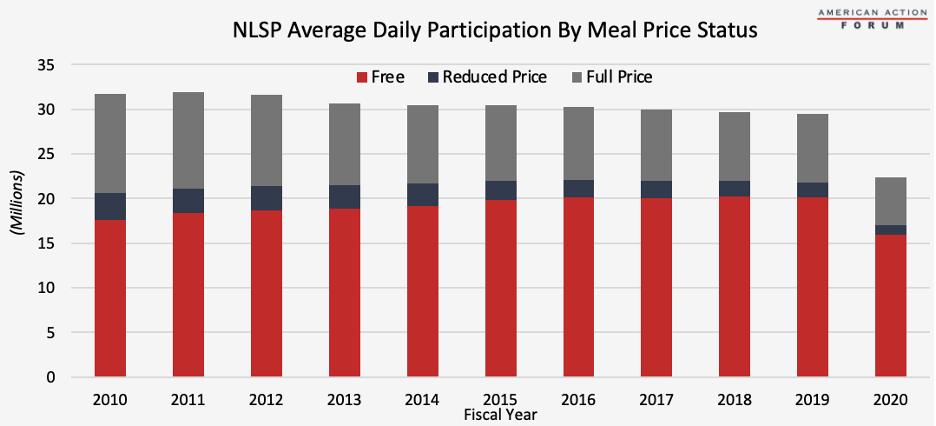
Source: https://fns-prod.azureedge.net/sites/default/files/resource-files/slsummar-3.pdf
As shown by the chart above, a majority of NSLP participants receive a free lunch while only a fraction of the participants receives a reduced-price meal. Participation in NSLP has stayed relatively constant over the second half of the past decade, dropping slightly from the highs of 2010 and 2011 as the economy has rebounded from the Great Recession and fewer students paying full or reduced-price are participating. The share of students receiving free meals, however, has increased, resulting in the subsidized rate growing from 65 percent in 2010 to 74 percent in 2019 and 76 percent in 2020.[xvii] Daily participation in 2020 was significantly lower, at 22 million, because of the school closures that resulted from the COVID-19 pandemic.[xviii]
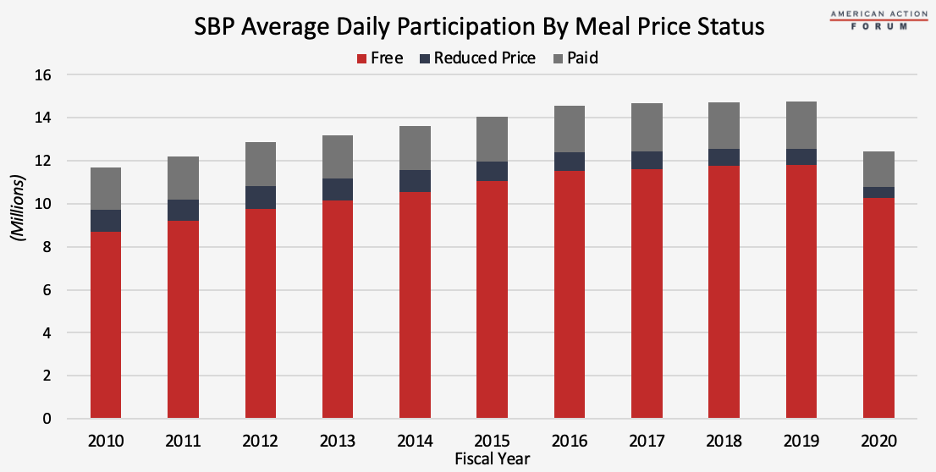
Source: https://fns-prod.azureedge.net/sites/default/files/resource-files/sbsummar-1.pdf
Compared to the NSLP, the SBP has fewer annual participants, though participation has incrementally increased over the decade, particularly among students receiving free meals, as well as those paying full price. The share of participants receiving subsidized meals has increased, similar to the trend in the NSLP. In 2010, 83.5 percent of students received a free or reduced-price meal; by 2019, that share had increased to 85.1 percent and in 2020 reached 87.7 percent.[xix] Again, the COVID-19 pandemic resulted in average daily participation in 2020 declining significantly to 12.4 million, but it is expected that participation will begin growing again as schools fully reopen in the next school year.
Costs
Schools participating in these programs receive cash payments from the federal government for each reimbursable meal they serve. In exchange, schools are required to serve meals that meet the federal meal nutrition requirements and offer them for free or at a reduced price to eligible children.[xx]

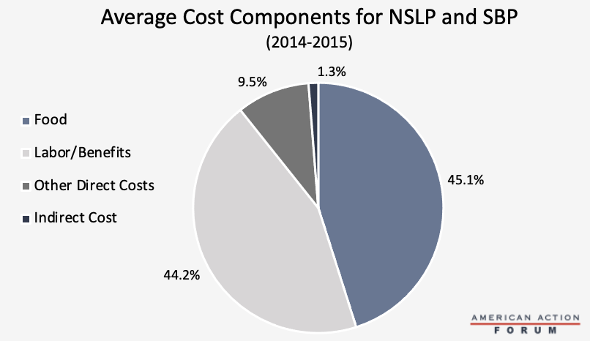
Source: https://fns-prod.azureedge.net/sites/default/files/resource-files/cncost-3.pdf
Cash reimbursements for meals served account for the majority of the federal costs for these programs. Because many more students participate in the school lunch program rather than the breakfast program, reimbursements for lunches account for the largest share of costs. Roughly 8 percent of the costs are for USDA-purchased commodity foods that are provided to schools.[xxi]
In 2019, the federal government paid $12.9 billion in reimbursements to participating NSLP schools and $4.5 billion to SBP schools, the highest cash payment for each program over the past 10 years.[xxii] These payments were 32 percent and 59 percent higher, respectively, than those paid in 2010. Given that the average number of free lunches and breakfasts only increased 14 percent and 36 percent, respectively, during that time, the cost increase is due to other factors beyond increased participation among subsidized students. As noted below, the cost of food accounts for nearly half of the program’s cost; from January 2010 to December 2019, the price of food, according to the Consumer Price Index for all Urban Consumers, increased 19.4 percent.[xxiii] The cost of labor for state and local employees, which also accounts for nearly half of the program’s costs, increased 5 percent during that period.[xxiv] With the more than $1.3 billion in commodity costs, total federal spending on these programs reached $18.7 billion in 2019.[xxv]
In 2020, the federal government spent $9.1 billion on NSLP cash payments and $3.5 billion on SBP reimbursements, though this does not count the $10.7 billion in additional COVID-19-related assistance provided through the Pandemic-Electronic Benefit Transfer program.[xxvi] When accounting for the P-EBT funding and $1.3 billion in commodity costs, federal spending in 2020 on school meals reached nearly $25 billion.
Reimbursement Rates
The SBP reimbursement rates for the 2020-21 school year are $1.89 for free meals, $1.59 for reduced-price meals, and $0.32 for paid meals.[xxvii] An additional 37 cents are provided for each free or reduced-price breakfast served in “severe need” schools, where at least 40 percent of the lunches served during the second preceding school year were free or reduced-price meals.[xxviii] In Alaska, Guam, Hawaii, Puerto Rico, and the Virgin Islands, reimbursement rates are higher.[xxix]
The NSLP reimbursement rates for the 2020-21 school year are $3.51 for free meals, $3.11 for reduced-price meals, and $0.33 for paid meals.[xxx] Schools that are certified as meeting the 2019 nutrition standards receive an additional 7 cents per lunch.[xxxi] An additional 2 cents per lunch is given to schools that have 60 percent or more of their students receiving free or reduced-price lunches.[xxxii] Again, reimbursement rates are higher in Alaska, Guam, Hawaii, Puerto Rico, and the Virgin Islands.
The price paid by students paying full price is set by local school districts, varying across the country, but must comply with federal regulations.
Cost Components
A local School Food Authority (SFA), responsible for the operation of school meal programs via contract with the local school district, allocates funds to schools for both the SBP and the NSLP for reimbursable meals and snacks. In 2019, the USDA released the School Nutrition and Meal Cost Study to examine the cost of producing school meals. The study found that in the 2014-15 school year, food and labor each accounted for 45 percent of the programs’ costs, while other direct costs (such as equipment, non-food supplies, and utilities) were about 10 percent, and indirect costs were 1 percent. Indirect costs are paid to the school district for the use of facilities, administrative support, or other services.
The cost per NSLP lunch included $1.69 for food, $1.72 for labor, $0.37 for other direct costs, and $0.05 for indirect costs, totaling $3.83, or $0.32 more than the federal reimbursement rate for a free meal in 2020. The mean reported cost per SBP breakfast comprised $1.15 for food, $1.24 for labor, $0.25 for other direct costs, and $0.03 for indirect costs, for a total cost of $2.67, $0.78 more than the federal reimbursement rate for school breakfasts. State and local funds must cover the remaining costs.
Summer Meals
The Summer Food Service Program (SFSP) provides federal aid to schools and other local public and nonprofit organizations that serve meals and snacks to children during the summer months. As with the NSLP and SBP assistance, the federal aid provided to schools is in the form of per-meal cash reimbursements and a smaller amount of commodity foods and administrative funds. This program serves 2.7 million children annually at roughly 46,600 sites in 2020.[xxxiii]
The SFSP must be administered by sponsor organizations that operate the program at meal sites, such as schools, recreation centers, parks, churches, and public libraries. Unlike with other child nutrition programs, the ability to participate in the SFSP is generally limited (with the exception of camps) to meal sites that serve children from areas of high poverty.
SFSP: Federal Per-Meal Reimbursement Rates
January 1-December 31, 2020
| Breakfast | Lunches/ Suppers | Supplements/ Snacks | |
| Rural or Self Prep | $2.3750 | $4.1525 | $0.9775 |
| Other Sites | $2.3300 | $4.0875 | $0.9550 |
Source: https://frac.org/wp-content/uploads/fedrates.pdf
In 2020, there were nearly 16 million children that qualified to receive a free lunch and roughly 10 million children that qualified to receive a free breakfast. The SFSP, however, served just 2.7 million children, leaving over 13.3 million children eligible to receive a free meal during the school year without such assistance during the summer because of the location restrictions on program participation.
NSLP Afterschool Snack Service
The NSLP Afterschool Snack Service was authorized in the Child Nutrition Reauthorization Act of 1998 (P.L. 105-336). FNS administers it at the federal level. At the state level, it is administered by state agencies that operate the snack service through agreements with SFAs. This program allows schools participating in the NSLP to receive federal reimbursements for one snack per child per day for eligible afterschool programs during the school year.
Snacks must include full servings of two of any of the following foods: fluid milk, meat or meat alternate, vegetable or fruit, and whole-grain or enriched bread. Eligible afterschool programs must primarily provide care for children after school; have organized, regularly scheduled activities in a structured and supervised environment; and include education or enrichment activities.[xxxiv]
Unpaid Meal Debt
Despite over 90 percent of schools participating in the NSLP and roughly half of nation’s school children receiving free or reduced-price meals, there are still many students each year with outstanding school meal debt. According to a survey of 1,500 school districts, three-quarters of the districts report that their program had unpaid school lunch debt at the end of the 2017-2018 school year, though the amount of debt decreases as the share of students receiving free or reduced-price lunches increases.[xxxv] Over the past few years, the median amount of lunch debt rose from $2,000 per district in 2014 to $3,400 in 2019, with total debt levels varying dramatically from $10 to $500,000. The study also found that among the 570 districts reporting, the total accumulated meal debt was more than $10.9 million at the end of the 2017-2018 school year.
USDA requires schools to collect any debt incurred from meal charges and prohibits them from using federal funds to pay off unpaid meal debt. When families do not pay for meals served, unpaid meal debt can accumulate quickly, in some cases forcing schools to use education funds to cover the debt.[xxxvi]
In 2017, USDA mandated that schools implement an unpaid meal policy to clarify what will happen if a student cannot pay for a meal; previously states were not required to have a standard policy in place, which created confusion and inconsistent policies.[xxxvii] This new regulation provides schools a number of policy options they may choose to implement. Policies may limit the number of times students charge a meal when their account is overdrawn or offer a free alternative meal such as a brown paper bag lunch with a cheese sandwich, fruit, and milk; these were the most common policies in place prior to the new regulation.
In recent years, increased attention has been paid to the consequences faced by children with unpaid meal debt. In response, Representative Ilhan Omar and Senator Tina Smith, both Democrats from Minnesota, introduced the “No Shame at School Act.” The bill seeks to end the stigmatization of children who are unable to pay for school meals and allows school districts to receive federal reimbursement for meals served to children with an overdrawn debt balance. Senator Tom Udall (D-NM) introduced a similar bill, the “Anti-Lunch Shaming Act of 2019,” although Congress has not passed either bill.
[i] https://www.fns.usda.gov/sbp/fact-sheet
[ii] https://crsreports.congress.gov/product/pdf/R/R46234
[iii] https://educationdata.org/k12-enrollment-statistics#:~:text=Among%20the%2050.8%20million%20students,school%20(K%2D8th%20grade)
[iv] https://www.thecongressproject.com/national-school-lunch-act-1946
[v] https://www.thecongressproject.com/national-school-lunch-act-1946
[vi] https://www.fns.usda.gov/sbp/program-history
[vii] https://www.census.gov/data/tables/time-series/demo/income-poverty/cps-pov/pov-01.html
[viii] https://www.fns.usda.gov/cn/nutrition-standards-school-meals,
https://www.census.gov/data/tables/time-series/demo/income-poverty/cps-pov/pov-01.html
[ix] https://schoolnutrition.org/aboutschoolmeals/schoolmealtrendsstats/#4
[x] https://www.everycrsreport.com/reports/R43783.html#_Toc778124
[xi] https://www.everycrsreport.com/reports/R43783.html#_Toc778124
[xii] https://crsreports.congress.gov/product/pdf/R/R46234
[xiii] https://frac.org/wp-content/uploads/community-eligibility-key-to-hunger-free-schools-sy-2018-2019.pdf
[xiv] https://frac.org/research/resource-library/community-eligibility-cep-database
[xv] https://fns-prod.azureedge.net/sites/default/files/resource-files/slsummar-3.pdf
[xvi] https://fns-prod.azureedge.net/sites/default/files/resource-files/sbsummar-1.pdf
[xvii] https://fns-prod.azureedge.net/sites/default/files/resource-files/slsummar-3.pdf
[xviii] https://fns-prod.azureedge.net/sites/default/files/resource-files/slsummar-3.pdf
[xix] https://fns-prod.azureedge.net/sites/default/files/resource-files/sbsummar-1.pdf
[xx] https://fns-prod.azureedge.net/sites/default/files/resource-files/NSLPFactSheet.pdf
[xxi] https://fns-prod.azureedge.net/sites/default/files/resource-files/cncost-3.pdf
[xxii] https://fns-prod.azureedge.net/sites/default/files/resource-files/cncost-3.pdf
[xxiii] https://fred.stlouisfed.org/series/CPIUFDNS
[xxiv] https://www.bls.gov/web/eci/ecconstnaics.pdf
[xxv] https://fns-prod.azureedge.net/sites/default/files/resource-files/cncost-3.pdf
[xxvi] https://crsreports.congress.gov/product/pdf/R/R46681
[xxvii] https://schoolnutrition.org/aboutschoolmeals/schoolmealtrendsstats/#2
[xxviii] https://schoolnutrition.org/aboutschoolmeals/schoolmealtrendsstats/#2
[xxix] https://schoolnutrition.org/aboutschoolmeals/schoolmealtrendsstats/#2
[xxx] https://schoolnutrition.org/aboutschoolmeals/schoolmealtrendsstats/#2, https://fns-prod.azureedge.net/sites/default/files/resource-files/SNMCS-Volume3.pdf
[xxxi] https://schoolnutrition.org/aboutschoolmeals/schoolmealtrendsstats/#2
[xxxii] https://schoolnutrition.org/aboutschoolmeals/schoolmealtrendsstats/#2
[xxxiii] https://crsreports.congress.gov/product/pdf/R/R46234
[xxxiv] https://www.fns.usda.gov/cn/afterschool-snacks-faqs
[xxxv] https://schoolnutrition.org/uploadedFiles/6_News_Publications_and_Research/8_SNA_Research/2019-school-nutrition-trends-summary.pdf
[xxxvi] https://www.fns.usda.gov/cn/unpaid-meal-charges-clarification-collection-delinquent-meal-payments
[xxxvii] https://www.fns.usda.gov/cn/unpaid-meal-charges, https://fns-prod.azureedge.net/sites/default/files/cn/unpaidmealcharges-report.pdf