Insight
July 1, 2025
Primer: Chronic Disease Among Adults in the United States
Executive Summary
- Chronic disease has grown to be a primary focus of U.S. health policy due to its scale and severity, with the Department of Health and Human Services placing this issue at the center of its agenda.
- With nearly 60 percent of U.S. adults living with at least one chronic condition, 40 percent of adults managing multiple diseases, and chronic condition prevalence projected to nearly double by 2050, chronic disease represents an ongoing public health issue.
- This paper examines the prevalence and morbidity of chronic diseases and how their growing clinical burden and treatment complexity account for a substantial share of U.S. health care spending.
Introduction
Department of Health and Human Services Secretary Robert F. Kennedy Jr. has placed chronic disease at the center of the department’s agenda. Over the past five decades, the prevalence of chronic conditions – particularly cardiovascular disease, diabetes, obesity, cancer, and chronic respiratory illnesses – has risen sharply, reshaping the nation’s health landscape. Today, approximately 60 percent of U.S. adults live with at least one chronic condition, while 40 percent manage multiple chronic diseases (MCCs), a level of multimorbidity that adds significant complexity to ongoing care and long-term outcomes. While this paper focuses specifically on adult chronic conditions, data demonstrates the prevalence of chronic diseases among children has also grown in the past two decades, with more than 40 percent of U.S. school-aged children living with at least one chronic health condition, up from 23 percent in 1999. These trends are significant given that chronic conditions in children may indicate future development of chronic diseases in adulthood.
Chronic diseases have consistently dominated the top causes of death since 1980, with conditions such as heart disease and cancer persistently leading mortality rankings. Projections indicate this burden will continue to escalate between 2020 and 2050. The number of adults over 50 years old with at least one chronic condition is expected to nearly double, climbing from roughly 72 million to 143 million.
While chronic disease rates have clearly risen, observed increases may also reflect advances in diagnostics, broader clinical definitions, and expanded screening over time. These changes have made many conditions easier to detect and more widely reported, potentially contributing to prevalence gains even when the underlying disease burden remains stable. Regardless of the cause, the result is the same: More people are living with chronic disease than ever before, underscoring the scale of the challenge.
To understand chronic disease’s place in the national health landscape, this paper begins by tracing historical trends in its incidence, mortality burden, and overall population-level impact. The following section reviews which conditions have persisted over time, which have grown fastest, and how these changes reflect underlying demographic and behavioral shifts, contextualizing why policymakers are giving serious attention to the issue of chronic disease.
Scope and Historical Trends of Chronic Disease Burden
Based on 2023 data, 129 million Americans – nearly 60 percent of adults – live with at least one major chronic condition, such as heart disease, diabetes, obesity, or cancer, and 40 percent are diagnosed with two or more. This burden is compounded by the rapid aging of the population: In 2023, more than 61 million Americans were aged 65 and older – up from about 41 million in 2011 – a trend expected to accelerate in the coming decades.
Projections find an increased burden of chronic disease prevalence as the U.S. population ages. In 2020, roughly 72 million American adults over 50 had at least one chronic disease. That number is expected to climb to 143 million by 2050 – a 99.5-percent increase in 30 years. Over the same period, multimorbidity among adults of the same population is projected to rise roughly 92 percent, from approximately 8 million to nearly 15 million in 2050. The first two panels below illustrate projected increases in the number of individuals over age 50 with one or more chronic diseases, with each year’s data divided into three age groups.
Among adults aged 50–59, the number of people with single or multiple conditions is expected to grow by approximately 50 percent. For those aged 60–79, that total is projected to roughly double by 2050, while the 80+ population with single or multiple chronic conditions is expected to nearly triple.
The final panel charts the growth of chronic disease prevalence between 2020 and 2050 for the previously mentioned age groups, but includes data on the underlying population growth within these age subsets. The data demonstrates that increases in chronic disease prevalence significantly outpace overall population growth for the 60–79 cohort as well as the 80+ group. While the overall growth in the 50–59 population tracks with the rise of chronic disease prevalence for this group, the data demonstrates that for the other two observed subsets, the rising chronic disease burden is driven by more than just demographic expansion.

Source: Anash and Chiu: Projecting the chronic disease burden among the adult population
These long-term trends in chronic disease prevalence underscore how deeply these conditions shape population health – not only through rising case numbers but through their persistent role in driving mortality. Examining which chronic diseases consistently rank among the leading causes of death helps clarify their full public health impact, including premature death, strain on the health care system, and rising societal costs.
Chronic Conditions: 7 of the 10 Leading Causes of Death
A key indicator of chronic disease burden is its role in driving mortality. The following section examines how chronic conditions have consistently ranked among the leading causes of death in the United States, highlighting which diseases remain most lethal and how their rankings have evolved over time.
While it is challenging to determine the precise cause of death for individual cases – given variations in reporting standards and data collection practices – aggregated national data suggest that the leading causes of death in the United States have remained relatively consistent over the past three decades. Chronic diseases have persistently held top positions in mortality rankings and account for a growing share of total deaths over time.
The graph below reflects official Centers for Disease Control and Prevention data on deaths associated with specific chronic conditions. The ranks that are missing data account for causes of death not associated with chronic disease. When interpreting this data, however, researchers caution that such figures are difficult to pinpoint conclusively, as identifying specific causes of death masks underlying complexities or contributing comorbidities. For example, studies demonstrate difficulties in determining whether a chronic disease was the primary cause of death or a contributing factor alongside other conditions.
![]()
Source: CDC
Heart disease has ranked as the leading cause of death every year since 1991, accounting for over 697,000 deaths in 2023 alone. Cancer has followed closely in second place throughout the entire period, with roughly 610,000 deaths in 2023. Together, these two conditions have continuously accounted for over 40 percent of all annual deaths in the United States.
Stroke, the third-leading cause of death in the early 1990s, has gradually declined, falling to the fifth position by 2023. Meanwhile, chronic lower respiratory diseases have held a steady position in the fourth or fifth rank from 1991 through the mid-2010s, before eventually being surpassed by other conditions. Alzheimer’s disease notably rose from the eighth spot in the early 2000s to the sixth-leading cause of death by the late 2010s and has remained firmly in the sixth position until 2023.
Diabetes has maintained a stable mid-ranking position (sixth to eighth) throughout the observed period, while kidney disease and chronic liver disease and cirrhosis have occupied the lower ranks of the top 10 but show noticeable volatility, especially in more recent years. Chronic liver disease has climbed into the top 10 more consistently starting in the late 1990s and was the ninth leading cause of death by 2023. While death rates reflect disease severity, prevalence tells us how widespread these conditions are.
Prevalence of Selected Chronic Diseases (2011–2023)
While leading causes of death capture the conditions most directly responsible for mortality, measuring disease prevalence provides critical insight into the broader burden of chronic illness, reflecting how many individuals are living with these conditions, the impact on quality of life, and the strain placed on health care systems.
While prevalence is shown as a percentage of the population, these figures can obscure the substantial growth in the absolute number of affected individuals, as small percentage increases can result in significant rises in disease burden when applied across large population. In a similar vein, trends in overall population growth may also increase the absolute burden of these chronic diseases despite minimal growth in prevalence percentages.
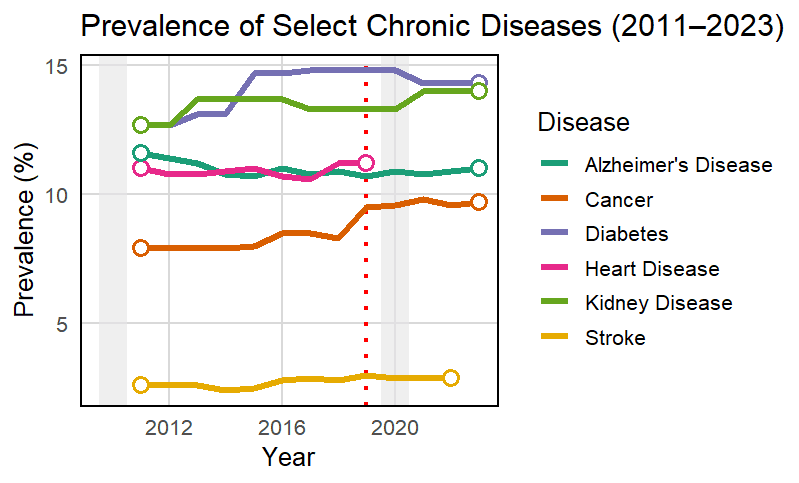
The following graph presents trends in the prevalence of selected chronic diseases in the U.S. adult population from 2011 to 2023, revealing both the steady rise of conditions such as diabetes and kidney disease and the relative stability of others such as stroke and Alzheimer’s disease.
These trends must be interpreted with caution due to inherent challenges in measuring disease prevalence, including different data collection procedures depending on the nature of the disease, changes in data sources, changing diagnostic criteria over time, and introductions of new reporting practices.
This section provides a condition-by-condition overview of chronic disease prevalence trends from 2011 to 2023 for selected diseases, highlighting where growth has been most pronounced and how the overall burden is evolving across the U.S. adult population.
Diabetes shows a sustained upward trajectory, increasing from approximately 13 percent in 2011 to over 14 percent by 2023. Given that both conditions affect over 12 percent of the adult population – which, in 2023, equates to more than 30 million individuals – a 1-percentage point increase would add an additional 2.5–3 million cases for each disease. When combined with the underlying growth of the adult population itself, these incremental increases compound, driving an even greater rise in absolute case numbers.
Kidney disease shows a gradual but steady increase over the examined period, rising from roughly 13 percent in 2011 to 14 percent by 2023. In 2023, this 1.4 percentage point increase translates to approximately 35 million adults living with kidney disease. A further 1-percentage point increase would add roughly 2.5 million to 3 million more cases. Among adults aged 65 and older, prevalence is notably higher – estimates suggest up to 34 percent may have some stage of chronic kidney disease – making population aging a powerful driver of growth in absolute case counts.
Stroke, while remaining the least prevalent and having the most stable prevalence of the tracked conditions, shows a modest but noticeable uptick after 2017, rising from 2.6 percent to approximately 3 percent by 2023. This trend is significant given the size of the U.S. adult population having experienced stroke; at 3-percent prevalence, approximately 8 million adults were estimated to have had a stroke in 2023. The 0.4-percent increase between 2017 and 2023 equated to approximately 1.1 million additional stroke cases. Stroke prevalence is predicted to increase dramatically in the near future; it is highest among the 65 plus population (7.7 percent) and has a projected growth of 47 percent in this population by 2050.
Alzheimer’s disease shows a gradual but persistent increase over the period, rising from an estimated 11.6 percent of the population aged 65 and older in 2011 to approximately 14.3 percent by 2023. While the year-over-year changes appear incremental, these trends are particularly significant given the rapid growth of the older adult population, as mentioned earlier. Considering the concurrent trends of the rising elderly population and pure percentage increases in prevalence, nearly 14 million people are expected to have Alzheimer’s by 2060. While sources providing statistics on Alzheimer’s prevalence in the past decade may differ in their approximations, all sources demonstrate a consistent increase over the past decade, a trend expected to continue into the future.
Cancer prevalence appears relatively stable through 2018, affecting around 8 percent of the adult population. A notable increase, however, is observed starting in 2019, coinciding with a change in data sourcing for cancer prevalence statistics. Despite limitations from data sourcing, the absolute burden remains substantial and continues to grow as the U.S. population ages. For example, as of 2022, approximately 18 million people in the United States lived with cancer, with a 1-percent increase in prevalence leading to 2.6 million additional cases.
Heart disease remains one of the most prevalent chronic conditions in the United States, affecting approximately 11 percent of adults as of the last available data in 2019 – equivalent to nearly 28 million individuals. Given this large baseline, even a modest increase in prevalence would result in millions of additional cases. With the number of adults aged 65 and older projected to reach 82 million by 2050, the burden of heart disease is poised to grow substantially, even if prevalence percentages remain stable. Interpreting recent trends is complicated by significant data limitations. A change in data collection and reporting methodology in 2019 disrupted the continuity of the trendline, and no consistent prevalence data is available for 2020 onward.
The data above illustrate key trends in the prevalence of major chronic diseases among U.S. adults from 2011 to 2023. Diabetes shows a consistent upward trajectory, reflecting growing metabolic and renal health burdens. In contrast, stroke, Alzheimer’s disease, and kidney disease remain relatively stable or maintain slight increases in percentage terms, though their absolute case numbers continue to rise alongside population aging. Apparent increases in heart disease and cancer prevalence beginning in 2019 should be interpreted with caution due to changes in data collection methodologies, which limit comparability across the full period.
The data, however, may also reflect advances in medical diagnostics and updates to clinical definitions over time which have potentially influenced how many cases are identified and reported. For instance, Alzheimer’s disease has maintained a relatively consistent clinical definition, making its prevalence trends more directly comparable over time. In contrast, conditions such as heart disease, diabetes, cancer, and kidney disease have seen evolving diagnostic thresholds and screening technologies, which may partially account for observed increases in prevalence. Expanded screening programs, broader diagnostic criteria, and earlier detection can lead to more cases being recorded, even if the underlying disease burden remains stable.
These improvements in care and diagnostic capabilities have also changed what it means to live with a chronic disease. In past decades, certain conditions – such as cancer or heart disease – frequently led to rapid decline or death. Today, these same conditions are often managed as long-term, survivable illnesses due to significant treatment advances. As a result, more people are living with chronic diseases for longer periods, contributing to rising prevalence figures even as mortality may decline or stabilize.
Why Chronic Disease Remains a Central Focus of U.S. Health Policy
In addition to their widespread prevalence and contribution to mortality, chronic diseases exert a profound clinical burden, undermining long-term health outcomes through their severity, complexity, and resistance to simple treatment.
Experts have determined that even in isolation, a single chronic condition can substantially elevate health risks, lead to various other associated health issues, and may ultimately have a direct impact on mortality. In addition, data demonstrate the progressive and interlinked nature of chronic diseases often leads to compounding complications over time, making them more difficult to manage and more likely to result in hospitalizations, long-term disability, and premature death. Research shows that in clinical settings, patients with one or more chronic conditions are significantly more likely to experience the use of multiple prescription drugs, adverse drug events, and the need for frequent follow-up care, making long-term treatment more intensive, prolonged, and complex to manage.
Chronic diseases, particularly when multiple conditions coexist, drive U.S. health care spending. The Centers for Disease Control and Prevention has determined that . As previously mentioned, the prevalence of chronic disease is projected to outpace population growth for the 60+ group, suggesting that expectations of high chronic disease spending are not interchangeable with high end of life spending. Over time, annual federal health costs of treating chronic diseases are expected to rise greatly as, for example, health care and long-term care costs for Alzheimer’s disease and other dementias is expected to nearly triple by 2050, while health care and lost productivity costs for cardiovascular diseases are also expected to triple by 2050. On an individual level, those with chronic illnesses often require ongoing care that is complex and prolonged, with research demonstrating chronic disease’s contribution to ballooning costs for individuals, employers, and health care delivery systems.
Conclusion
Chronic disease remains a persistent and consequential challenge facing the U.S. health care system, driving both mortality and long-term care needs. As of 2023, nearly 60 percent of American adults live with at least one chronic condition, and the number of individuals with chronic illness is projected to nearly double by 2050. Conditions such as heart disease and cancer have consistently ranked as the leading causes of death, while others such as diabetes, Alzheimer’s, and kidney disease continue to grow in prevalence and complexity. Although reported growth in chronic diseases may reflect factors beyond an absolute increase, given chronic disease’s clinical burden and fiscal impact chronic diseases are likely to remain a central focus of U.S. health policy for the foreseeable future.