Insight
March 22, 2017
The Regulatory Freeze in Graphs
There has been considerable coverage of President Trump’s regulatory reform agenda. From reviewing the Fiduciary and Waters of the United States rules to signing the repeal of several significant Obama-era regulations, regulatory reform has provided immediate dividends for the new administration. However, there is one area that is more difficult to evaluate, the effectiveness of the administration’s “regulatory freeze,” which was implemented on Inauguration Day. According to the American Action Forum (AAF), the regulatory freeze has eliminated potential regulatory burdens at a pace unseen with recent executive actions. For example, in its last days, the Obama Administration imposed $11 billion in annual regulatory costs (including proposed and final measures). Since the regulatory freeze, this figure dropped to $153 million, mostly comprised of routine airworthiness directives. By contrast, President Obama’s regulatory freeze in 2009 still produced more than $500 million in new burdens.
The charts below track annual regulatory burdens by week following a presidential election. This graph displays weekly regulatory burdens, starting with the first working day of 2017 (including a linear trendline).
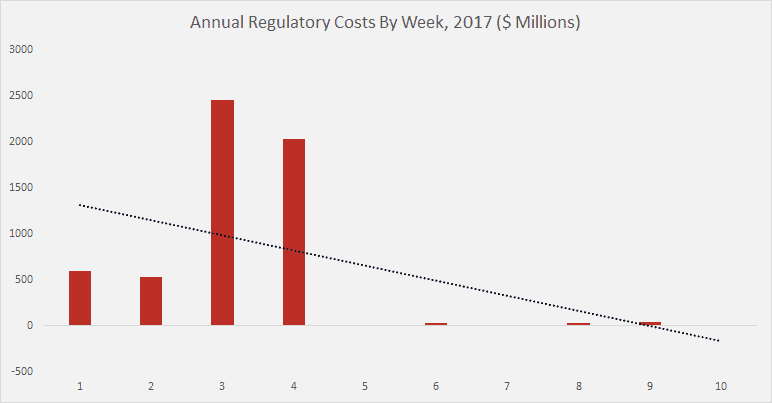
By week five, the regulatory moratorium is evident. There were no final regulatory costs during that period and burdens remained below $1 million in weeks seven and ten. To date, the administration has released just one economically significant rule and that proposal managed to reduce burdens by $2.9 million. These totals are perhaps more pronounced when examining major rules. Through the first 12 working days of 2017, the Obama Administration managed to publish 13 major rules. Aside from a final rule from the independent Federal Reserve, there have been zero major rules under the Trump Administration’s regulatory freeze. Other past regulatory moratoria might have attempted similar results, but the recent pause has no direct historical parallel.
In 2009, then-Chief of Staff Rahm Emanuel issued a version of a regulatory freeze memo. Broadly, it was effective at slowing down regulatory activity. The graph below charts weekly regulatory output in 2009.

The final days of the Bush Administration did generate notable burdens, with $2.5 billion in costs during the first four weeks. However, week five still produced an additional $285 million in burdens. With the freeze still operating, weeks six through ten generated just $225 million in cumulative costs. For major rules, with just eleven working days, the Bush Administration pushed through 11 major regulations. Yet, in the following weeks, regulators still published seven major rules, despite Rahm Emanuel’s moratorium letter. Broadly, the moratorium was effective, but regulators still published several notable rules.
For comparison, AAF has also provided data on new regulatory costs in 2005 and 2013. Although these years succeeded presidential elections, there was no transition of power and no “midnight” surge of regulatory activity. However, these snapshots do provide a perspective of regulation at the start of an administration’s second term. As with the two trendlines above, 2005 and 2013 also reveal slight declines in regulatory costs from week one to week ten.
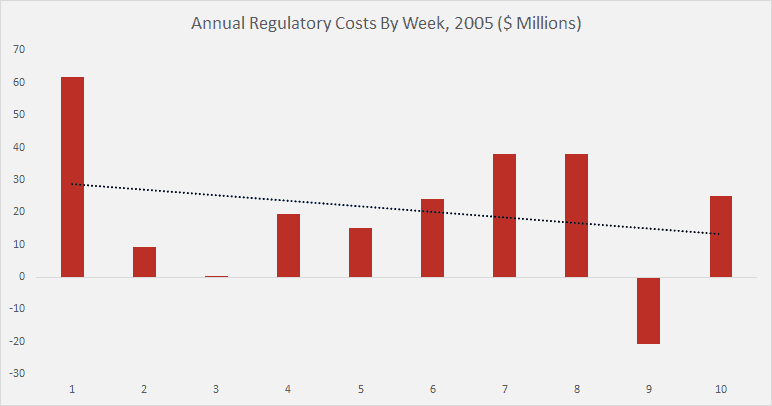
The scale for 2005 should be highlighted, relative to 2009 and 2017. The figures above are in millions, so for the entire ten-week period in 2005, regulators published just $210 million in burdens. This, however, was largely a product of the dearth in total activity in 2005. Below are the figures for 2013, which do not evidence a regulatory freeze, but do demonstrate the heightened regulatory activity of the Obama Administration.
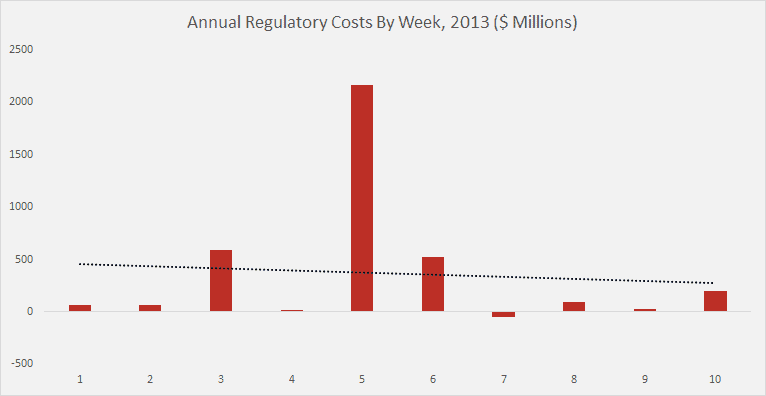
In contrast to 2005’s total, $210 million, in 2013 regulators managed to add more than $3.6 billion in annual burdens. Although there was a notable spike in week five, weeks three and six easily trumped all early activity from 2005. Again, there was no formal regulatory freeze in 2013, but a politically-motivated slowdown in regulation in 2012 might have produced a relatively light tab for the administration in 2013, relative to other years.
Finally, AAF wanted to present a random year of regulation for comparison. Below is weekly regulatory data from the first two-and-a-half months of 2010.
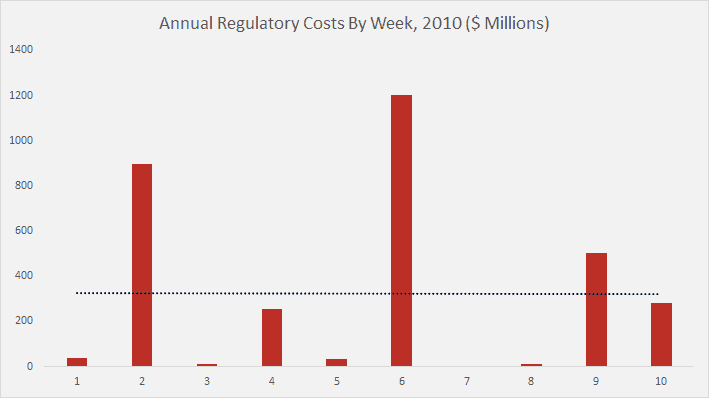
Notice, unlike the other graphs, regulatory costs (as evidenced by the trendline) do not follow a clear pattern. There was no transition of power and no sharp uptick or precipitous decline in published regulatory costs. During the first ten weeks of 2010, regulators produced $3.2 billion in total costs and 15 major rules, or roughly the number of major regulations President Obama issued in his last few days in January.
Conclusion
After five weeks of data, there is little doubt the Trump Administration’s regulatory freeze was effective. A simple review of the Federal Register reveals just a few routine airworthiness directives. By contrast, the business-as-usual approach in 2010 produced more than $3.2 billion in total costs. Yet, the moratorium cannot last forever. Statutory and court-ordered regulations will produce major rules. From there, the administration’s one-in, two-out reform initiative will need to take the reins to produce a lasting legacy of regulatory restraint.