Insight
December 18, 2025
The Social Security Trust Funds and Options for Reform
Executive Summary
- Social Security is quickly approaching insolvency; the program’s trustees estimate its combined Old-Age and Survivors Insurance and Disability Insurance trust funds will be insolvent by the end of calendar year 2034, at which point all beneficiaries will see their benefits cut by 19 percent.
- Restoring long-term financial stability to Social Security today would require enacting a 29-percent payroll tax increase or a 22-percent across-the-board benefit cut; if policymakers wait until 2034, it would require a 34-percent payroll tax increase or a 26 percent across-the-board benefit cut; practically speaking, any plausible reform package will likely include a combination of revenue and benefit changes.
- This insight provides an overview of the financial status of the Social Security trust funds and highlights a series of reform options.
Introduction
Social Security is the United States’ largest and costliest safety-net program, covering more than 67 million retirees, survivors, and disabled persons. As has been long warned, however, the program is quickly approaching insolvency, and absent significant reforms will soon be unable to pay full scheduled benefits. According to the Social Security Trustees, the theoretically combined Old-Age and Survivors Insurance and Disability Insurance trust funds will exhaust their reserves and become insolvent by the end of calendar year (CY) 2034. Upon insolvency, all beneficiaries regardless of age, income, or need will see their benefits cut by 19 percent based on current projections.
Restoring long-term financial stability to Social Security (measured over the CY 2025–2099 projection window) today would require enacting a 29-percent payroll tax increase or a 22 percent across-the-board benefit cut. If policymakers wait until 2034, achieving solvency would require a 34-percent payroll tax increase or a 26-percent across-the-board benefit cut. Eliminating benefits for new beneficiaries would not be enough to ensure long-term solvency.
These numbers make clear that policymakers are unlikely to choose either a tax hike or benefit cut as the single reform to restore Social Security solvency. Instead, any plausible reform package will likely include a combination of revenue and benefit changes.
This insight provides an overview of the financial status of the Social Security trust funds and highlights a series of reform options.
The Financial Status of the Social Security Trust Funds
Social Security Is Quickly Going Bankrupt
According to the Social Security Trustees’ 2025 report, the Social Security Old-Age and Survivors Insurance (OASI) trust fund – which pays monthly benefits to more than 62 million retirees and survivors – will exhaust its reserves by the end of CY 2033. The Social Security Disability Insurance (SSDI) trust fund – which pays monthly benefits to over 8 million disabled persons – will remain solvent at least through the 75-year projection window (CY 2025–2099). On a theoretically combined basis, assuming dedicated revenue is reallocated in the years between OASI and SSDI insolvency, the Social Security trust funds (OASDI) will be insolvent by the end of CY 2034 – just nine years from now. This means Social Security will be insolvent by the time today’s 58-year-olds reach the normal retirement age (NRA) of 67 and today’s youngest retirees – those retiring at age 62 – turn 71.
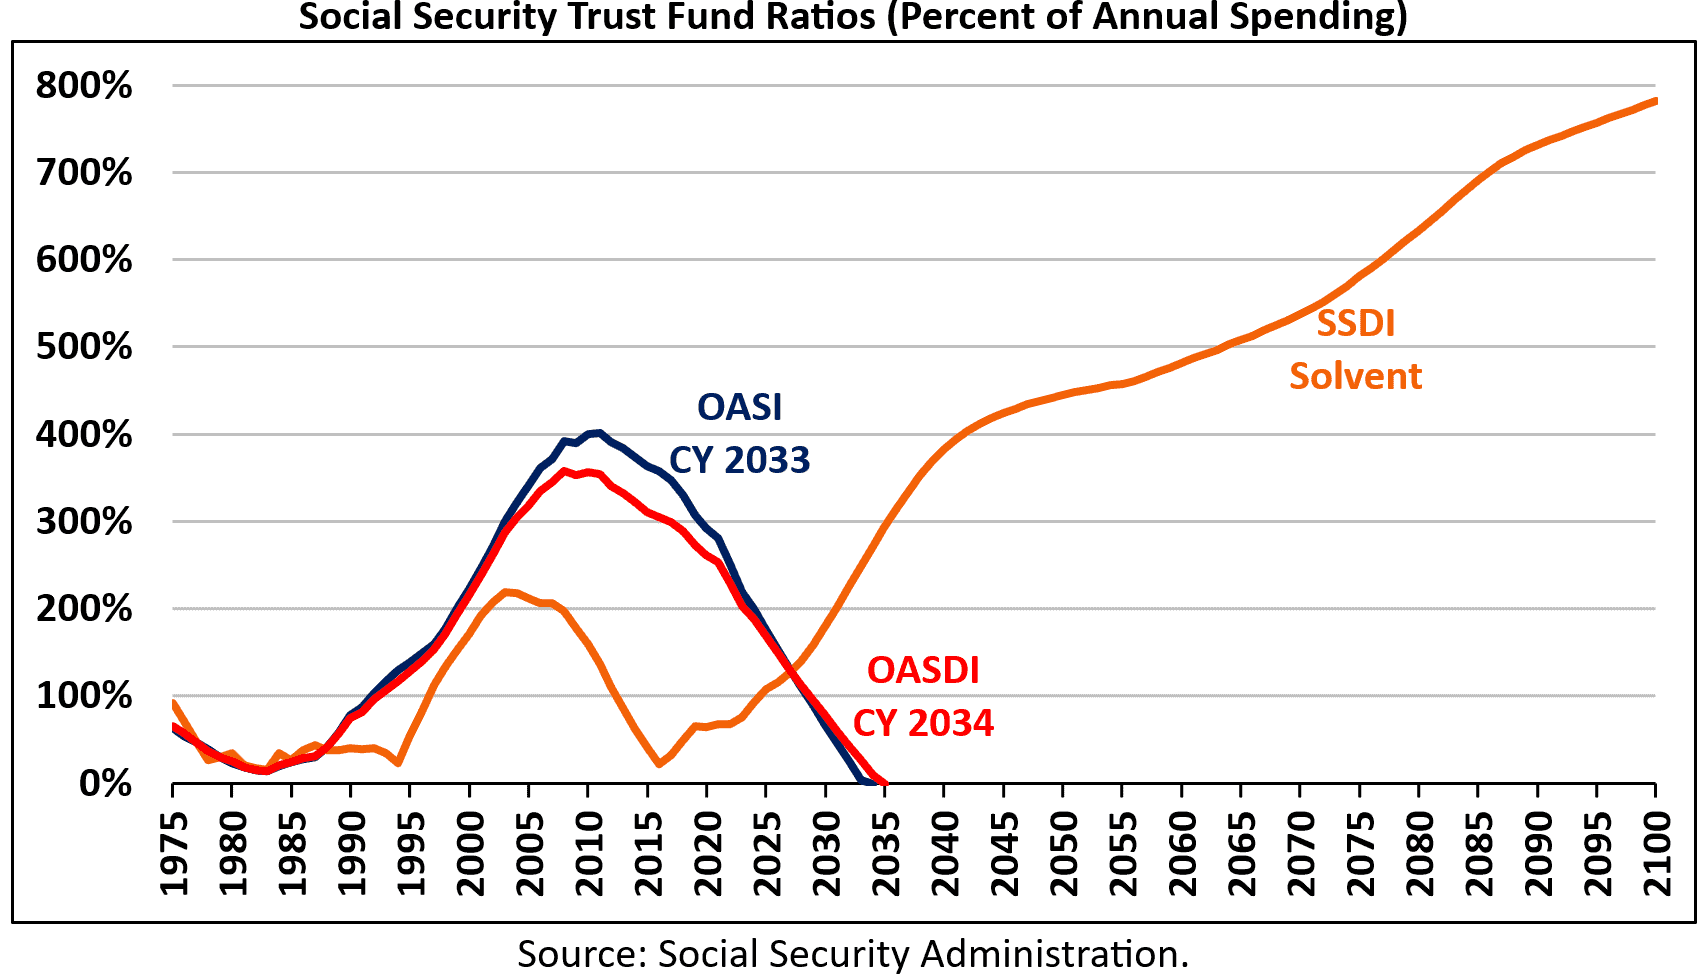
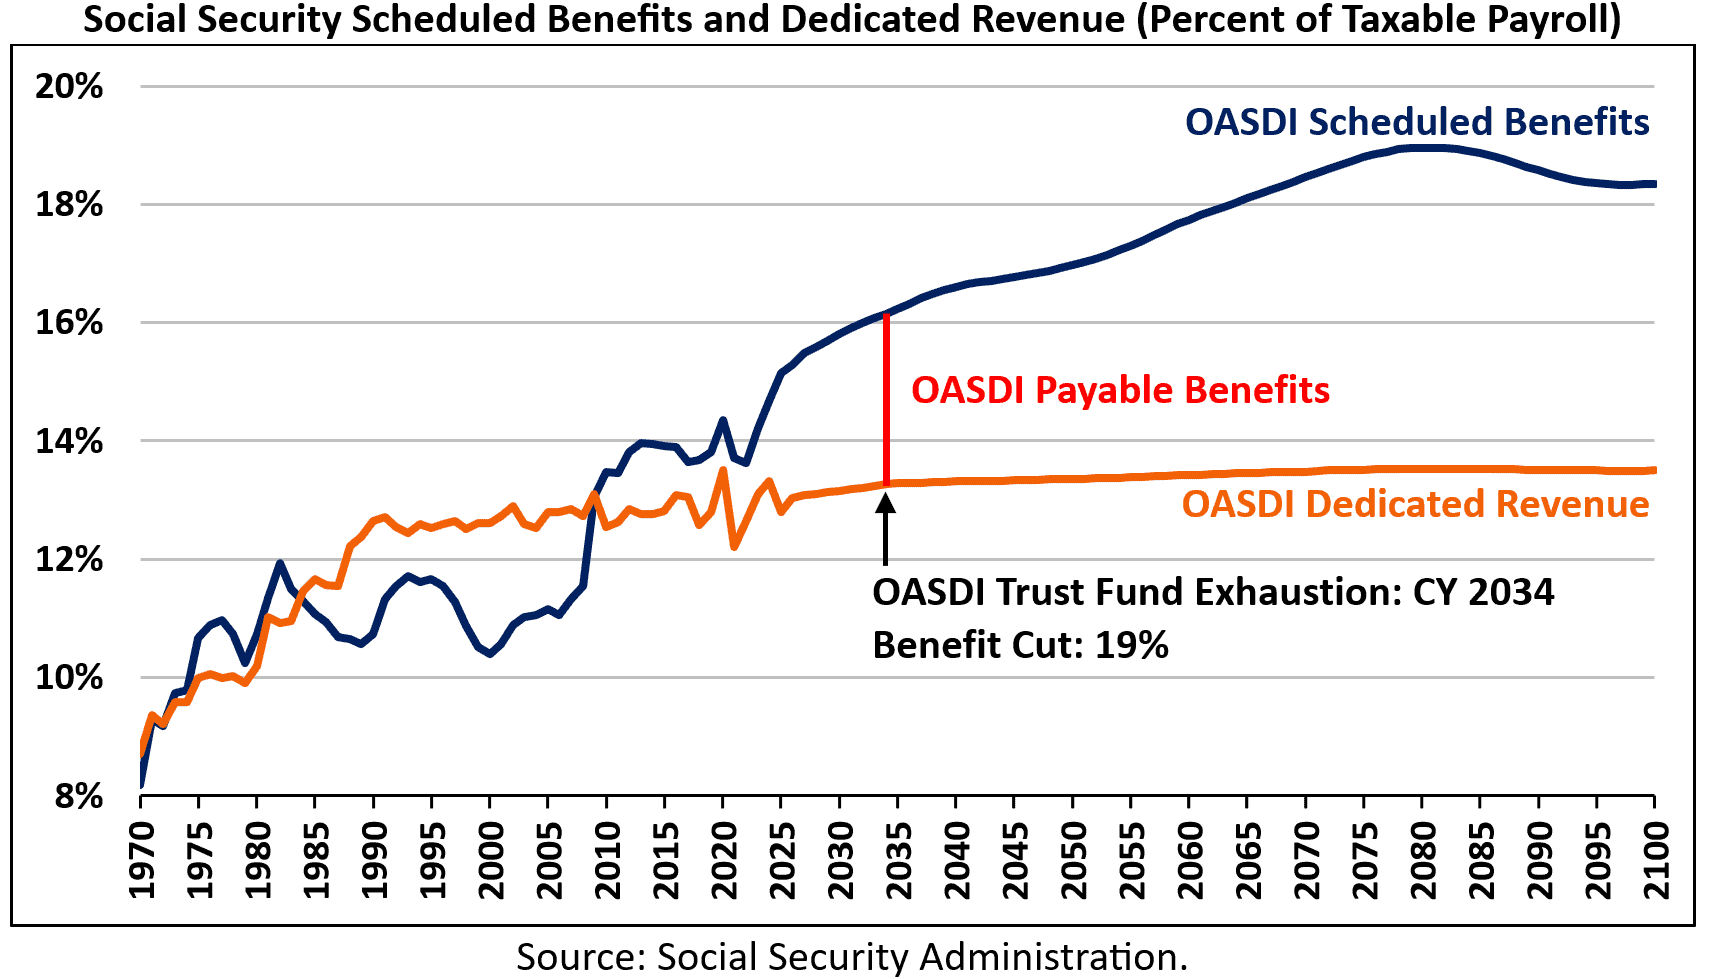
By law, Social Security’s trust funds do not have borrowing authority. This means that upon insolvency the trust funds will be unable to borrow from the U.S. Treasury to cover the gap between dedicated revenue and spending to continue paying Social Security benefits in full. The benefits that can be paid will be limited to the amount of revenue flowing into the trust funds, primarily from the 12.4-percent Social Security payroll tax. The trustees estimate that in CY 2034 the theoretically combined trust funds will have enough dedicated revenue to pay 81 percent of scheduled benefits. As a result, all beneficiaries – regardless of age, income, or need – will see their benefits cut by 19 percent.
Social Security Faces a Large and Growing Shortfall
The Social Security Trustees estimate that Social Security will run chronic deficits over both the short- and long-term. In CY 2025, it will run a cash flow deficit of $250 billion, the equivalent of 2.35 percent of taxable payroll or 0.82 percent of gross domestic product (GDP). Over the next decade (CY 2026–2035), the program will run $3.6 trillion of cash-flow deficits, which equals 2.68 percent of taxable payroll or 0.95 percent of GDP.
The trustees project that Social Security’s cash flow deficit will grow to $478 billion (2.95 percent of taxable payroll or 1.05 percent of GDP) by CY 2035, to $1.0 trillion (3.61 percent of taxable payroll or 1.26 percent of GDP) by CY 2050, to $3.8 trillion (5.29 percent of taxable payroll or 1.79 percent of GDP) by CY 2075, and to $8.7 trillion (4.84 percent of taxable payroll or 1.61 percent of GDP) by CY 2099.
Over the 75-year projection window, the trustees estimate that Social Security faces an actuarial imbalance of 3.82 percent of taxable payroll, or 1.32 percent of GDP.
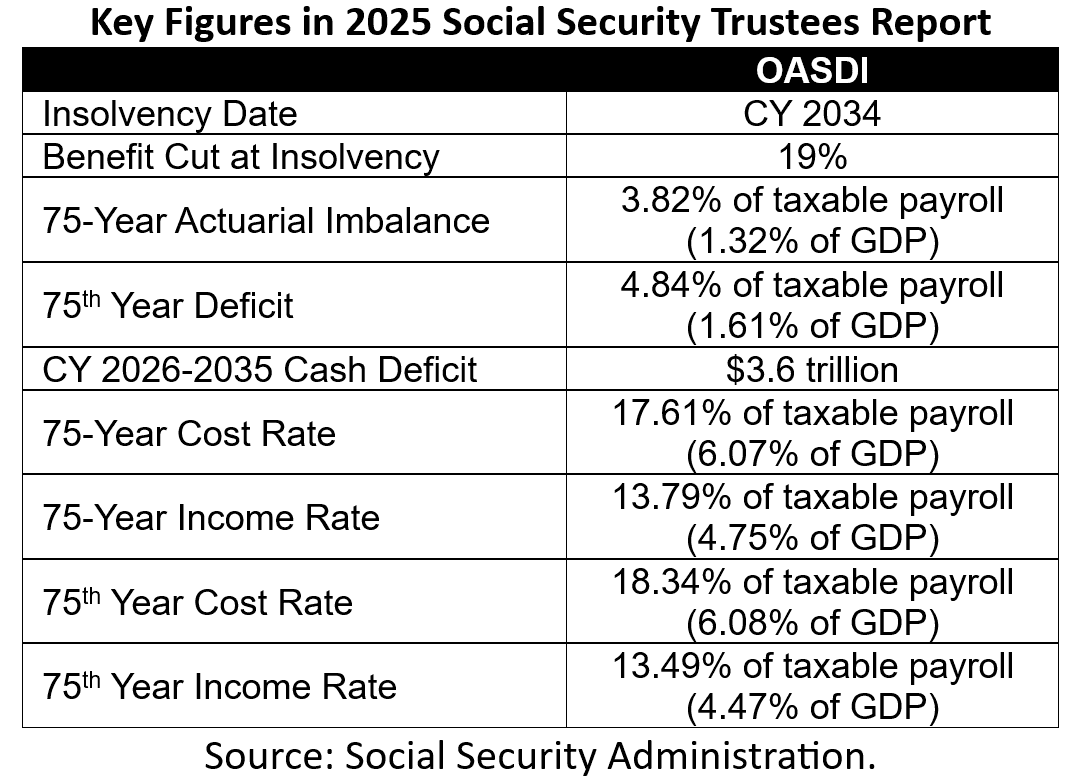
Social Security’s growing long-term shortfall is the result of rising costs due to an aging population and a diminishing ratio of covered workers to beneficiaries. Social Security costs have grown from $502 billion (11.05 percent of taxable payroll or 4.11 percent of GDP) in CY 2004 to $1.5 trillion (14.67 percent of taxable payroll or 5.09 percent of GDP) in CY 2024. The trustees estimate that costs will total $1.6 trillion (15.15 percent of taxable payroll or 4.06 percent of GDP) this year and $21.5 trillion (15.86 percent of taxable payroll or 5.61 percent of GDP) over the next decade.
Over the long term, the trustees estimate that Social Security costs will grow to $2.6 trillion (16.23 percent of taxable payroll or 5.77 percent of GDP) by CY 2035, to $4.8 trillion (16.97 percent of taxable payroll or 5.90 percent of GDP) by CY 2050, to $13.6 trillion (18.80 percent of taxable payroll or 6.36 percent of GDP) by CY 2075, and to $33.1 trillion (18.34 percent of taxable payroll or 6.08 percent of GDP) by CY 2099.
Social Security income, meanwhile, will fail to keep up with growing costs. The trustees estimate that income will total $1.4 trillion (12.80 percent of taxable payroll or 4.72 percent of GDP) this year and $17.9 trillion (13.18 percent of taxable payroll or 4.67 percent of GDP) over the next decade.
Over the long term, the trustees estimate that Social Security income will grow to $2.2 trillion (13.28 percent of taxable payroll or 4.72 percent of GDP) by CY 2035, to $3.8 trillion (13.36 percent of taxable payroll or 4.64 percent of GDP) by CY 2050, to $9.7 trillion (13.51 percent of taxable payroll or 4.57 percent of GDP) by CY 2075, and to $24.4 trillion (13.49 percent of taxable payroll or 4.47 percent of GDP) by CY 2099.
Options to Extend the Life of the Social Security Trust Funds
The Social Security Trustees recommend that policymakers act sooner rather than later to restore solvency to the Social Security trust funds, as doing so would allow the necessary changes to be phased in gradually and would give workers and beneficiaries time to adjust. The trustees estimate that 75-year solvency could be achieved with a 29 percent (3.65- percentage point) payroll tax increase today, a 22-percent benefit cut for all beneficiaries, or a 27-percent benefit cut for new beneficiaries. If policymakers wait until 2034, the payroll tax would need to increase by 34 percent (4.27-percentage points) or benefits would need to be cut by 26 percent for all beneficiaries. Eliminating benefits for new beneficiaries wouldn’t be enough to restore solvency.
As these numbers suggest, it is unlikely that policymakers would choose either a tax hike or benefit cut as the single reform to restore Social Security solvency. Instead, any plausible reform package will likely include a combination of revenue and benefit changes.
The following highlights a series of reform options that policymakers could consider.

Revenue Options
On the revenue side, policymakers could raise the Social Security payroll tax rate, increase the amount of income subject to the payroll tax, reform the taxation of Social Security benefits, or broaden the payroll tax base. Currently, earnings up to $176,100 are subject to a 12.4-percent Social Security payroll tax, the payment of which is split equally between employee and employer. Policymakers could increase the 12.4-percent payroll tax rate by 0.1-percentage points per year for 10 years until it reaches 13.4 percent (split equally between the employee and the employer). This would close 23 percent of Social Security’s 75-year solvency gap and 21 percent of its 75th year shortfall. Policymakers could also modify the current $176,100 taxable maximum (which is scheduled to increase to $184,500 in 2026) such that 90 percent of all earnings are subject to the Social Security payroll tax. This would close 21 percent of Social Security’s 75-year solvency gap and 14 percent of its 75th year shortfall.
Social Security beneficiaries are subject to income taxes on their benefits. Under current law, beneficiaries with incomes below $25,000 ($32,000 for couples) pay no taxes on their benefits; beneficiaries with incomes between $25,000 and $34,000 ($32,000 and $44,000 for couples) are taxed up to 50 percent; and beneficiaries with incomes above $34,000 ($44,000) are taxed up to 85 percent. Policymakers could reform the taxation of benefits by taxing them in a manner analogous to how private pensions are taxed, which would essentially tax a larger percentage of Social Security benefits sooner. This would close 5 percent of Social Security’s 75-year solvency gap and 4 percent of its 75th year shortfall.
Certain types of compensation are exempt from the Social Security payroll tax. This includes health insurance premiums, contributions to a Health Savings Account or Flexible Spending Account, and contributions to a qualified retirement plan (for example, 401(k)s). Policymakers could broaden the payroll tax base by, for example, expanding covered earnings to include employer and employee premiums for employer-sponsored group health insurance. This would close 28 percent of Social Security’s 75-year solvency gap and 15 percent of its 75th year shortfall. They could also subject cafeteria plans – which are employer-sponsored benefit programs that provide fringe benefits to employees on a pre-tax basis – to the Social Security payroll tax. This would close 9 percent of Social Security’s 75-year solvency gap and 5 percent of its 75th year shortfall. Alternatively, policymakers could expand Social Security coverage to include all newly hired state and local government employees. Current law allows state and local governments to opt out of enrolling their employees in Social Security if they provide a separate retirement plan for them. The employees of opt-out states and localities therefore do not pay the Social Security payroll tax (currently about one-quarter of all state and local government employees). Subjecting all newly hired state and local government employees to the Social Security payroll tax would close 4 percent of Social Security’s 75-year solvency gap.
Notably, most of these revenue options would interact positively together. Therefore, enacting some or all of them would have a larger impact collectively than individually.
Benefit Options
On the benefits side, policymakers could increase the age at which workers become eligible for Social Security benefits or reform the way in which benefits are calculated. The Social Security normal retirement age is currently 67, though workers can start claiming reduced monthly benefits at the early-eligibility age of 62. Policymakers could increase the NRA by one month every two years until it reaches 69. This reform wouldn’t change Social Security’s early eligibility age of 62 but would require seniors to wait longer to receive their full Social Security benefits. It would close 17 percent of Social Security’s 75-year solvency gap and 28 percent of its 75th year shortfall.
Initial Social Security benefits are calculated based on an individual’s average lifetime earnings. The Social Security Administration (SSA) calculates this average using a process known as wage indexing, which adjusts an individual’s prior earnings for changes in economywide wages. Policymakers could move to price indexing for initial benefits, which would adjust individuals’ average lifetime earnings for inflation rather than wage growth for determining initial Social Security benefits. This would close 74 percent of Social Security’s 75-year solvency gap and significantly more than its entire 75th year shortfall.
To calculate an individual’s Social Security benefits, SSA first looks at an individual’s 35-highest earning years to determine their average indexed monthly earnings (AIME). An individual’s AIME is then run through a progressive replacement rate formula to determine their monthly Social Security benefit if they retire at Social Security’s NRA of 67. The current benefit formula includes two “bend points” at which the marginal replacement rate for earnings changes. For 2025, the bend points are $1,226 and $7,391 and the marginal replacement rate equals 90 percent of the first $1,226 of AIME; 32 percent of AIME between $1,226 and $7,391; and 15 percent of AIME over $7,391. Policymakers could reform the 90/32/15 percent factors with a 90/32/5 structure for newly eligible beneficiaries, which would make Social Security’s benefit formula more progressive by reducing benefits for newly eligible high-income seniors. This would close 9 percent of Social Security’s 75-year solvency gap and 11 percent of its 75th year shortfall.
Another option would be for policymakers to increase the number of earning years used to determine an individual’s AIME from their 35-highest earning years to their 40-highest earning years. This means more low-earning or zero-earning years would be included in an individual’s benefit calculation, thus reducing benefits. This would close 12 percent of Social Security’s 75-year solvency gap and 14 percent of its 75th year shortfall.
Social Security benefits receive an annual cost-of-living adjustment (COLA) designed to preserve the real value of Social Security recipients’ benefits (the 2026 COLA is 2.8 percent). The COLA is currently calculated using the Consumer Price Index for Urban Wage Earners and Clerical Workers (CPI-W). The CPI-W is believed to generally overstate inflation because it only looks at price changes for a small sample of goods and does not account for how consumers substitute based on relative prices – a phenomenon known as substitution bias. Policymakers could instead use the Chained Consumer Price Index (Chained CPI) for Social Security’s annual COLA. The Chained CPI is considered a more accurate measure of inflation, especially for all federal programs and tax provisions that are indexed to inflation. The switch would close 16 percent of Social Security’s 75-year solvency gap and 17 percent of its 75th year shortfall.