Insight
January 21, 2021
Trump Administration Ends With $40 Billion in Regulatory Costs
EXECUTIVE SUMMARY
- The Trump Administration ended its term adding a net total of $40.4 billion in regulatory costs.
- Its annual average of $10.1 billion in costs is less than 10 percent of the Obama Administration’s average of $111 billion annually.
- When removing independent agencies, the Trump Administration actually achieved net regulatory savings of nearly $1 billion over its term.
INTRODUCTION
The Trump Administration entered office four years ago on a promise to “cut regulations massively.” Whether or not it succeeded depends on how one defines cutting regulations. If it means slowing the growth of new regulatory costs on the economy, then yes, the administration cut regulations massively. If it means reducing the cost of regulations, then it came up short.
According to the American Action Forum’s RegRodeo database, the Trump Administration left office adding $40.4 billion in net total regulatory costs. Though the administration added to the net total, its annual average of $10.1 billion is minimal compared to the $111 billion annual average of the Obama Administration, and even the $42.9 billion annual average of the final four years of the George W. Bush Administration (RegRodeo data on final rules goes back to 2005).
This analysis reviews the economic impacts of the Trump Administration’s regulatory policy and considers the results in the context of administrations of the past 15 years.
KEY REGULATORY NUMBERS OF THE TRUMP ADMINISTRATION
The Trump Administration finalized 1,312 rules that have estimated regulatory costs, estimated paperwork burdens, or were classified by the Government Accountability Office as “major.” Of these rules, 764 included net regulatory costs, totaling $319.4 billion. Twenty-six rules had total costs of more than $1 billion. The administration also finalized 303 rules with net regulatory savings, totaling $278.9 billion. Eighteen rules had savings of $1 billion or more.
The Trump Administration added 356.9 million hours in new annual paperwork burden.
AGENCY BY AGENCY
The table below shows all agencies whose rules’ net total economic impact exceeded $1 billion in costs or savings over the last four years.
| Agency | Total Costs/Savings ($ millions) |
| Agriculture | 9,134.3 |
| Defense | 132,297.1 |
| Energy | 1,838.5 |
| Environmental Protection Agency | -103,681.4 |
| Federal Communications Commission | 1,323.4 |
| Federal Reserve | 1,994.7 |
| Health and Human Services | 44,253.1 |
| Homeland Security | 31,617.6 |
| Interior | -3,826.7 |
| Justice | -1,031.1 |
| Labor | -17,096.0 |
| Securities and Exchange Commission | 37,583.1 |
| Transportation | -107,786.1 |
| Treasury | 10,061.2 |
| Veterans Affairs | 3,265.0 |
The agencies that imposed the most net regulatory costs were the Departments of Defense (DOD), Health and Human Services (HHS), and the Securities and Exchange Commission. DOD issued two expensive federal contracting security rules in 2020 that drove its net total. HHS’s total largely comes from its rule requiring pricing transparency from health insurers.
Those that produced the most savings were the Department of Transportation (DOT), the Environmental Protection Agency (EPA), and the Department of Labor. DOT and EPA largely rode the nearly $200 billion in savings from the Safer Affordable Fuel-Efficient Vehicles rule, which was jointly issued by the agencies. That rule includes the most savings of any rule in the RegRodeo database.
When one removes independent agencies, over which the president has less direct oversight than executive agencies, the Trump Administration achieved net regulatory savings over its term. Executive agencies accounted for a net savings of $967.3 million, while independent agencies totaled $41.4 billion in net costs.
The table below shows the agencies that added or reduced net paperwork burden by at least one million hours.
| Agency | Burden Hours |
| Agriculture | 23,223,390.4 |
| Consumer Financial Protection Bureau | 8,890,629.0 |
| Defense | 119,392,450.0 |
| Education | -2,946,301.5 |
| Environmental Protection Agency | -1,358,249.8 |
| Federal Energy Regulatory Commission | 1,033,899.8 |
| Health & Human Services | 155,240,529.1 |
| Homeland Security | 3,213,435.2 |
| Labor | 4,410,593.7 |
| Securities and Exchange Commission | 18,120,776.8 |
| State | 3,421,103.0 |
| Transportation | -2,911,455.8 |
| Treasury | 26,424,912.0 |
ADMINISTRATION BY ADMINISTRATION
The Trump Administration’s net economic impact stands in stark contrast to the second term of the George W. Bush Administration and the Obama Administration. The chart below shows the net economic impact of final rules from each year of each administration in the RegRodeo database.
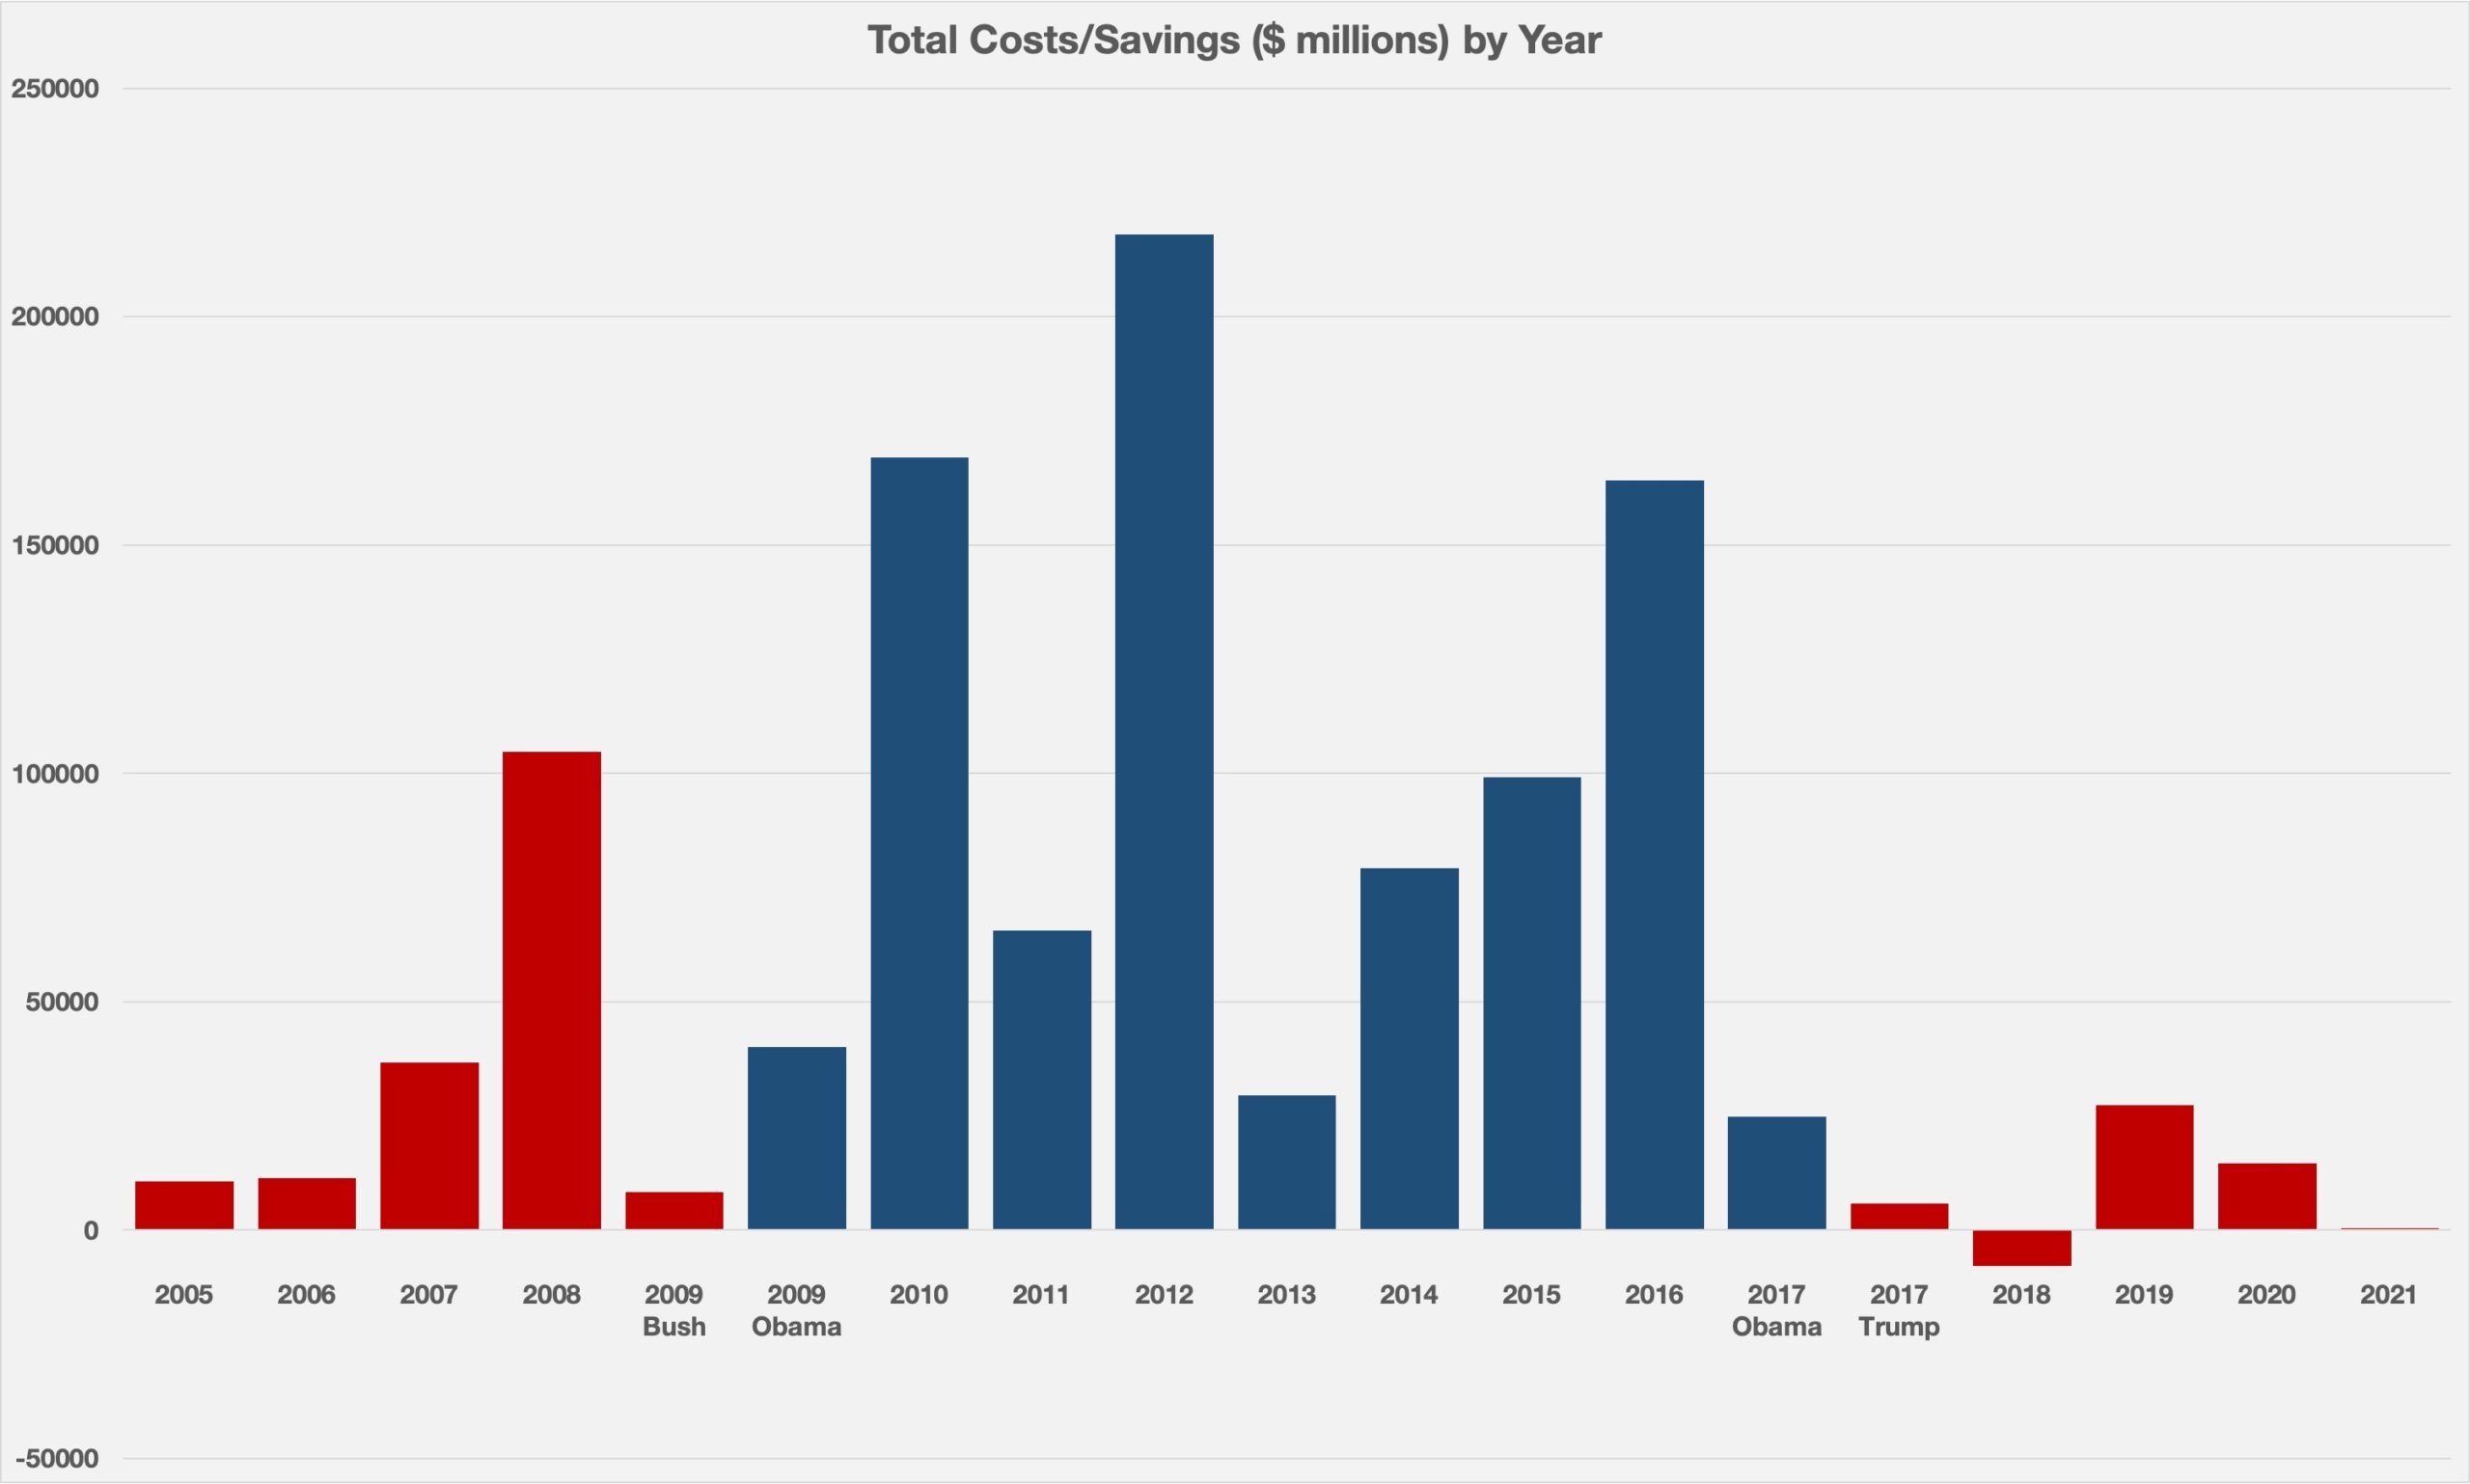
The chart clearly shows that the Trump Administration reduced the rate of new net economic costs, and even had one year that achieved net savings (2018). Six individual years of the Obama Administration added more net regulatory costs than the entirety of the Trump Administration.
REGULATORY LEGACY
The Trump Administration’s regulatory policy will be remembered for reducing the rate of net cost growth and its sharp contrast from the Obama Administration. With the Biden Administration now in office, one can expect a return to economic impacts similar to that of the Obama Administration. As such, the Trump Administration’s impact will be short lived. Already, the Biden Administration has issued executive actions undoing Trump’s significant regulatory executive orders.
A bigger question is whether the Trump Administration will be an anomaly or if it will serve as a model for future Republican administrations. That remains to be seen.