


Insight
May 18, 2026
U.S. Natural Gas Market: Soaring AI Demand and Infrastructure Constraints
Executive Summary
- The rapid expansion of artificial intelligence (AI) data centers is fueling a surge in U.S. electricity demand, positioning natural gas as a main baseload power source to meet the new demand; under a high-demand scenario, natural gas-fired generation is projected to grow by 7.3 percent between 2025 and 2027 to accommodate the AI boom.
- Despite being a top global natural gas producer, the United States sees varied regional pricing due to several factors, including pipeline constraints; specifically, high production levels and a lack of pipeline capacity have recently driven prices at the Waha Hub in Texas below -$2 per million British thermal units, while infrastructure-scarce regions such as New England continue to face higher costs.
- This insight evaluates the evolving role of natural gas in the U.S. energy mix and the critical role of pipeline infrastructure in regional accessibility, and concludes that streamlining the Federal Energy Regulatory Commission’s permitting process and passing permitting reform in Congress are essential for all regions in the United States to benefit from record natural gas production.
Introduction
The rapid expansion of artificial intelligence (AI) data centers is fueling a surge in U.S. electricity demand, positioning natural gas as a main baseload power source to meet the new demand. Under a high-demand scenario, natural gas-fired generation is projected to grow by 7.3 percent between 2025 and 2027 to accommodate the AI boom.
Despite being a top global natural gas producer, the United States sees varied regional pricing due to several factors, including pipeline constraints. Specifically, high production levels and a lack of pipeline capacity have recently driven prices at the Waha Hub in Texas below -$2 per million British thermal units, while infrastructure-scarce regions such as New England continue to face higher costs.
This insight evaluates the evolving role of natural gas in the U.S. energy mix and the critical role of pipeline infrastructure in regional accessibility. It concludes that streamlining the Federal Energy Regulatory Commission’s permitting process and passing permitting reform in Congress are essential for all regions in the United States to benefit from record natural gas production.
Natural Gas Is An Important U.S. Energy Source
Natural gas is a major energy source for the United States, accounting for about 36 percent of total U.S. energy consumption in 2024. It is primarily used for electricity generation and space heating in the United States.
Approximately 40 percent of total U.S. electricity was generated from natural gas in 2025. This figure is expected to remain relatively stable through 2027. U.S. natural gas demand is set to climb as energy-hungry artificial intelligence (AI) data centers drive a rapid surge in electricity consumption.
The U.S. Energy Information Administration (EIA) projects that natural gas will be the main energy source for electricity generation to meet the increased power demand. EIA estimated that assuming a high electricity demand scenario with significant development of data centers, natural gas electricity generation will increase by 7.3 percent from 2025 to 2027. A previous American Action Forum paper noted that that rapid growth in AI data center power demand is driving a resurgence in fossil fuel investment, with several massive natural gas projects approved in Texas and Pennsylvania this year.
As the world’s leading natural gas producer, the United States reached a significant milestone in 2017 when its dry gas production first exceeded domestic demand (Figure 1). By 2025, total output climbed to approximately 39.3 trillion cubic feet (Tcf). Despite this massive growth, domestic consumption remains high. In 2024, the United States utilized about 80 percent of its total production, totaling 30.8 Tcf.
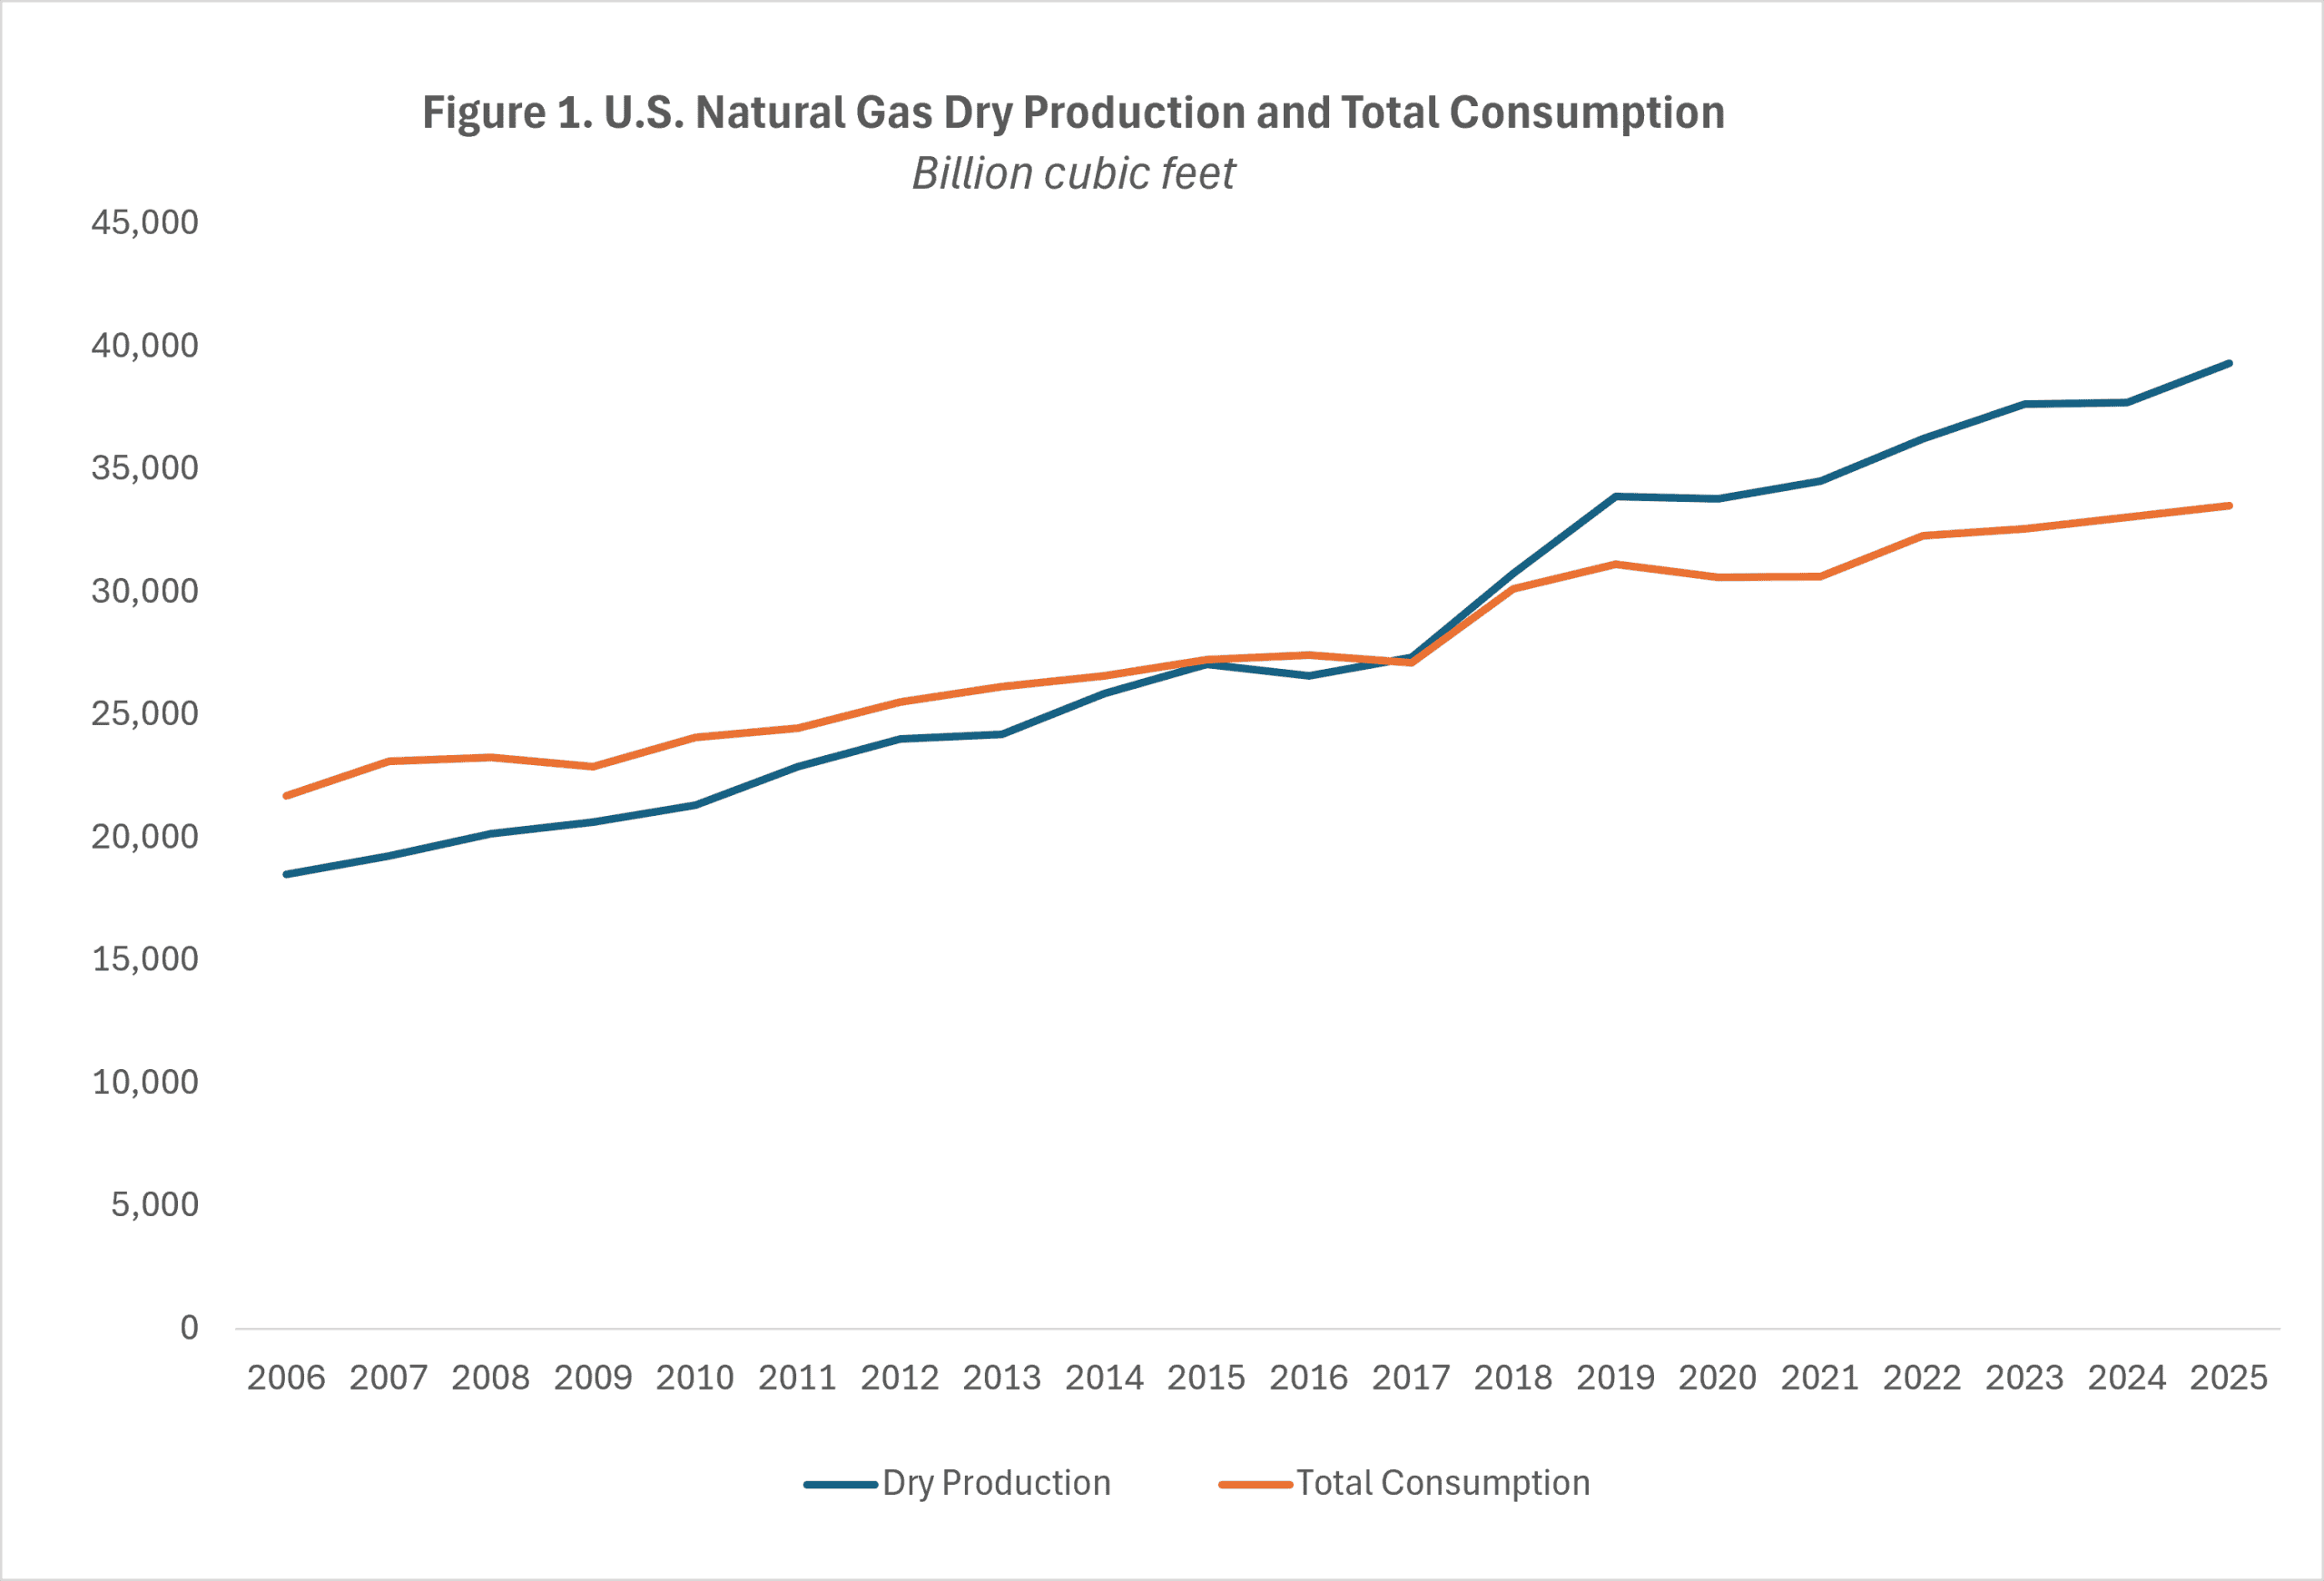
Source: U.S. Energy Information Administration
The United States is also the world’s top exporter, selling approximately 20 percent of its natural gas production to the rest of the world in 2025. AAF’s previous insight provides an analysis of U.S. production and export capacity.
Pipeline Infrastructure Drives Regional Differences in Access to Natural Gas
A spot market for natural gas is a market in which natural gas transactions are for immediate or near-term delivery. The most well-known natural gas spot market in the United States is the Henry Hub in southern Louisiana. Henry Hub prices are used as the standard benchmark U.S. national average prices for natural gas, as the hub has a large number of buyers and sellers.
As shown in Figure 2, different regional hubs have different natural gas prices on a given day. On May 14, 2026, all major hubs’ natural gas prices were above zero. This is not always the case. For example, from April 29 to May 6, the natural gas price in the Waha Hub near the Permian Basin in West Texas stayed below -$2 per million British thermal units. The negative pricing was primarily fueled by an influx of associated natural gas—a byproduct of oil extraction. This surge in production was triggered by elevated global oil prices following the recent energy shock, which incentivized drilling across the basin despite the lack of pipeline capacity for transporting natural gas.
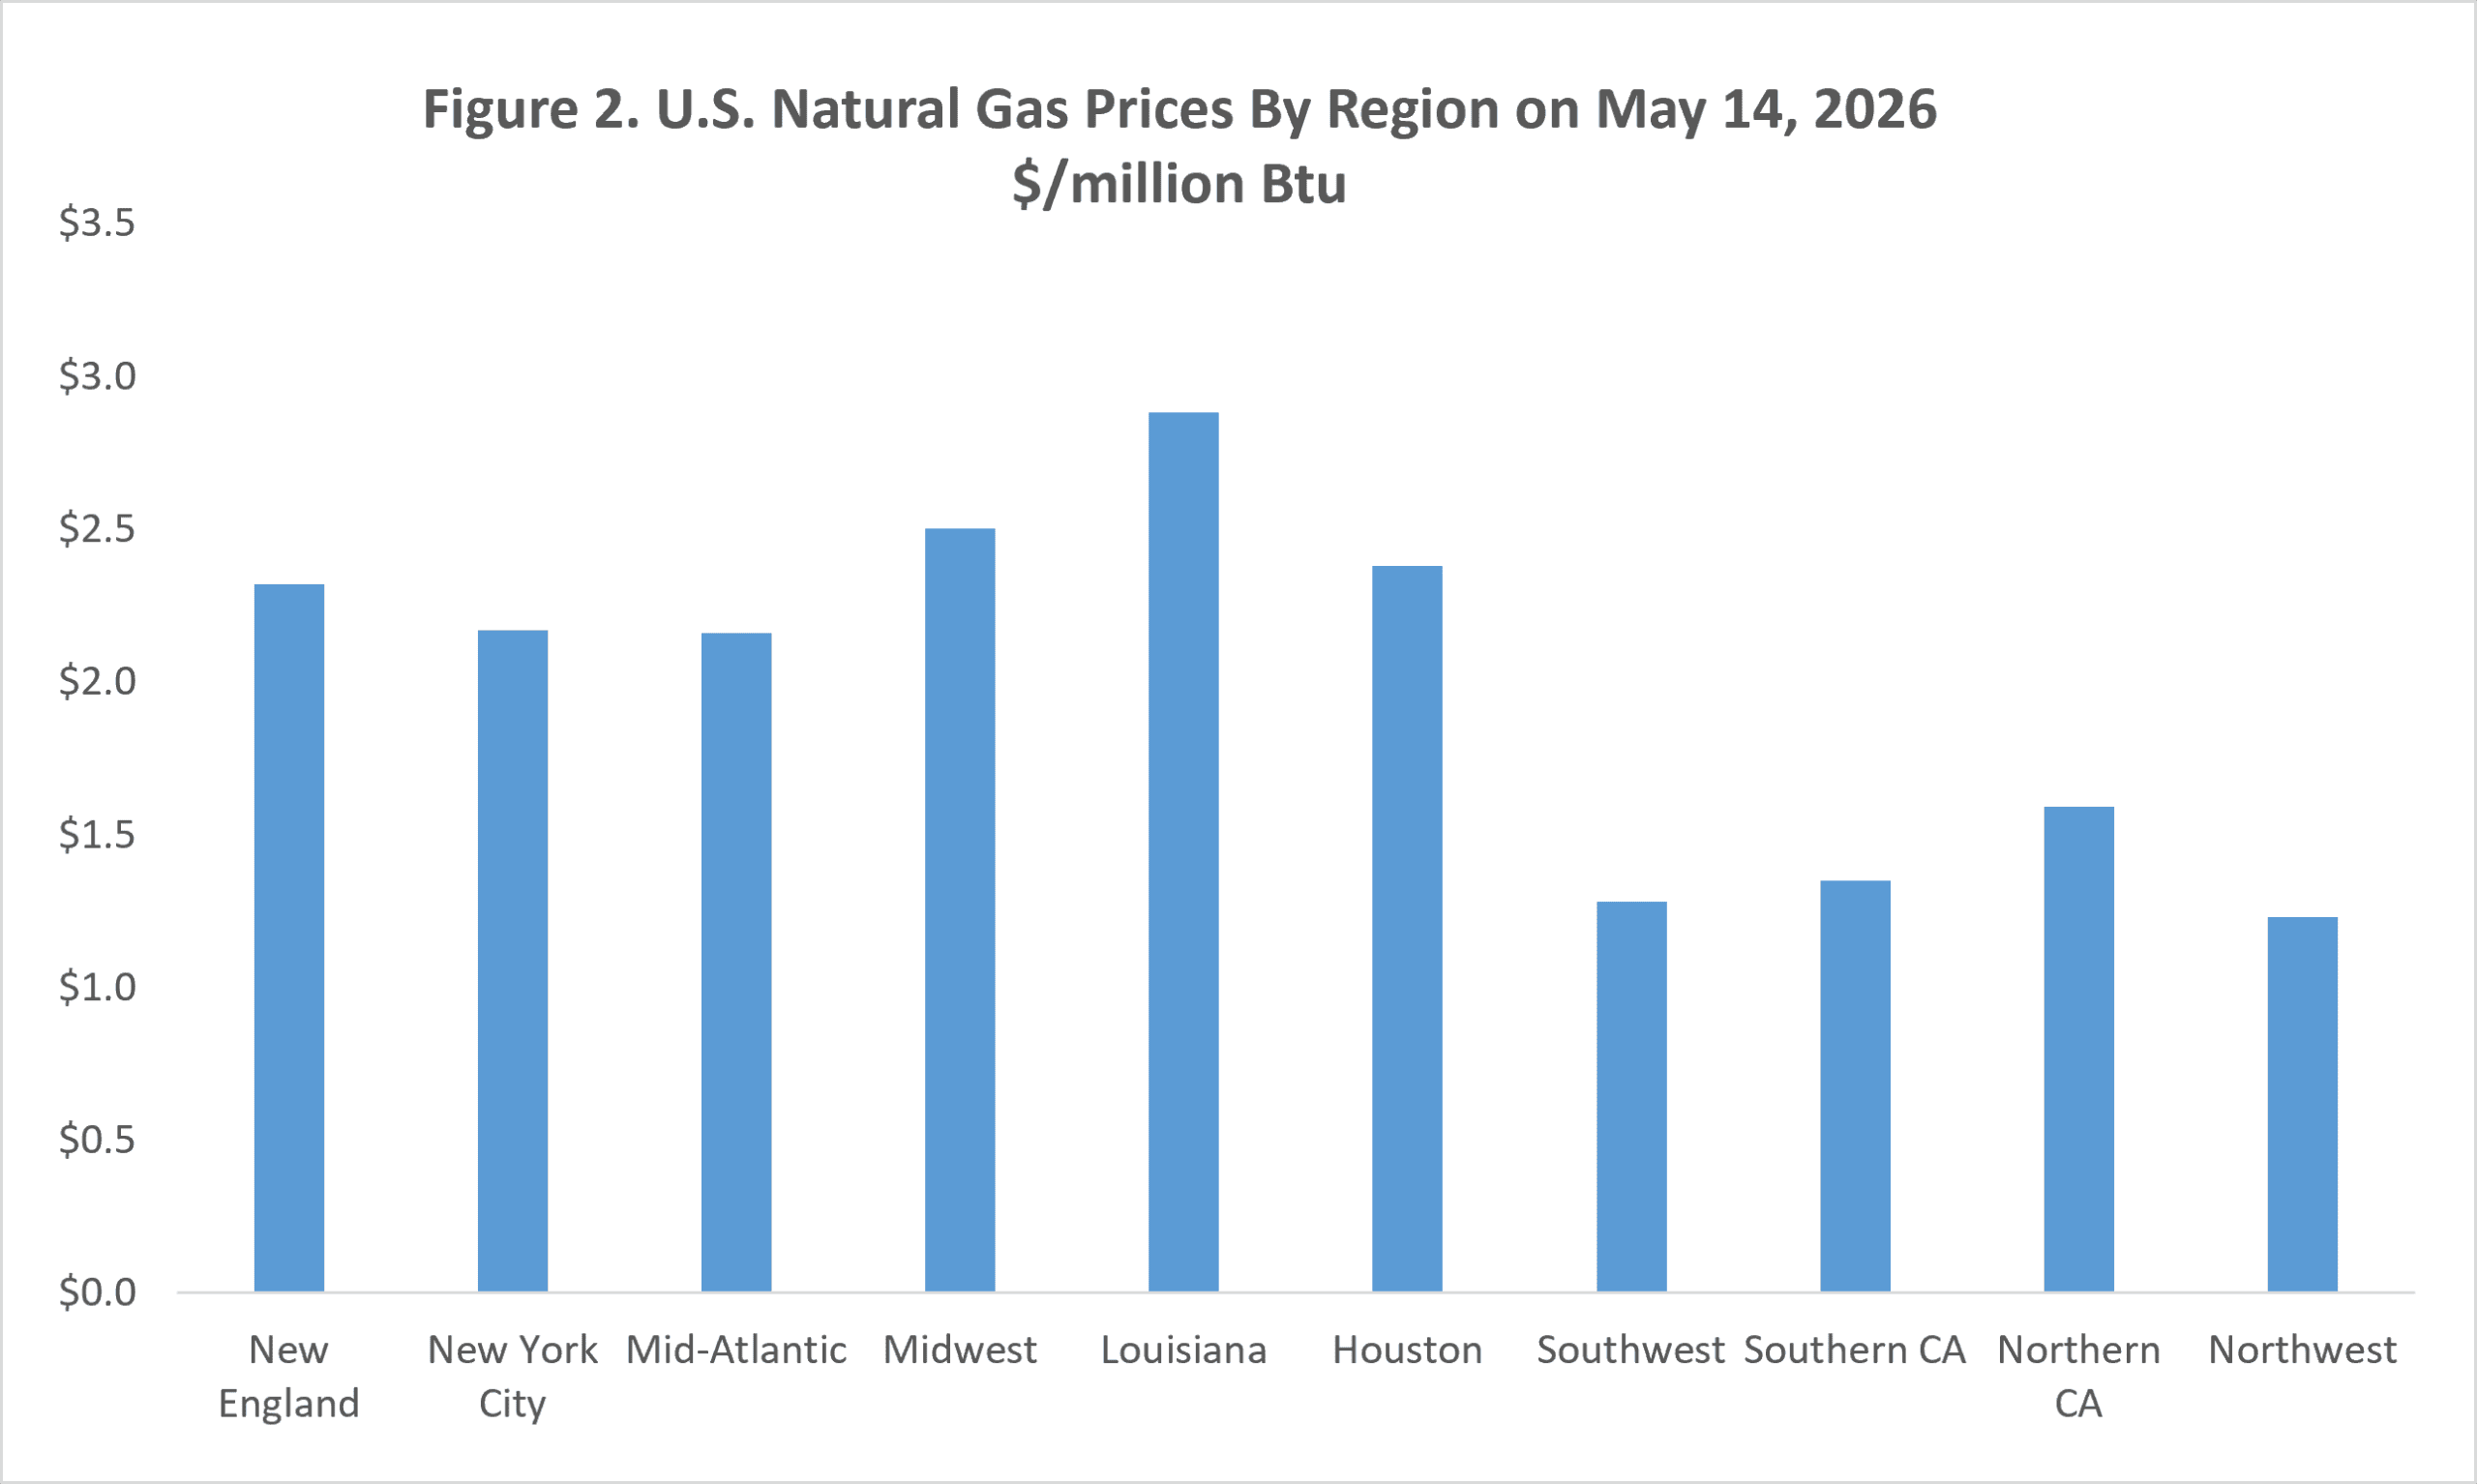
Source: U.S. Energy Information Administration
The U.S. natural gas value chain consists of production and storage sites, trading hubs, gas points at city gates at which a distribution gas utility receives gas from pipelines, and local distribution pipeline network that delivers the gas to residential and commercial consumers.
As illustrated in Figure 3, U.S. city gate prices averaged slightly above Henry Hub benchmarks from 2010 to 2022. In contrast, residential natural gas prices remained significantly higher, occasionally exceeding double the Henry Hub price.
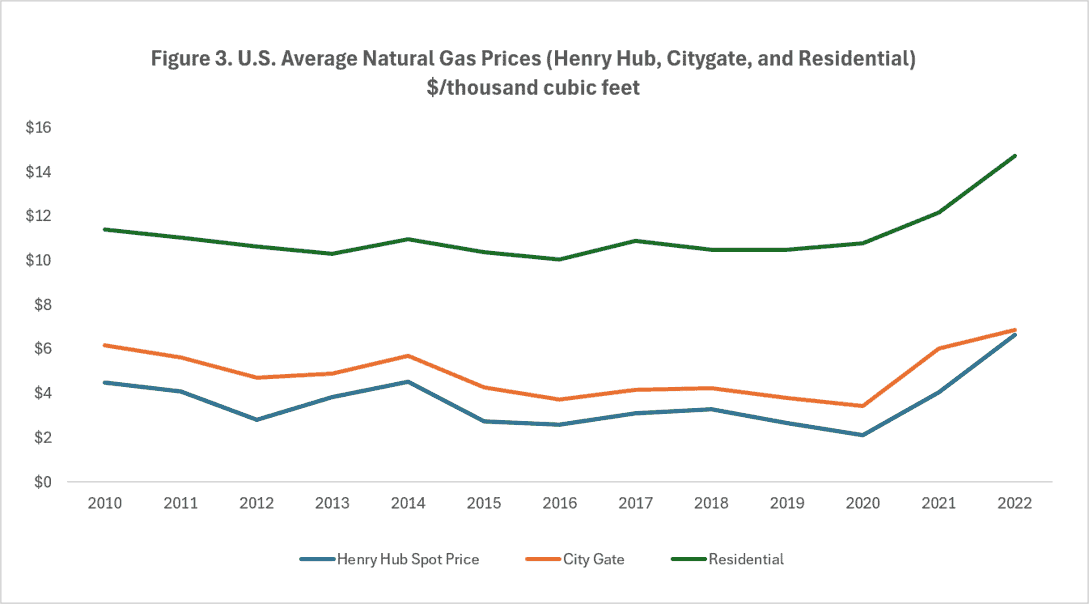
Source: U.S. Energy Information Administration
Retail prices for natural gas vary depending on the states and cities (Figure 4). There are several factors that drive the pricing differences, including distance from production and storage sites, natural gas pipeline availability and capacity, consumer demand’s timing and volatility, distribution costs and taxes, state regulations, and prices of alternative fuels.
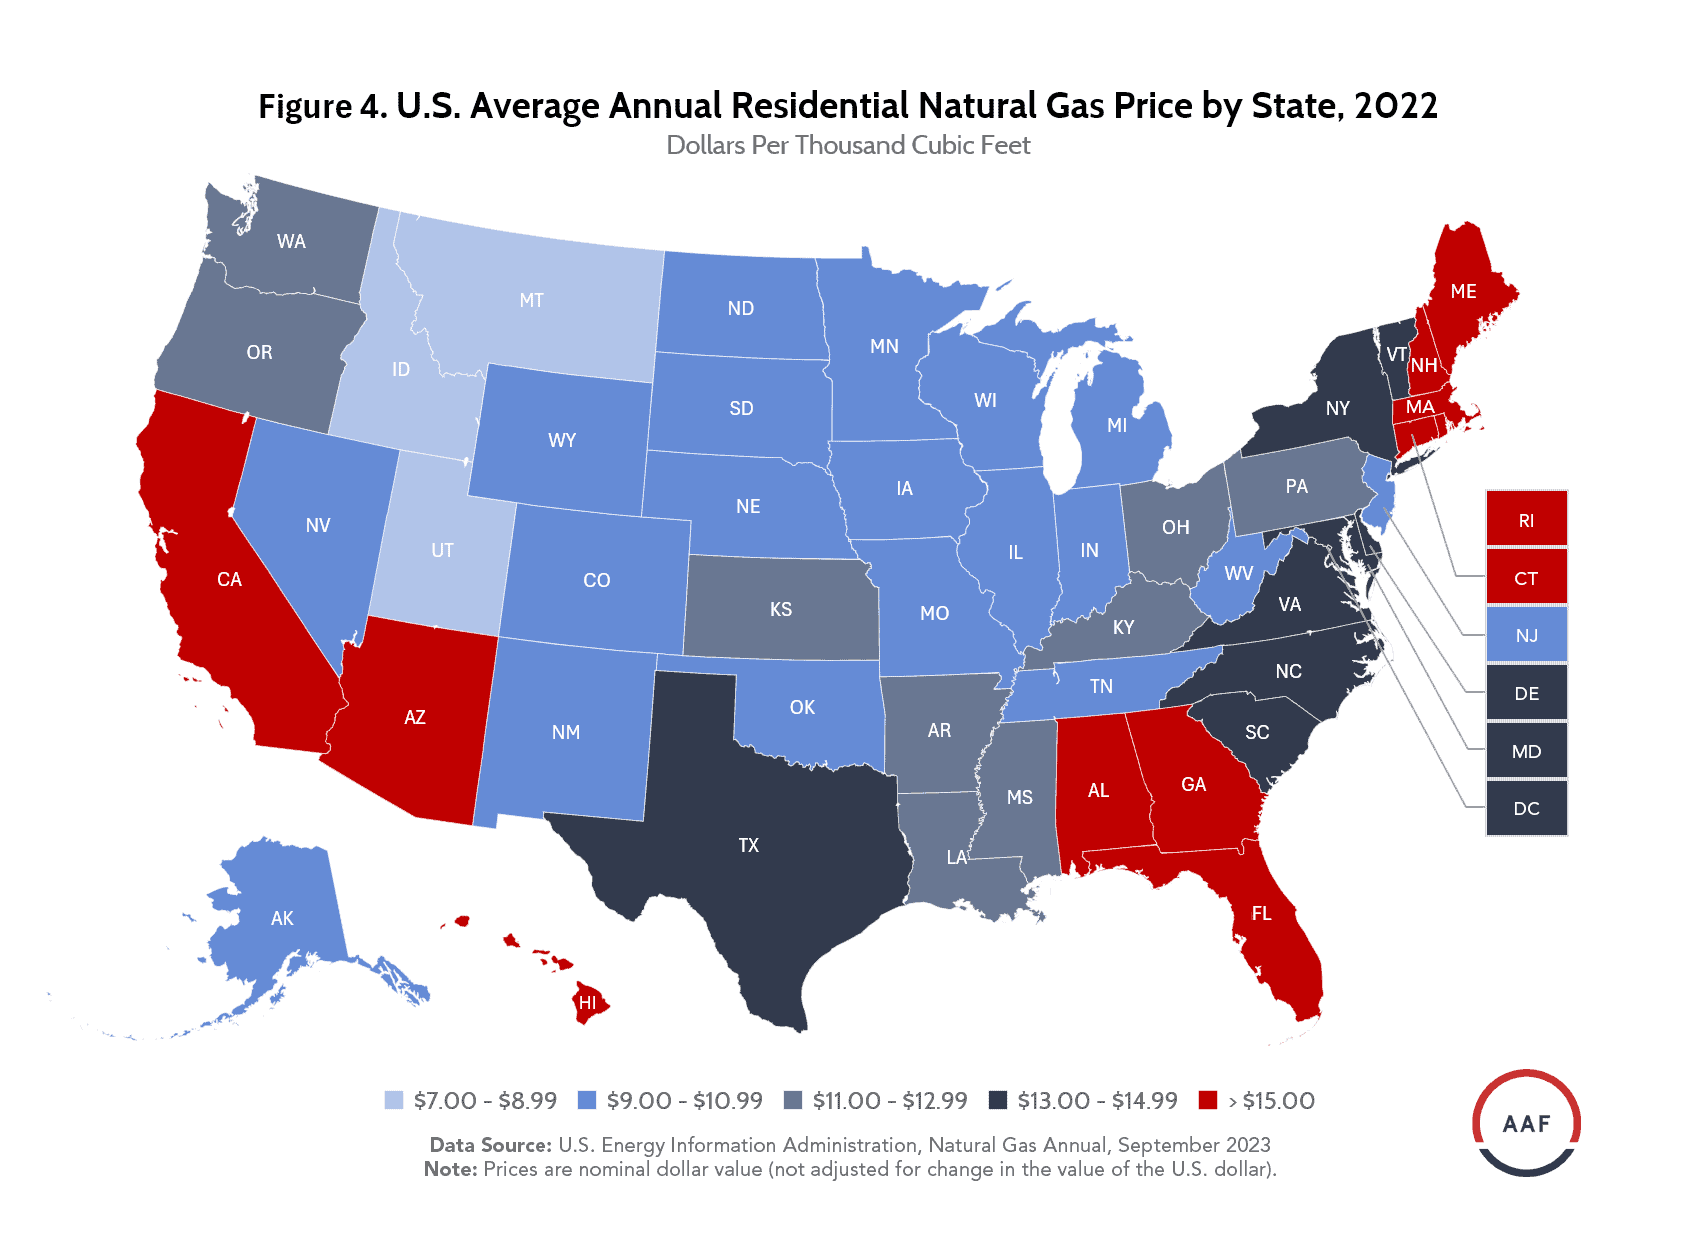 Source: U.S. Energy Information Administration
The vast U.S. natural gas pipeline network is highly integrated with about three million miles of pipelines that connect production and storage facilities with consumers. The pipeline network density varies across the country, however. Several states, including Maine, Hawaii, Alaska, Vermont, and New Hampshire, have very low density of natural gas pipeline infrastructure. As a result, these states have to rely on alternative baseload energy sources for heating or generating electricity.
For example, due to the small population and absence of local natural gas distribution infrastructure, Maine had the fifth-lowest usage of natural gas across all states in 2024. Approximately 66 percent of Maine’s residential households use petroleum products (heating oil or propane) for space heating in the winter—the highest percentage of any state. Despite Maine’s dependence on renewable energy to generate close to 60 percent of its electricity in 2024, it uses more energy per dollar of gross domestic product than other New England states and more than the national average.
Maine’s scarce natural gas pipeline infrastructure is driven by several factors, including being the easternmost state located at the end of the pipeline network, historical reliance on heating oil, local opposition, and strict climate and environmental regulations.
Enbridge, a Canadian pipeline company, recently briefed the U.S. National Energy Dominance Council on its plans for expanding its Algoquin gas transmission line in New England. But such efforts will likely be met with opposition for the reasons discussed above.
Policy Implications
While the Federal Energy Regulatory Commission (FERC) is responsible for issuing federal permits for interstate natural gas pipeline and storage facility projects. The interstate pipeline permitting process can take several years—and a range of costly activities and initiatives—from initial market assessment to obtaining authorizations. Additionally, pipeline projects have been prone to legal challenges from environmental and activist groups, which can add significant delays and setbacks to the pipeline projects.
In June 2025, FERC voted unanimously to revise its regulations regarding the National Environmental Policy Act to simplify environmental reviews in the permitting process. This initiative was directed by President Trump’s executive order Unleashing American Energy in January 2025. FERC is likely to continue to update and streamline its permitting process to improve efficiency and policy certainty for natural gas pipeline projects.
Additionally, it is critical for Congress to pass meaningful permitting reform legislation to allow fast build-out of infrastructure in the country. In fact, energy developers and a broad coalition of business groups have been advocating for Congress to pass broad permitting reform that would help accelerate the timetable for obtaining natural gas pipeline permits.
Looking Forward
The future of the U.S. natural gas market will revolve around the growing tension between skyrocketing AI data center energy demand and the physical constraints of the country’s pipeline infrastructure. The disparity between the Permian Basin’s negative pricing and New England’s premium rates highlights the varied regional access to natural gas despite the country’s high production levels.
As the United States solidifies its role as a global natural gas leader, streamlining the FERC permitting process and passing permitting reform in Congress are essential for all regions in the United States to benefit from record energy production.
