








Insight
October 18, 2026
U.S. Treasury: FY 2026 Deficit Totaled $2 Trillion
Executive Summary
- The U.S. Department of the Treasury has released its final Monthly Treasury Statement for fiscal year (FY) 2026, showing a $2.0 trillion budget deficit for the year – $217 billion higher than the deficit recorded in FY 2025; the FY 2026 deficit was the net effect of $7.4 trillion of spending and $5.4 trillion of revenue collections.
- As a share of the economy, the FY 2026 deficit was an estimated 6.1 percent of gross domestic product (GDP).
- Federal debt held by the public increased by $2.0 trillion to $32.4 trillion between FY 2025 and FY 2026; as a share of the economy, debt totaled an estimated 100 percent of GDP.
- Interest payments on the national debt totaled $1.1 trillion, surpassing spending on national defense; net interest was the third-largest federal government expenditure behind Social Security and Medicare.
A Closer Look at the $2 Trillion FY 2026 Deficit
The U.S. Department of the Treasury has released its final Monthly Treasury Statement for fiscal year (FY) 2026, showing a $2.0 trillion budget deficit for the year. The $2.0 trillion deficit was the net effect of $7.4 trillion of spending and $5.4 trillion of revenue collections. The FY 2026 deficit was $140 billion (8 percent) higher than the $1.9 trillion deficit the Congressional Budget Office (CBO) projected in its most recent baseline and $217 billion (12 percent) above the $1.8 trillion deficit recorded in FY 2025.
As a share of the economy, the FY 2026 deficit was an estimated 6.1 percent of gross domestic product (GDP), 0.3 percentage points above the 5.8 percent of GDP FY 2025 deficit.
Annual Budget Deficits, FY 2006–2026 (Billions of Dollars and Percent of GDP)
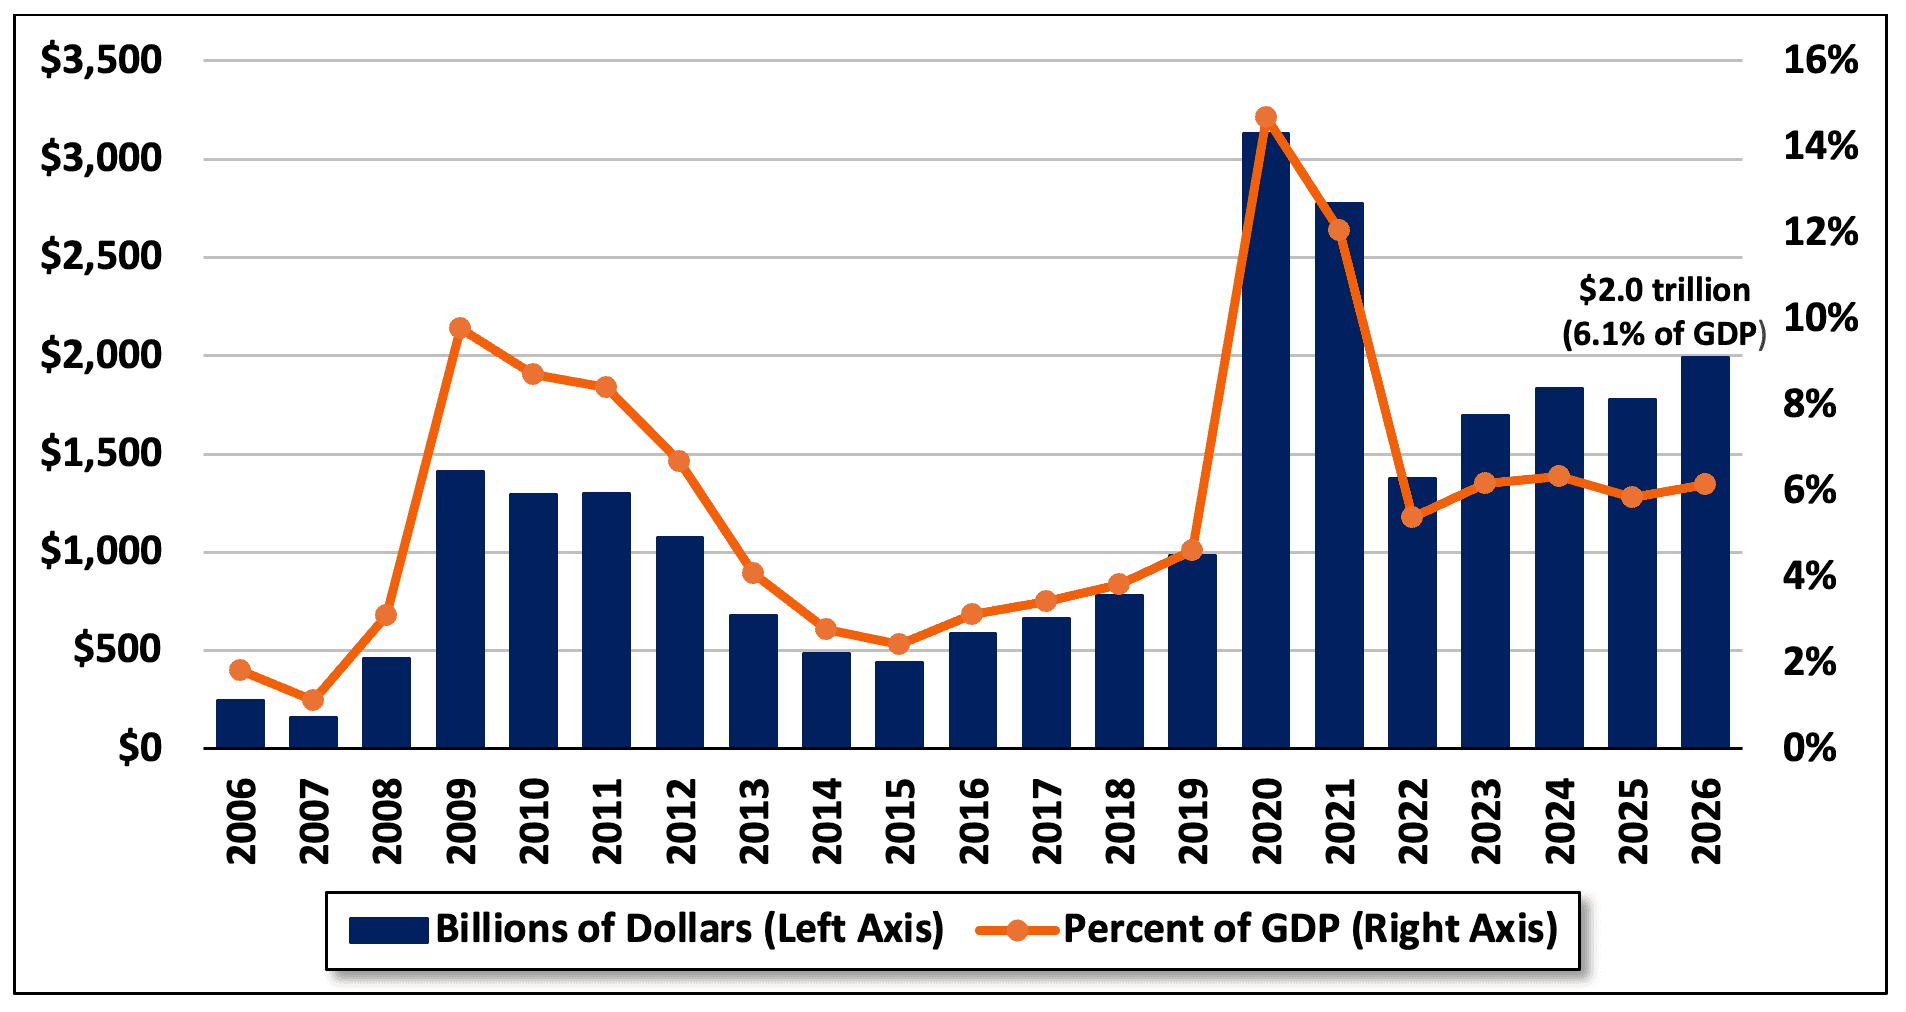
Sources: CBO, U.S. Department of the Treasury, and author’s calculations.
In nominal dollars, the FY 2026 deficit was the third-largest in history, behind only the COVID-19 pandemic-driven deficits of $3.1 trillion in FY 2020 and $2.8 trillion in FY 2021.
As budget deficits remain high, the already unsustainable trajectory of the nation’s debt accumulation continues to worsen rapidly. In FY 2026, federal debt held by the public increased by $2.0 trillion, from $30.3 trillion at the end of FY 2025 to $32.4 trillion at the end of FY 2026. As a share of the economy, the national debt was an estimated 100 percent of GDP in FY 2026. At a projected 100 percent of GDP, the national debt is nearly twice the 50-year historical average of 51 percent of GDP and just over 6 percentage points below the record of 106 percent of GDP set just after World War II in FY 1946.
Federal Debt Held by the Public, FY 2006–2026 (Percent of GDP)

Sources: CBO, U.S. Department of the Treasury, and author’s calculations.
The $217 billion increase in the deficit between FY 2025 and FY 2026 was the net result of $305 billion higher mandatory and discretionary spending, $81 billion higher interest payments on the national debt, and $169 billion of greater revenue collections.
Revenue collections increased by $169 billion (3 percent) between FY 2025 and FY 2026, from $5.2 trillion to $5.4 trillion. Individual income tax revenue increased by $189 billion (7 percent), from $2.7 trillion to $2.8 trillion, due to higher wages and salaries. Payroll tax revenue – which comes primarily from the 12.4 percent Social Security payroll tax and the 2.9 percent Medicare payroll tax – increased by $63 billion (4 percent), from $1.7 trillion to $1.8 trillion, also because of higher wages and salaries. Specifically, Social Security payroll tax revenue grew by $58 billion (4 percent) to $1.3 trillion, while Medicare payroll tax revenue increased by $11 billion (3 percent), from $395 billion to $406 billion. Other payroll tax revenue fell by $5 billion (7 percent), from $69 billion to $64 billion. Estate and gift tax revenue increased by $9 billion (31 percent), from $29 billion to $39 billion.
Corporate income tax revenue declined by $71 billion (16 percent), from $452 billion to $381 billion, due to the One Big Beautiful Bill’s business tax changes, including larger tax deductions for certain business investments.
Excise tax revenue remained relatively flat at $106 billion, while customs duties fell by $22 billion (11 percent), from $195 billion to $173 billion. Customs duties were larger early in FY 2026 (October through April) but drastically declined between May and September as the federal government issued about $130 billion of the $166 billion of total eligible tariff refunds to businesses that paid tariffs imposed under the International Emergency Economic Powers Act, which the Supreme Court ruled illegal. Revenue from other sources fell by $1 billion (3 percent), from $48 billion to $47 billion, though remittances from the Federal Reserve to the U.S. Treasury grew by $5 billion (91 percent), from $5 billion to $10 billion.
Excise tax revenue remained relatively flat at $106 billion, while customs duties fell by $22 billion (11 percent), from $195 billion to $173 billion. Customs duties were larger early in FY 2026 (October through April) but drastically declined between May and September as the federal government issued about $130 billion of the $166 billion of total eligible tariff refunds to businesses that paid tariffs imposed under the International Emergency Economic Powers Act, which the Supreme Court ruled illegal. Revenue from other sources fell by $1 billion (3 percent), from $48 billion to $47 billion, though remittances from the Federal Reserve to the U.S. Treasury grew by $5 billion (91 percent), from $5 billion to $10 billion.
Breaking Down the $2.0 Trillion FY 2026 Budget Deficit
| Budget Area |
FY 2026 |
FY 2025 | $ Change |
% Change |
| Social Security |
$1.7 trillion |
$1.6 trillion | +$86 billion |
+5% |
| Medicare |
$1.1 trillion |
$997 billion | +$76 billion |
+8% |
| Medicaid |
$723 billion |
$668 billion | +$55 billion |
+8% |
| Children’s Health Insurance Program |
$25 billion |
$23 billion | +$2 billion |
+9% |
| Affordable Care Act Premium Tax Credits |
$126 billion |
$129 billion | -$3 billion |
-2% |
| Earned Income Tax Credit |
$68 billion |
$66 billion | +$2 billion |
+4% |
| Child Tax Credit |
$29 billion |
$27 billion | +$2 billion |
+8% |
| National Defense |
$965 billion |
$917 billion | +$49 billion |
+5% |
| Veterans’ Benefits and Services |
$416 billion |
$377 billion | +$39 billion |
+10% |
| Department of Commerce |
$15 billion |
$30 billion | -$15 billion |
-50% |
| Department of Education |
$75 billion |
$35 billion | +$41 billion |
+117% |
| Department of Housing and Urban Development |
$68 billion |
$51 billion | +$18 billion |
+35% |
| Environmental Protection Agency |
$17 billion |
$37 billion | -$19 billion |
-53% |
| Small Business Administration |
$12 billion |
$0.8 billion | +$11 billion |
+1313% |
| Other Non-Interest Spending |
$1.1 trillion |
$1.1 trillion | -$38 billion |
-3% |
| Net Interest |
$1.1 trillion |
$971 billion | +$81 billion |
+8 % |
| Total Spending |
$7.4 trillion |
$7.0 trillion | +$386 billion |
+6% |
| Individual Income Taxes |
$2.8 trillion |
$2.7 trillion | +$189 billion |
+7% |
| Payroll Taxes |
$1.8 trillion |
$1.7 trillion | +$63 billion |
+4% |
| Estate and Gift Taxes |
$39 billion |
$29 billion | +$9 billion |
-31% |
| Corporate Income Taxes |
$381 billion |
$452 billion | -$71 billion |
-16% |
| Excise Taxes |
$106 billion |
$106 billion | +$0.1 billion |
+0.1% |
| Customs Duties |
$173 billion |
$195 billion | -$22 billion |
-11% |
| Other Taxes |
$47 billion |
$48 billion | -$1 billion |
-3% |
| Total Revenue |
$5.4 trillion |
$5.2 trillion | +169 billion |
+3% |
| Total Budget Deficit |
-$2.0 trillion |
-$1.8 trillion | +$217 billion | +12% |
Sources: U.S. Department of the Treasury and author’s calculations. Numbers may not sum due to rounding.
Total federal spending increased by $386 billion (6 percent) between FY 2025 and FY 2026, growing from $7.0 trillion to $7.4 trillion. Social Security spending increased by $86 billion (5 percent), from $1.6 trillion to $1.7 trillion, driven by the 2.8 percent cost-of-living adjustment for 2026 and an increase in the number of Social Security beneficiaries.
Medicare spending rose by $76 billion (8 percent), from $997 billion to $1.1 trillion, due to increased enrollment and higher payment rates for services. Medicaid spending increased by $55 billion (8 percent), from $668 billion to $723 billion, because of higher per-enrollee costs. Children’s Health Insurance Program spending rose by $2 billion (9 percent), from $23 billion to $25 billion, and spending on the Affordable Care Act’s Premium Tax Credits fell by $3 billion (2 percent), from $129 billion to $126 billion, because the enhanced subsidies expired at the end of 2025, which reduced assistance and marketplace enrollment.
Spending on the Earned Income Tax Credit rose by $2 billion (4 percent), from $66 billion to $68 billion, while spending on the Child Tax Credit increased by $2 billion (8 percent), from $27 billion to $29 billion. National defense spending increased by $49 billion (5 percent), from $917 billion to $965 billion, in part because of higher spending on military personnel and research and development. Spending on veterans’ benefits and services rose by $39 billion (10 percent), from $377 billion to $416 billion, because of increased per-person spending and use of health care facilities by veterans.
Department of Commerce spending fell by $15 billion (15 percent), from $30 billion to $15 billion, because the department spent less money to support semiconductor manufacturing in FY 2026 than it did in FY 2025. Department of Housing and Urban Development spending rose by $18 billion (35 percent), from $51 billion to $68 billion, mostly because the department recorded a smaller downward revision in the estimated cost of outstanding housing loan guarantees in FY 2026 than it did in FY 2025.
Department of Education spending increased by $41 billion (117 percent), from $35 billion to $75 billion, for several reasons. One is an accounting maneuver in which the Trump Administration recorded a $131 billion reduction in outlays in September 2025 to reflect the One Big Beautiful Bill’s modifications to the federal student loan program. Another reason was a reduction in the estimated costs of outstanding federal student loans. The final reason is a $12 billion reduction in spending from the Education Stabilization Fund.
Spending by the Environmental Protection Agency fell by $19 billion (53 percent), from $37 billion to $17 billion, because of a disbursement of funds in November and December of 2024 for a grant program established by the Inflation Reduction Act that did not occur in FY 2026.
Small Business Administration spending rose by $11 billion (1,313 percent), from $0.8 billion to $12 billion, because the agency recorded a $10 billion increase in the cost of its outstanding disaster loans in FY 2026.
Other non-interest spending fell by $38 billion (3 percent), from $1.10 trillion to $1.06 trillion.
Interest payments on the national debt increased by $81 billion (8 percent), from $971 billion to $1.1 trillion, because the debt was larger and long-term interest rates were higher. A decline in short-term interest rates partially offset the increase in interest payments. Interest spending was the third-largest federal government expenditure, exceeded only by Social Security and Medicare. Interest costs exceeded federal spending on national defense and were also higher than spending on Medicaid, food and nutrition services, and veterans’ benefits and services, among other federal programs. Net interest was equivalent to 19 percent of all federal revenue collections in FY 2026.