Research
August 14, 2018
A Look At Rural Broadband Economics
Executive Summary
The Trump Administration has proposed expanding broadband Internet to improve the economic vitality of rural areas. While many reports highlight a simple lack of broadband in rural areas, policymakers should understand the nuances of broadband Internet and access to it before creating any specific policy.
This study examines the official definition of broadband, the availability of broadband across the country, and its impact on economic growth in rural regions. It draws several conclusions.
- The Federal Communication Commission’s (FCC) definition of broadband has significant implications for the number of people who have access to broadband. Slightly decreasing the official speed threshold for broadband increases the number of people with it by about 1.5 million.
- Both metropolitan cores (effectively the center of major cities) and micropolitan cores (regions with between 10,000 and 50,000 people) have broad access to broadband, while surrounding areas tend to show marked differences in broadband availability.
- Rural regions tend to be portrayed as farmland, but farms constitute the smallest portion of those without broadband access among all rural economic types.
- Finally, an econometric model of FCC data suggests that the presence of broadband does little to explain the unemployment rate, median household income, the change in employment, or the rate of population change in rural regions. Broadband adoption measures are far better at explaining these trends.
Introduction
The Trump Administration has highlighted the need for economic growth in America’s rural regions, with an emphasis on expanding faster broadband Internet access in these areas. Broadband can act as an economic stimulus, the thinking goes, so expanding broadband in rural areas will spur economic growth in these areas. In particular, the Trump Administration has focused on “micropolitan” areas—towns with between 10,000 and 50,000 people—in its broadband expansion efforts.
The proposal raises several questions. How should policymakers think about what broadband is and who needs it? Are rural regions the best areas for the government to focus on broadband development? And does broadband Internet truly stimulate local economies? This study examines these central questions using data from the Federal Communications Commission (FCC) and other sources. Its conclusions counsel a nuanced approach to broadband policy that is targeted to those individuals who have not adopted broadband Internet.
Broadband Speed Thresholds
Broadband Internet itself is not a uniform product, as it can come in different speeds and through different channels. As a result, the definition of broadband matters a lot. In 2015, the Federal Communications Commission (FCC) increased the technical threshold for Internet to be considered broadband from 4 megabits per second (Mbps) download and 1 Mbps upload to a new standard of 25 Mbps download and 3 Mbps upload, sometimes abbreviated as 25/3. By increasing the limits for the definition of broadband, the number of regions with broadband service decreased. This shift is important, as it effectively expanded the number of areas that are the focus of federal policies. In the 2018 Broadband Deployment Report, the FCC noted, “over 24 million Americans still lack fixed terrestrial broadband at speeds of 25 Mbps/3 Mbps.”
This statistic has several major shortcomings. For one, it excludes satellite technologies, which have advanced in recent years. In 2016 alone, companies filed paperwork to launch 8,731 non-geostationary orbit (NGSO) communications satellites. When satellite is included in the broadband mix, official statistics jump up. Just over 14 million Americans don’t have access to broadband-speed Internet when satellite is included—a drop of over 10 million people, translating into 95.6 percent coverage of people in the United States instead of 92.3 percent.
Using Form 477 data collected by the FCC, this study constructed a searchable database of every Census block. Broadband providers are required to file data with the FCC twice a year detailing where they offer Internet access service by Census block. This data set allows the reproduction of the FCC’s official broadband-access statistics as well as an analysis of how many people have access to broadband at different speeds.
The definition of broadband matters. For example, if the FCC were to shift the broadband speed threshold slightly, to 24 Mbps download and 2 Mbps upload, then nearly 1.5 million more people would have access to broadband. If the FCC lowered the standard to 20 Mbps download and 2 Mbps upload, then another 1.3 million people would have broadband. The graph below displays the max broadband speed available to the total population, while the red line marks the FCC’s current broadband standard.
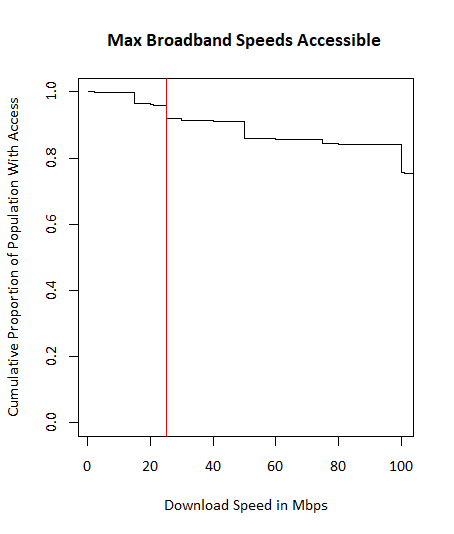
Note that the proportion of people with access to broadband at certain speeds does not drop smoothly; “cliffs” dominate the relationship between speed and access, and the current definition is right on the second cliff.
Further, the access to speeds of 25 Mbps/3 Mbps might not even be relevant for many users. The FCC noted the following caveat in a report released a few months before its 2015 definition change:
[T]he performance increase diminishes beyond about 10 Mbps, as latency and other factors begin to dominate. For these high-speed tiers, consumers are unlikely to experience much if any improvement in basic web browsing from increased speed–i.e., moving from a 10 Mbps broadband offering to a 25 Mbps offering.
The FCC does note that speeds higher than 10 Mbps may be better for a “multi-user household, or where a consumer is using a specific application,” but for many users, speeds higher than 10 Mbps may not be relevant.
Estimating Broadband Availability in Rural Regions
Many news reports focus on how rural areas lack broadband access, but there isn’t a single accepted definition of rural. The United States Department of Agriculture (USDA) notes that “any simple dichotomy hides a complex rural-urban continuum, with very gentle gradations from one level to the next.” And these gradations have implications for access to broadband.
One way to tease out the implications of these gradations uses the Rural Urban Continuum Code to chart broadband access according to the FCC’s 25/3 definition. These codes use the official Office of Management and Budget (OMB) metro and nonmetro categories, but subdivide them into three metro and six nonmetro categories to create a continuum from heavily urban to highly rural. One code is then assigned to every county in the United States.
Table 1: The Percent Population Without Broadband Access by Rural Urban Continuum Codes
| Rural Urban Continuum Code | Population Without Broadband Access | Percent Population Without Broadband Access |
| Metro Counties | ||
| 1 – Counties in metro areas of 1 million population or more | 3,420,021 | 2% |
| 2 – Counties in metro areas of 250,000 to 1 million population | 3,185,845 | 5% |
| 3 – Counties in metro areas of fewer than 250,000 population | 2,501,860 | 9% |
| Nonmetro Counties | ||
| 4 – Urban population of 20,000 or more, adjacent to a metro area | 1,758,102 | 13% |
| 5 – Urban population of 20,000 or more, not adjacent to a metro area | 547,094 | 11% |
| 6 – Urban population of 2,500 to 19,999, adjacent to a metro area | 3,832,585 | 28% |
| 7 – Urban population of 2,500 to 19,999, not adjacent to a metro area | 2,132,546 | 28% |
| 8 – Completely rural or less than 2,500 urban population, adjacent to a metro area | 802,502 | 42% |
| 9 – Completely rural or less than 2,500 urban population, not adjacent to a metro area | 942,563 | 40% |
As the regions become less dense according to this schema, the percentage of the population without broadband access gradually increases, from a low of 2 percent in large metro counties to a high of 42 percent in completely rural counties. This view of access to broadband highlights a noticeable break between the metro and nonmetro regions—a break that could support government efforts to expand access.
A county can be a large area with a lot of variation within it, however, so a finer analysis could reveal different results. Consider the table below, which lays out the percent of the population without broadband broken down by the Rural-Urban Commuting Area (RUCA) Codes. OMB’s metropolitan and micropolitan terminology is still used in RUCA codes, as the USDA notes, but instead of summarizing data at the county level, the RUCA categorization uses Census tracts, providing a more detailed geographic pattern of urban and rural areas. RUCA codes categorize areas by how much people commute towards a dense core, which shows the area’s economic connection. The codes range from a metropolitan area core, which is a highly dense urban area, to a rural area, which has no direct economic connection to urban areas.
Table 2: The Percent Population Without Broadband Access by Rural-Urban Commuting Codes
| Rural-Urban Commuting Code | Population Without Broadband Access | Percent Population Without Broadband Access |
| Metropolitan area core | 2,725,356 | 1% |
| Metropolitan area high commuting | 5,303,308 | 17% |
| Metropolitan area low commuting | 813,223 | 32% |
| Micropolitan area core | 1,085,625 | 6% |
| Micropolitan high commuting | 2,134,262 | 29% |
| Micropolitan low commuting | 543,626 | 37% |
| Small town core | 1,494,225 | 17% |
| Small town high commuting | 1,041,361 | 42% |
| Small town low commuting | 501,044 | 45% |
| Rural areas | 3,491,472 | 38% |
Using this method, the gradual change from metro to nonmetro becomes more punctuated. Both metropolitan and micropolitan cores have broad access compared to the areas surrounding them. And the cores of small towns have about the same access to broadband as the suburbs of metro regions. The Trump Administration has said it will focus its efforts on micropolitan areas, but where access seems to be lacking are those regions immediately surrounding population cores.
Broadband Availability in Different Economic Types of Rural Counties
The rural United States is economically diverse, yet rural counties tend to have dominant industries. Using the most recent data from the USDA, the table below presents the six broad types. Nonspecialized counties, which don’t have any dominant employer, make over a third of all rural countries, forming the largest chunk. Behind that, manufacturing counties make up the second largest contingent, comprising nearly a fifth of all counties. Counties with government jobs and recreational industries each make up about 13 percent of all rural counties. Mining and farming regions fill out the rest with about 7 percent of all rural counties each.
Table 3: Population and Income by County Economic Type
| County Industry Type | Percent of Total Rural Population | Median Household Income |
| Nonspecialized | 37% | $43,050 |
| Farming | 6% | $46,350 |
| Mining | 7% | $48,931 |
| Manufacturing | 22% | $45,549 |
| Federal/State Government | 14% | $43,805 |
| Recreation | 13% | $49,457 |
Breaking down these counties into their economic type helps to tease out some of the relationships between the economics of a region and the amount of access to broadband. The table below presents broadband access by the economic type of the county.
Table 5: Income and Broadband Access by Rural County Economic Type
| Rural County Type | Total Population Size | Population Without Broadband | Median Household Income | Population Percent Without Broadband |
| Nonspecialized | 16,934,712 | 2,641,144 | $43,050 | 16% |
| Farming | 2,767,845 | 582,716 | $46,350 | 21% |
| Mining | 3,193,373 | 654,484 | $48,931 | 20% |
| Manufacturing | 10,341,064 | 1,777,837 | $45,549 | 17% |
| Federal/State government | 6,595,929 | 1,111,361 | $43,805 | 17% |
| Recreation | 6,245,231 | 834,401 | $49,457 | 13% |
The lack of rural Internet access is often framed as an issue affecting U.S. farmlands, but the problem of rural broadband is far broader. While farming counties have the highest proportion of their population without broadband access, in total numbers this group is the smallest among all county types.
Recreational counties are performing the best among rural counties, as these regions have both high incomes and a relatively low percent of the population without access to broadband. This indicates that there might be some connection between income and broadband access. But nonspecialized counties seem to counter this conclusion, since they have lower average incomes but also relatively high access to broadband. Moreover, mining counties have the second-highest household income in the group but lower access to broadband. Perhaps for mining regions the issue isn’t one of income but of cost.
The Economics of Broadband Expansion
Any federal program to expand broadband is based on the fundamental assumption that broadband access—or, more precisely, access to broadband at the 25/3 speed threshold or higher—strengthens a region’s economy. To test this assumption, this study uses a linear regression model, detailed in the Appendix below. As noted above, the 25/3 threshold might not be relevant for many people, but this analysis uses the official line as well as the older 4/1 standard.
In this regression, the percentage of the population with access to 25/3 broadband doesn’t explain the unemployment rate, median household income, the change in employment, or the rate of population change in rural regions. An analysis with the 4/1 standard similarly turns up no connection. This analysis calls into question whether the 25 Mbps download and 3 Mbps upload metric, the older 4 Mbps download and 1 Mbps upload metric, or any availability standard for that matter, provides a reasonable understanding of the underlying economics of rural communities.
Since the FCC provides information on broadband adoption, the adoption index was also tested in the above model, details of which are included in the Appendix. Unfortunately, the index isn’t particularly sensitive, as it breaks every Census tract into five groups by how many fixed high-speed connections exist per 1,000 households. If a Census tract has between 0 and 200 connections for every 1000 households, then it is given a 1, while a 2 is attributed to regions with 200 to 400 connections, and so on to 5. Even with this imprecise measure, adoption explains economic trends four times better than the 25/3 threshold.
These findings confirm previous research. In 2015, three researchers studied the impact of broadband deployment on rural communities for Cornell University’s Community & Regional Development Institute. They found that Internet access correlated with economic growth, but only when people adopted broadband. When they measured broadband availability (i.e. simply having the Internet infrastructure), there was little correlation.
In an earlier piece in 2014, the same authors found that “non-metro counties with high levels of broadband availability (>85%) had growth rates of non-farm proprietors income that were over 5 percentage points lower than comparable counties with lower levels of availability.” On the bottom end, “non-metro counties with low levels of broadband availability (<50%) had growth rates of median household income that were marginally higher than otherwise similar counties.” The authors still conclude that future broadband policies should be more demand-oriented, focusing on broadband adoption instead of simply broadband deployment, and they are not alone in this proclamation.
For people to benefit from the Internet, they need to use it, not merely have access to it. Yet, the trend in policy is toward expanding broadband networks, not promoting their adoption. The best mix of policies will certainly vary depending on local needs, but the key to helping local economies is getting more people connected to the Internet, not merely increasing availability.
Conclusion
Understanding the current availability of broadband Internet is essential for deciding how, or even if, the federal government should act to expand broadband. While about 24 million people lack broadband Internet, this number depends on how broadband is defined, and slower Internet, to which many more people have access, might work well enough for most. Further, the different methods of categorizing the urban-rural divide and rural areas themselves show where the greatest need is—and, just as important, where it is not. As AAF has noted, President Trump’s plan to support rural broadband focuses on micropolitan regions. But micropolitan cores have good access to broadband. Rather, the regions immediately surrounding them are much more likely to have access issues. Further, rural areas whose economies are primarily focused on recreation might need less help than, say, mining-focused areas. If Congress does approve federal efforts to expand broadband access, then these efforts should be directed toward those areas with the greatest need, and might not need to focus on officially broadband-speed Internet.
Perhaps a greater challenge for proponents of expanding broadband access is its correlation with key economic indicators. Broadband access is not correlated with economic growth, although broadband adoption is. This conclusion indicates that the government, if it wants to expand broadband Internet connections, perhaps should not focus on simply expanding broadband networks to areas where it is lacking.
At the least, these conclusions indicate that government policy around broadband is a complex affair. Policymakers should consider a nuanced approach to any broadband-expansion policy that accounts for all facets of the nature of the Internet, the complexities of the U.S. economy, and the demands of consumers.
Appendix
The data on which this project is based, known as Form 477 data, details every broadband service offering in the United States down to the Census Block for residential and business markets and was last updated for December of 2016. For this study, all of the available data for residential markets has been collected and put into a workable SQL database in R. The current population includes 55,584,325 observations across each of the 50 states, the District of Columbia, and Puerto Rico for each Census Block.
Using the Census blocks, county level information from the United States Department of Agriculture’s Atlas of Rural and Small-Town America was joined to the 477 data, which was last updated for 2016 in June 2018. Of importance to this project is the Rural-Urban Continuum Code, a 9-level classification of counties by metro-nonmetro status, location, and urban size. Because this code is determined at the county level and not the Census Block level, the continuum code was mapped onto each of the observations. From here, rural regions, which have a continuum code of either 8 or 9, were analyzed.
Population estimates come from the Federal Communications Commission. FCC staff block estimates can be found here and details about the methodology can be found here.
The models below are both linear in parameters. The variables are detailed below.
- Percent Access to 25/3 Service – Percent of the county with access to 25/3 service weighted by households
- Log Residential Fixed Connections Code – A logged census tract index for broadband adoption (source)
- UnempRate2016 – Unemployment rate for 2016 (source)
- MedHHInc – Median household income for 2016 in 2016 dollars (source)
- PctEmpChange1617 – Percent employment changed for 2016 (source)
- PopChangeRate1617 – The percent population changed for 2016 (source)
- ForeignBornPct – Percent of total population foreign born, 2012-16 (source)
- Ed5CollegePlusPct – Percent of persons with a 4-year college degree or more, adults 25 and over, 2012-16 (source)
- PopDensity2010 – Population density measure from 2010 Census (source)
- OwnHomePct – Percent of owner occupied housing units, 2012-16 (source)
- Type_2015_Farming_NO – A dummy variable for counties defined as primarily a farming based economy (source)
- Type_2015_Manufacturing_NO – A dummy variable for counties defined as a primarily manufacturing based economy (source)
- Type_2015_Mining_NO – A dummy variable for counties defined as primarily a mining based economy (source)
- Type_2015_Government_NO – A dummy variable for counties defined as primarily a government based economy (source)
- Type_2015_Recreation_NO – A dummy variable for counties defined as primarily a government based economy (source)
| Results | |||
| Dependent variable: | |||
| Percent Access to 25/3 Service |
Log Residential Fixed Connections |
Percent Access to 4/1 Service |
|
| UnempRate2016 | 0.001 | 0.009 | 0.000 |
| (0.004) | (0.007) | (0.000) | |
| MedHHInc | 0.00000 | 0.00001*** | 0.000 |
| (0.00000) | (0.00000) | (0.000) | |
| PctEmpChange1617 | 0.0004 | -0.003 | 0.000 |
| (0.002) | (0.004) | (0.000) | |
| PopChangeRate1617 | 0.007 | -0.009 | 0.000** |
| (0.004) | (0.008) | (0.000) | |
| ForeignBornPct | -0.002* | -0.008*** | 0.000 |
| (0.001) | (0.003) | (0.000) | |
| Ed5CollegePlusPct | 0.001 | 0.008*** | -0.000 |
| (0.001) | (0.002) | (0.000) | |
| PopDensity2010 | 0.0003*** | 0.001*** | 0.000 |
| (0.0001) | (0.0001) | (0.000) | |
| OwnHomePct | -0.001 | -0.008*** | 0.000 |
| (0.001) | (0.002) | (0.000) | |
| Type_2015_Farming_NO | -0.069*** | -0.179*** | 0.000 |
| (0.018) | (0.033) | (0.000) | |
| Type_2015_Manufacturing_NO | 0.013 | 0.020 | 0.000* |
| (0.018) | (0.032) | (0.000) | |
| Type_2015_Mining_NO | -0.065*** | -0.133*** | 0.000 |
| (0.023) | (0.041) | (0.000) | |
| Type_2015_Government_NO | -0.053*** | -0.057 | 0.000 |
| (0.020) | (0.037) | (0.000) | |
| Type_2015_Recreation_NO | -0.012 | 0.149*** | -0.000 |
| (0.022) | (0.041) | (0.000) | |
| Constant | 0.857*** | 0.436*** | 1.000*** |
| (0.082) | (0.154) | (0.000) | |
| Observations | 1,974 | 1,780 | 1,974 |
| R2 | 0.045 | 0.165 | 0.500 |
| Adjusted R2 | 0.039 | 0.158 | 0.497 |
| Residual Std. Error | 0.257 (df = 1960) | 0.440 (df = 1766) | 0.000 (df = 1960) |
| F Statistic | 7.100*** (df = 13; 1960) | 26.758*** (df = 13; 1766) | 150.768*** (df = 13; 1960) |
| Note: | *p<0.1; **p<0.05; ***p<0.01 | ||