Research
April 28, 2022
After the American Rescue Plan’s Enhanced Premium Tax Credits End
Executive Summary
- The American Rescue Plan Act (ARPA) increased the generosity of the Affordable Care Act’s (ACA) premium tax credits (PTCs) and lifted the income cap on eligibility for 2021 and 2022 in response to the COVID-19 pandemic.
- When the ACA’s standard PTC policies return to effect in 2023, most subsidized enrollees (12.9 million individuals in 2022) will see their share of their premium increase, although the amount of the increases will vary.
- About 4.8 million enrollees below 150 percent of the federal poverty level (FPL) pay no premiums in 2022 under the ARPA. In 2023, those with income at 100 percent of FPL ($12,880 for an individual) will contribute $22 per month toward their premium, while those at 150 percent of FPL ($19,320 for an individual) will pay $67 per month.
- The roughly 4.7 million enrollees with income between 151–250 percent of FPL will see the largest percent increases from 2022 to 2023, with those at 200 percent of FPL ($25,760 for an individual) seeing a 226 percent increase, or about $97 a month.
- Those making 300 percent of FPL ($38,640 for an individual) will see the largest dollar increase in monthly premium contributions among those who will remain PTC eligible in 2023 at $123.
- Of those above 400 percent of FPL (above $51,520 for an individual) who will no longer be eligible for PTCs after 2022, the impact will vary dramatically by age, with younger individuals seeing virtually no difference in cost, while those age 64 will have the most significant increases.
- These changes in premium contribution represent a return to the pre-pandemic levels established by the ACA and in effect prior to the passage of the ARPA in 2021.
Background
Enacted March 11, 2021, the American Rescue Plan Act (ARPA) made several temporary changes to the Affordable Care Act’s (ACA) premium tax credits (PTCs), ostensibly in response to the economic and public health impacts of the COVID-19 pandemic. Of particular significance were changes to the generosity of the PTCs and eligibility for them. First, the ARPA significantly increased the generosity of the PTCs by reducing the maximum share of adjusted gross income that individuals and households are required to contribute toward their individual market insurance premium. Second, the ARPA removed the income limitations on who can receive PTCs. Under the ACA, individuals and households with incomes above 400 percent of the federal poverty level (FPL) are ineligible for PTCs. Under the ARPA, however, they were eligible for PTCs in 2021, and are in 2022, if their individual market premium exceeds 8.5 percent of their income. Additionally, the ARPA extended PTC eligibility to anyone who received unemployment compensation in 2021, regardless of household income, and considered their household income no greater than 133 percent of FPL for their family size. The ARPA’s temporary changes to the ACA’s PTC structure are shown in Table 1.
Table 1. Percent of Income Limits for Benchmark Coverage (with and without enhanced PTCs)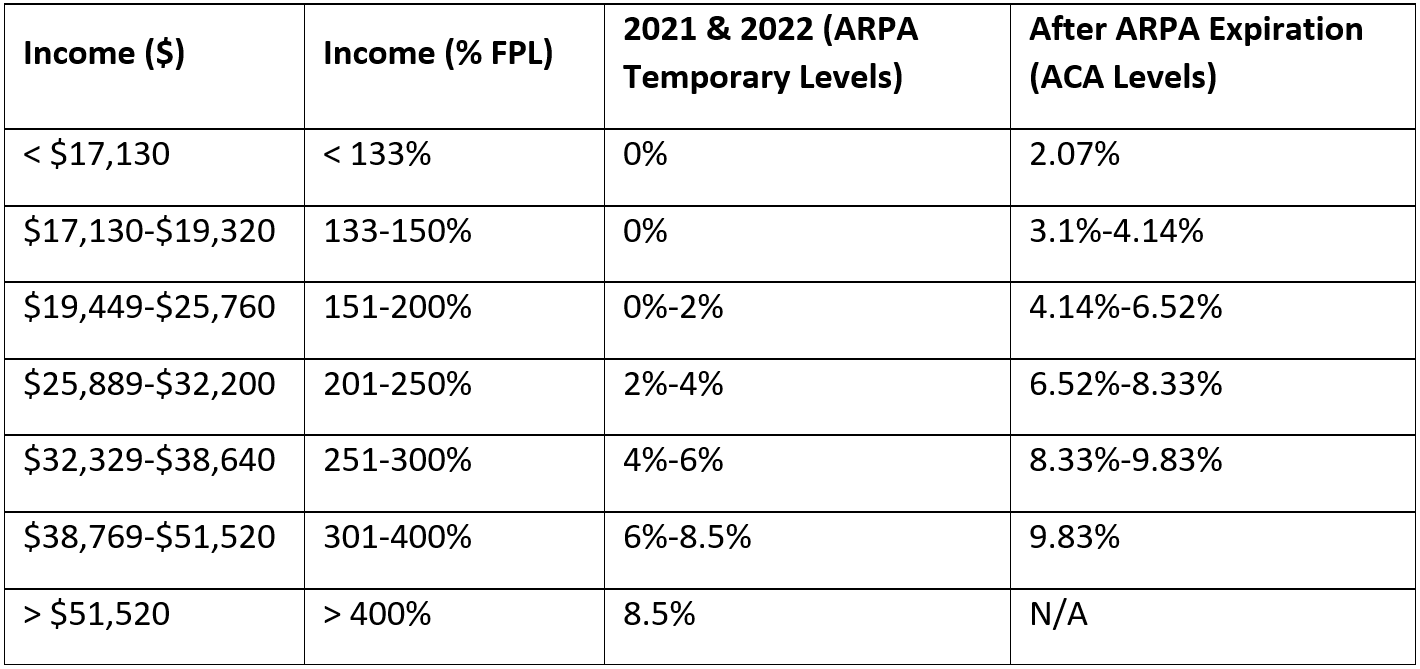
Note: Income ($) is shown for an individual.
2022 Enrollment by Income
During the 2022 open enrollment period, 14.5 million individuals selected individual market coverage under the ACA. As seen below in Chart 1, a little over one-third of these individuals had incomes less than 150 percent of FPL, roughly one-third had incomes between 151–250 percent of FPL, and a little below one-third had incomes above 250 percent of FPL. The Centers for Medicare and Medicaid Services notes that the roughly 900,000 in the “other” category were those not requesting financial assistance or those with unknown household incomes.
Chart 1. 2022 ACA Enrollment by Income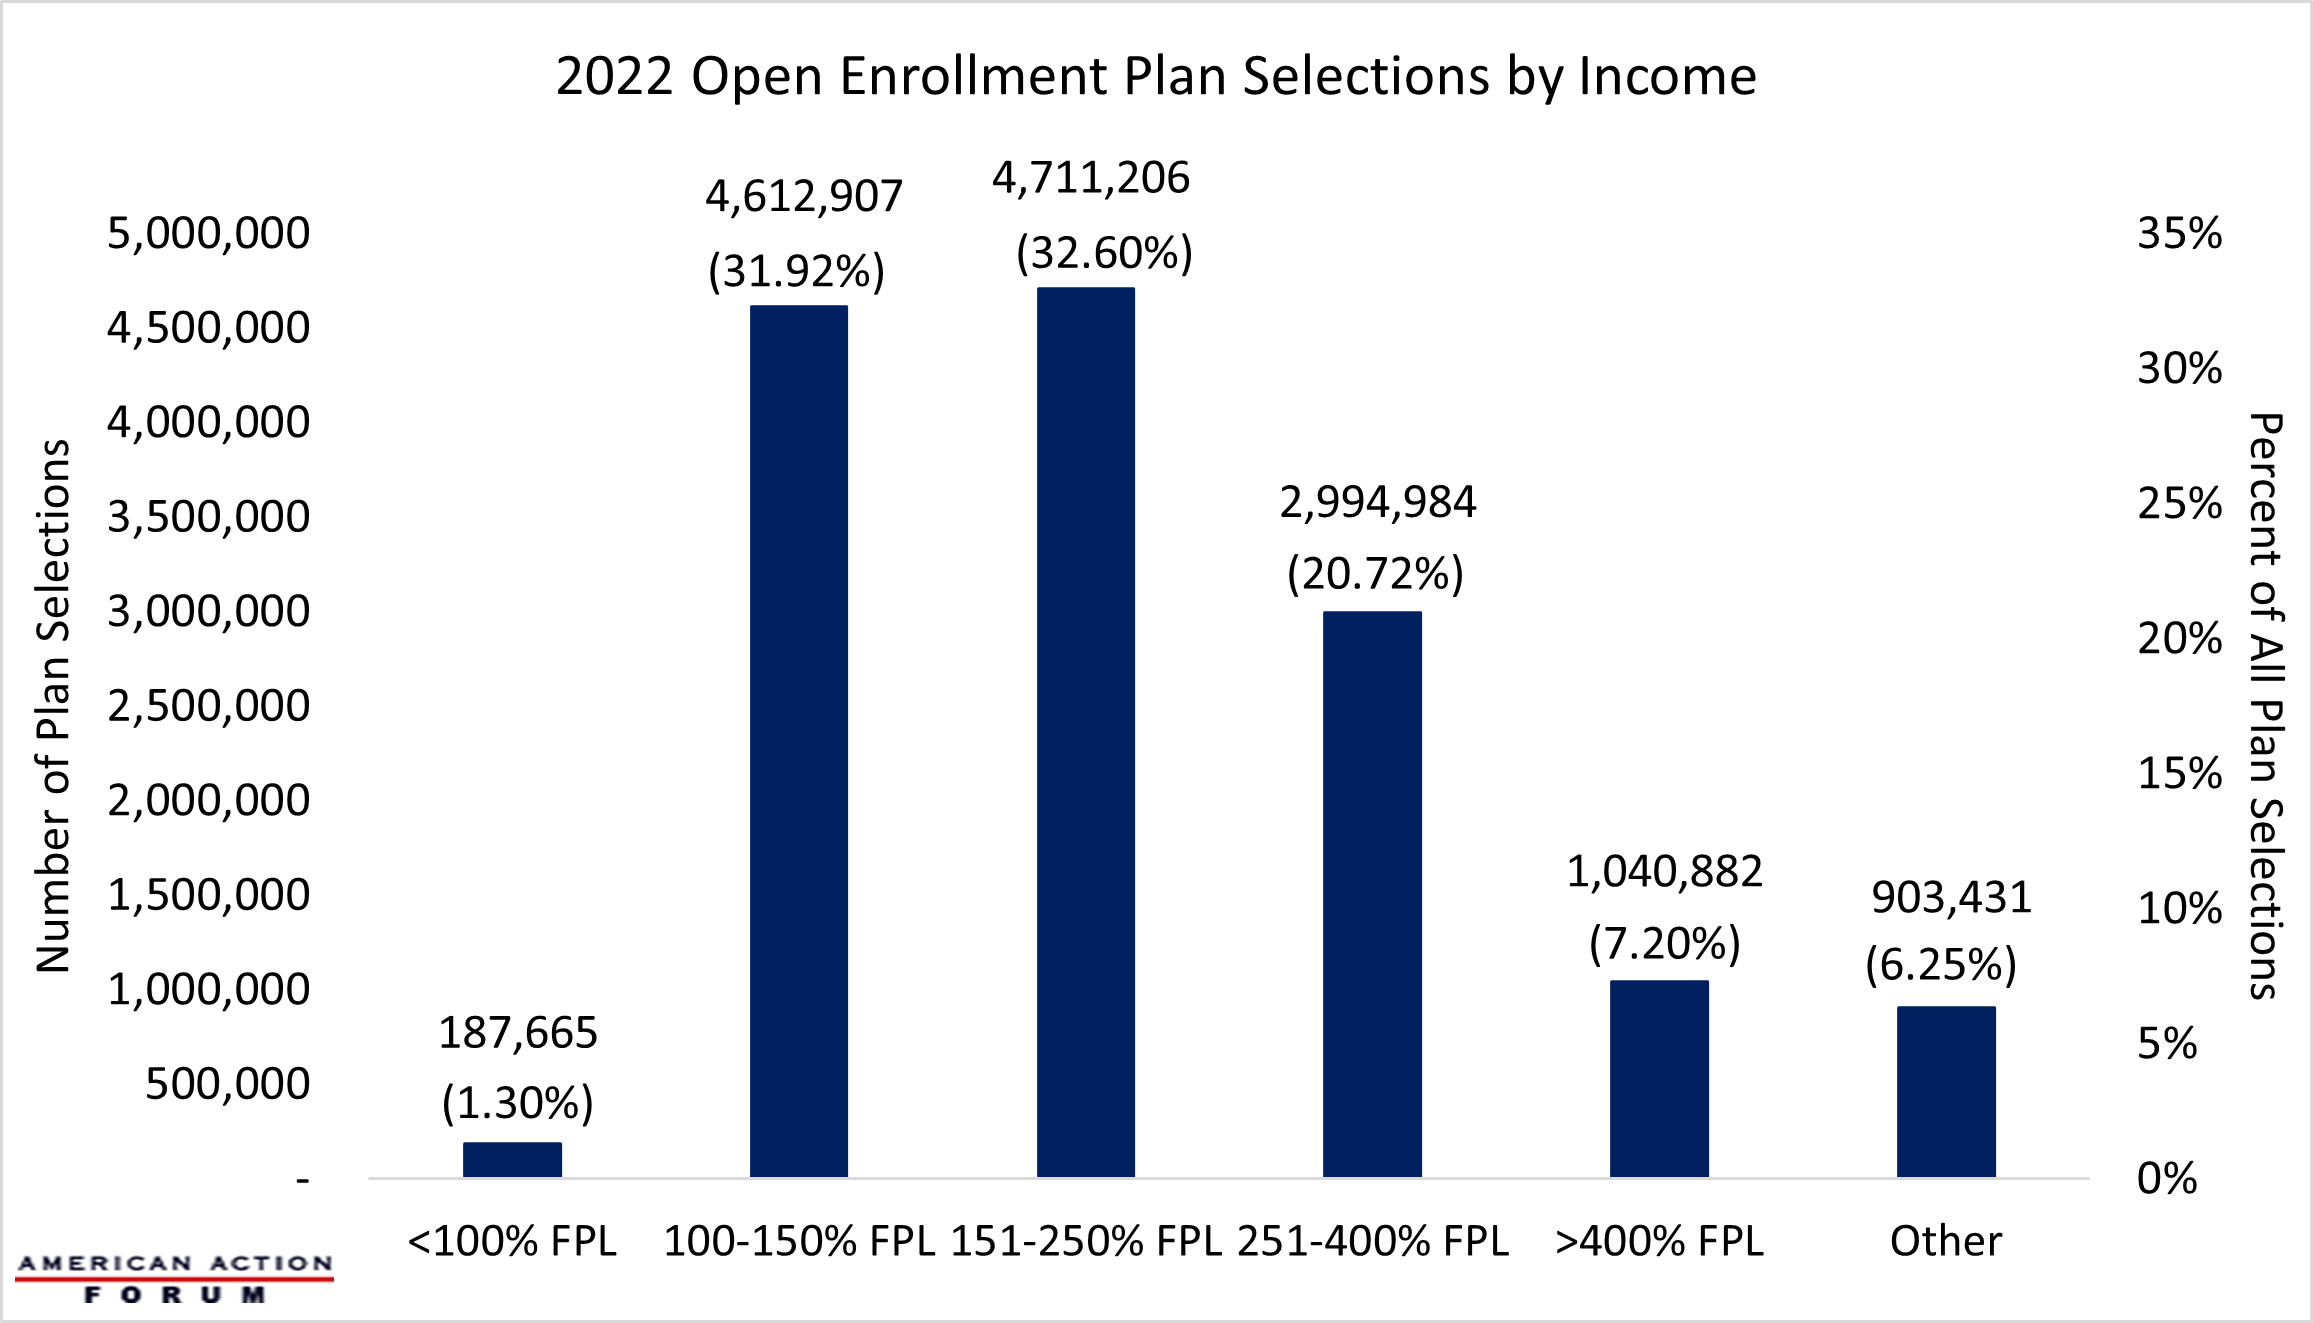
After the American Rescue Plan Act
While the policies enacted as part of the ARPA were framed as a response to the COVID-19 pandemic, the changes to the ACA’s PTCs were consistent with President Biden’s broader objectives to expand the ACA. Yet because of budgetary constraints inherent in the reconciliation process—which was used to avoid a Senate filibuster—the PTC changes were ultimately made on a temporary basis for plan years 2021 and 2022. Congressional Democrats and the Biden Administration first sought to make these changes permanent as part of early drafts of the Build Back Better Act (BBBA), and later tried to extend them through 2025 as part the House-passed version of the BBBA. As the BBBA ultimately failed to advance in the Senate, PTC generosity and eligibility will reset to the levels originally established by the ACA beginning in the 2023 plan year. This return to pre-pandemic policy has led to increasing clamor from some corners about the premium increases facing individuals and households currently enrolled in individual market insurance coverage under the ACA.
In 2022, 89 percent of all ACA Marketplace enrollees were eligible for PTCs, and therefore roughly 12.9 million people who enrolled ACA coverage in 2022 will likely see some measure of increase in their share of their premium in 2023. For example, using data from the Kaiser Family Foundation Health Insurance Marketplace Calculator, Chart 2 shows the difference in the average annual premium contribution for a 27-year-old individual when applying both the standard ACA PTC policies and the current enhanced ARPA PTCs to the average 2022 benchmark Silver plan.
Chart 2. Changes in Average Annual Premium Contribution for 27-year-old Individual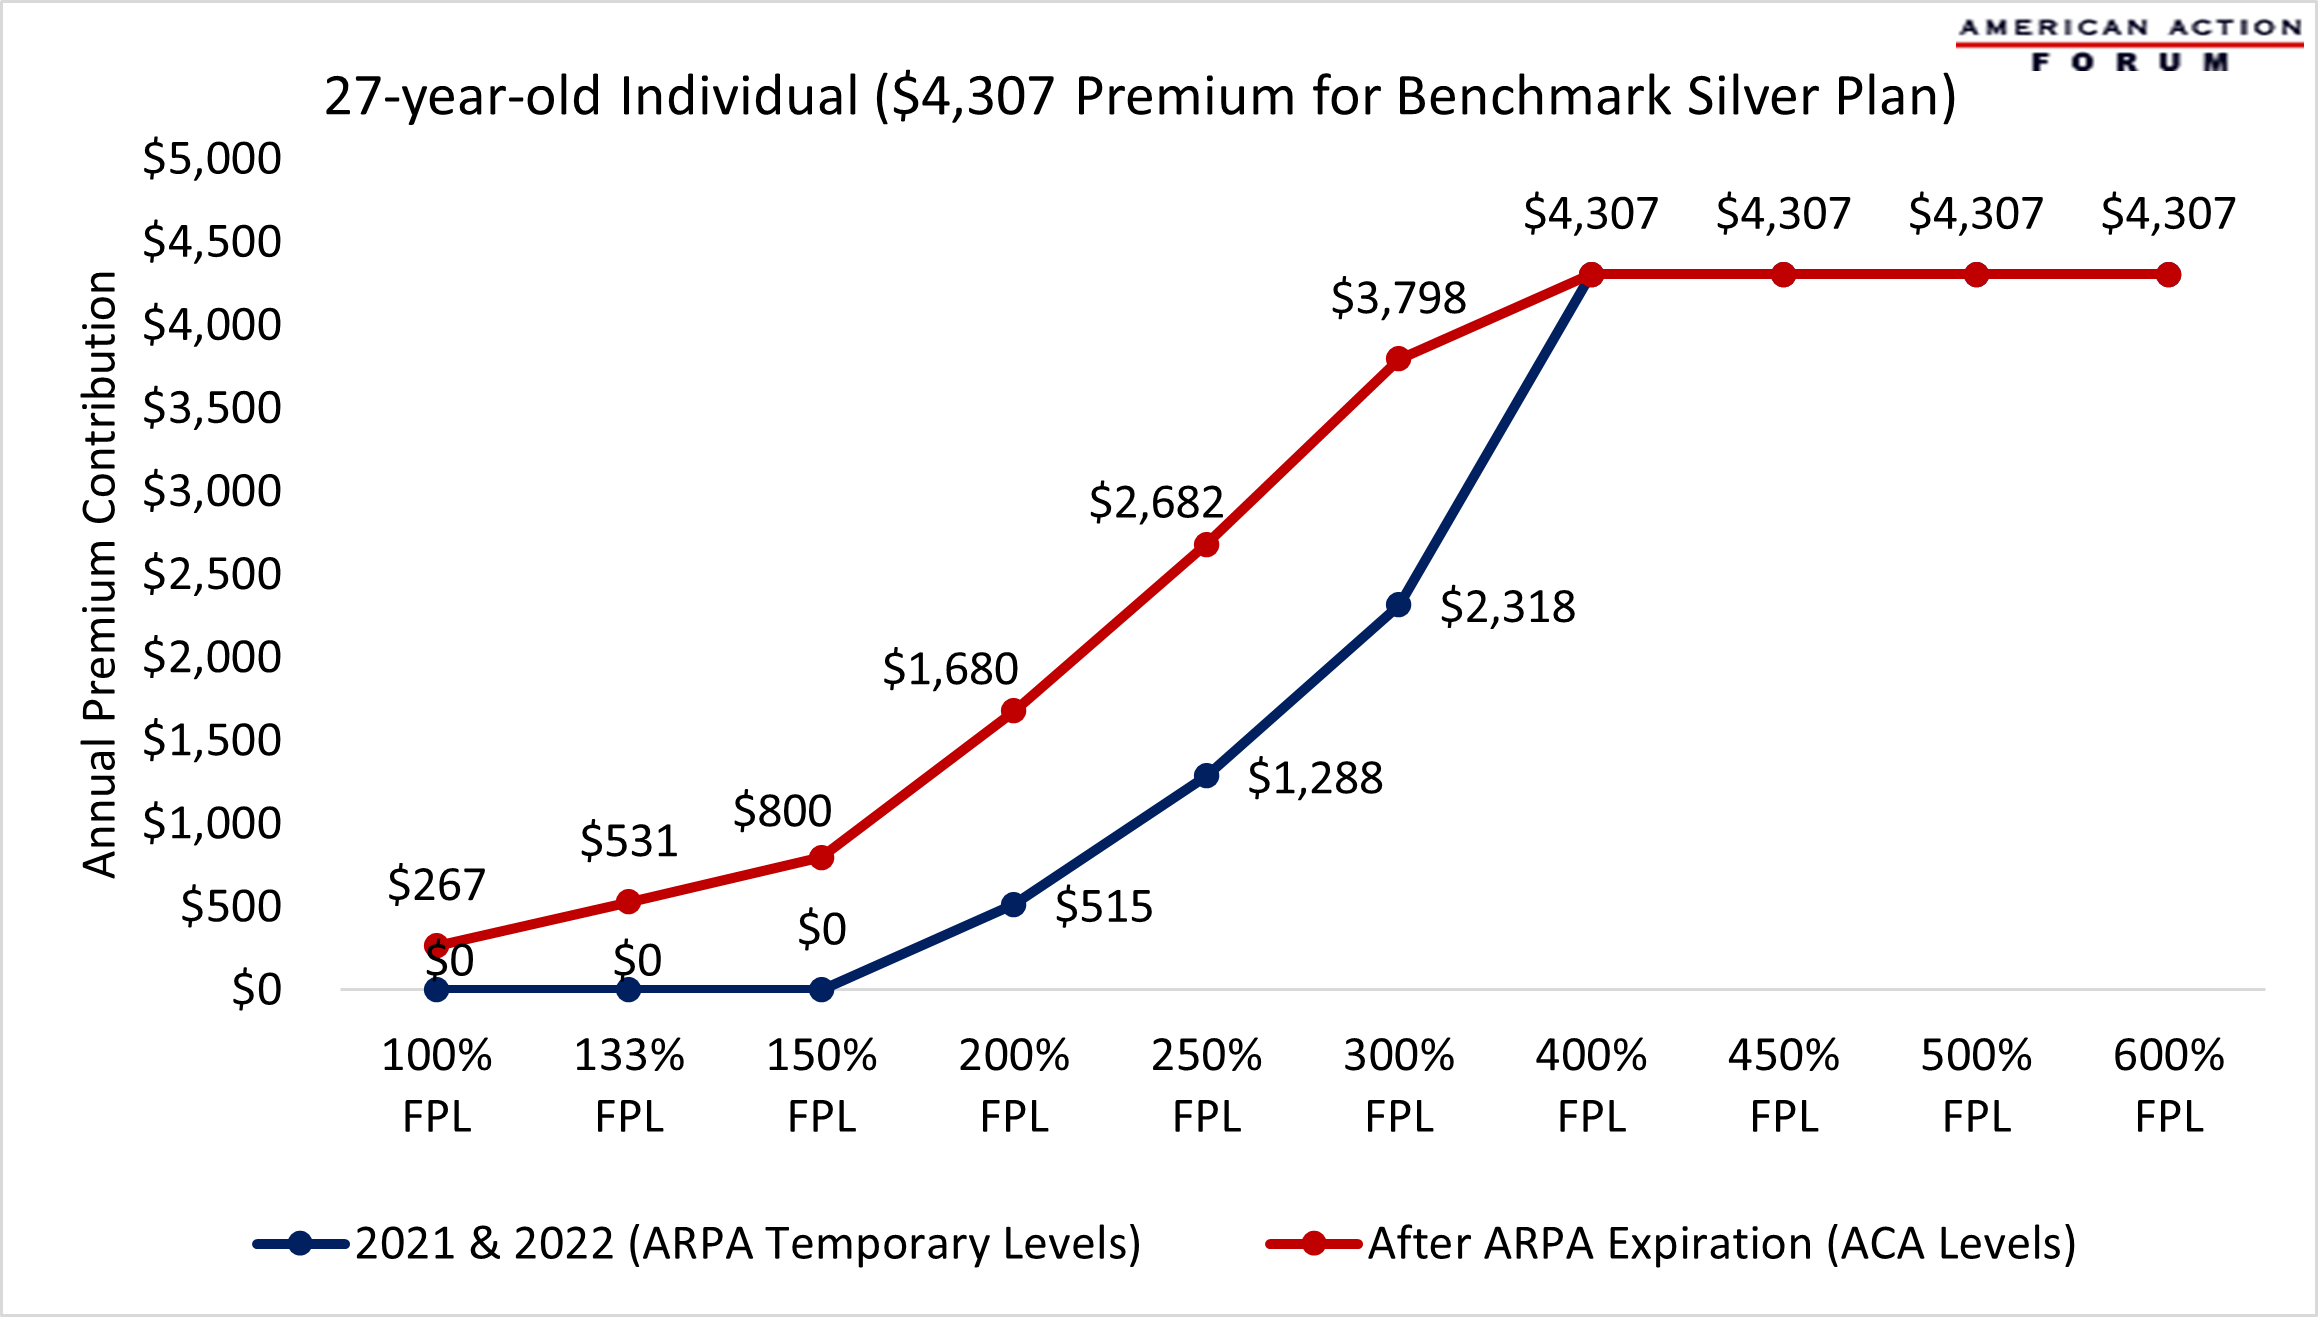
When looking at all ACA enrollees, the 4.8 million individuals with incomes at or below 150 percent of FPL will face the steepest increases in 2023, relative to 2022 contributions, given that they do not pay any premium whatsoever under the ARPA. If the standard ACA PTC policies were applied to these individuals in 2022, without the ARPA-enhanced PTCs, those with income at 100 percent of FPL would be responsible for annual premium contributions of $267, or about $22 a month, while those at 150 percent of FPL would see annual premium contributions of $800 or $67 per month.
The next group worth considering is the third of those who selected plans under the ACA for 2022 with incomes between 151–250 percent of FPL—roughly 4.7 million individuals. As shown in Chart 3 below, under the ACA’s PTC policies, those at 200 percent of FPL would see their annual premium contribution increase 226 percent compared to the ARPA’s enhanced subsidies, while those at 250 percent of FPL would face premiums more than twice their current contribution under the ARPA’s enhanced PTCs, regardless of age. In terms of dollars, these individuals’ annual premium contributions could increase between $1,165 and $1,394 (or about $97–$116 per month).
Almost 3 million individuals with incomes between 251–400 percent of FPL enrolled in individual market coverage for 2022. As shown in Chart 3, individuals with incomes at 300 percent of FPL would see their premium contribution increase 64 percent under the standard ACA PTC policies versus the ARPA’s enhanced PTCs. This amounts to $1,480 annually or $123 per month.
Chart 3. Percent Changes in Average Annual Premium Contribution by Income and Age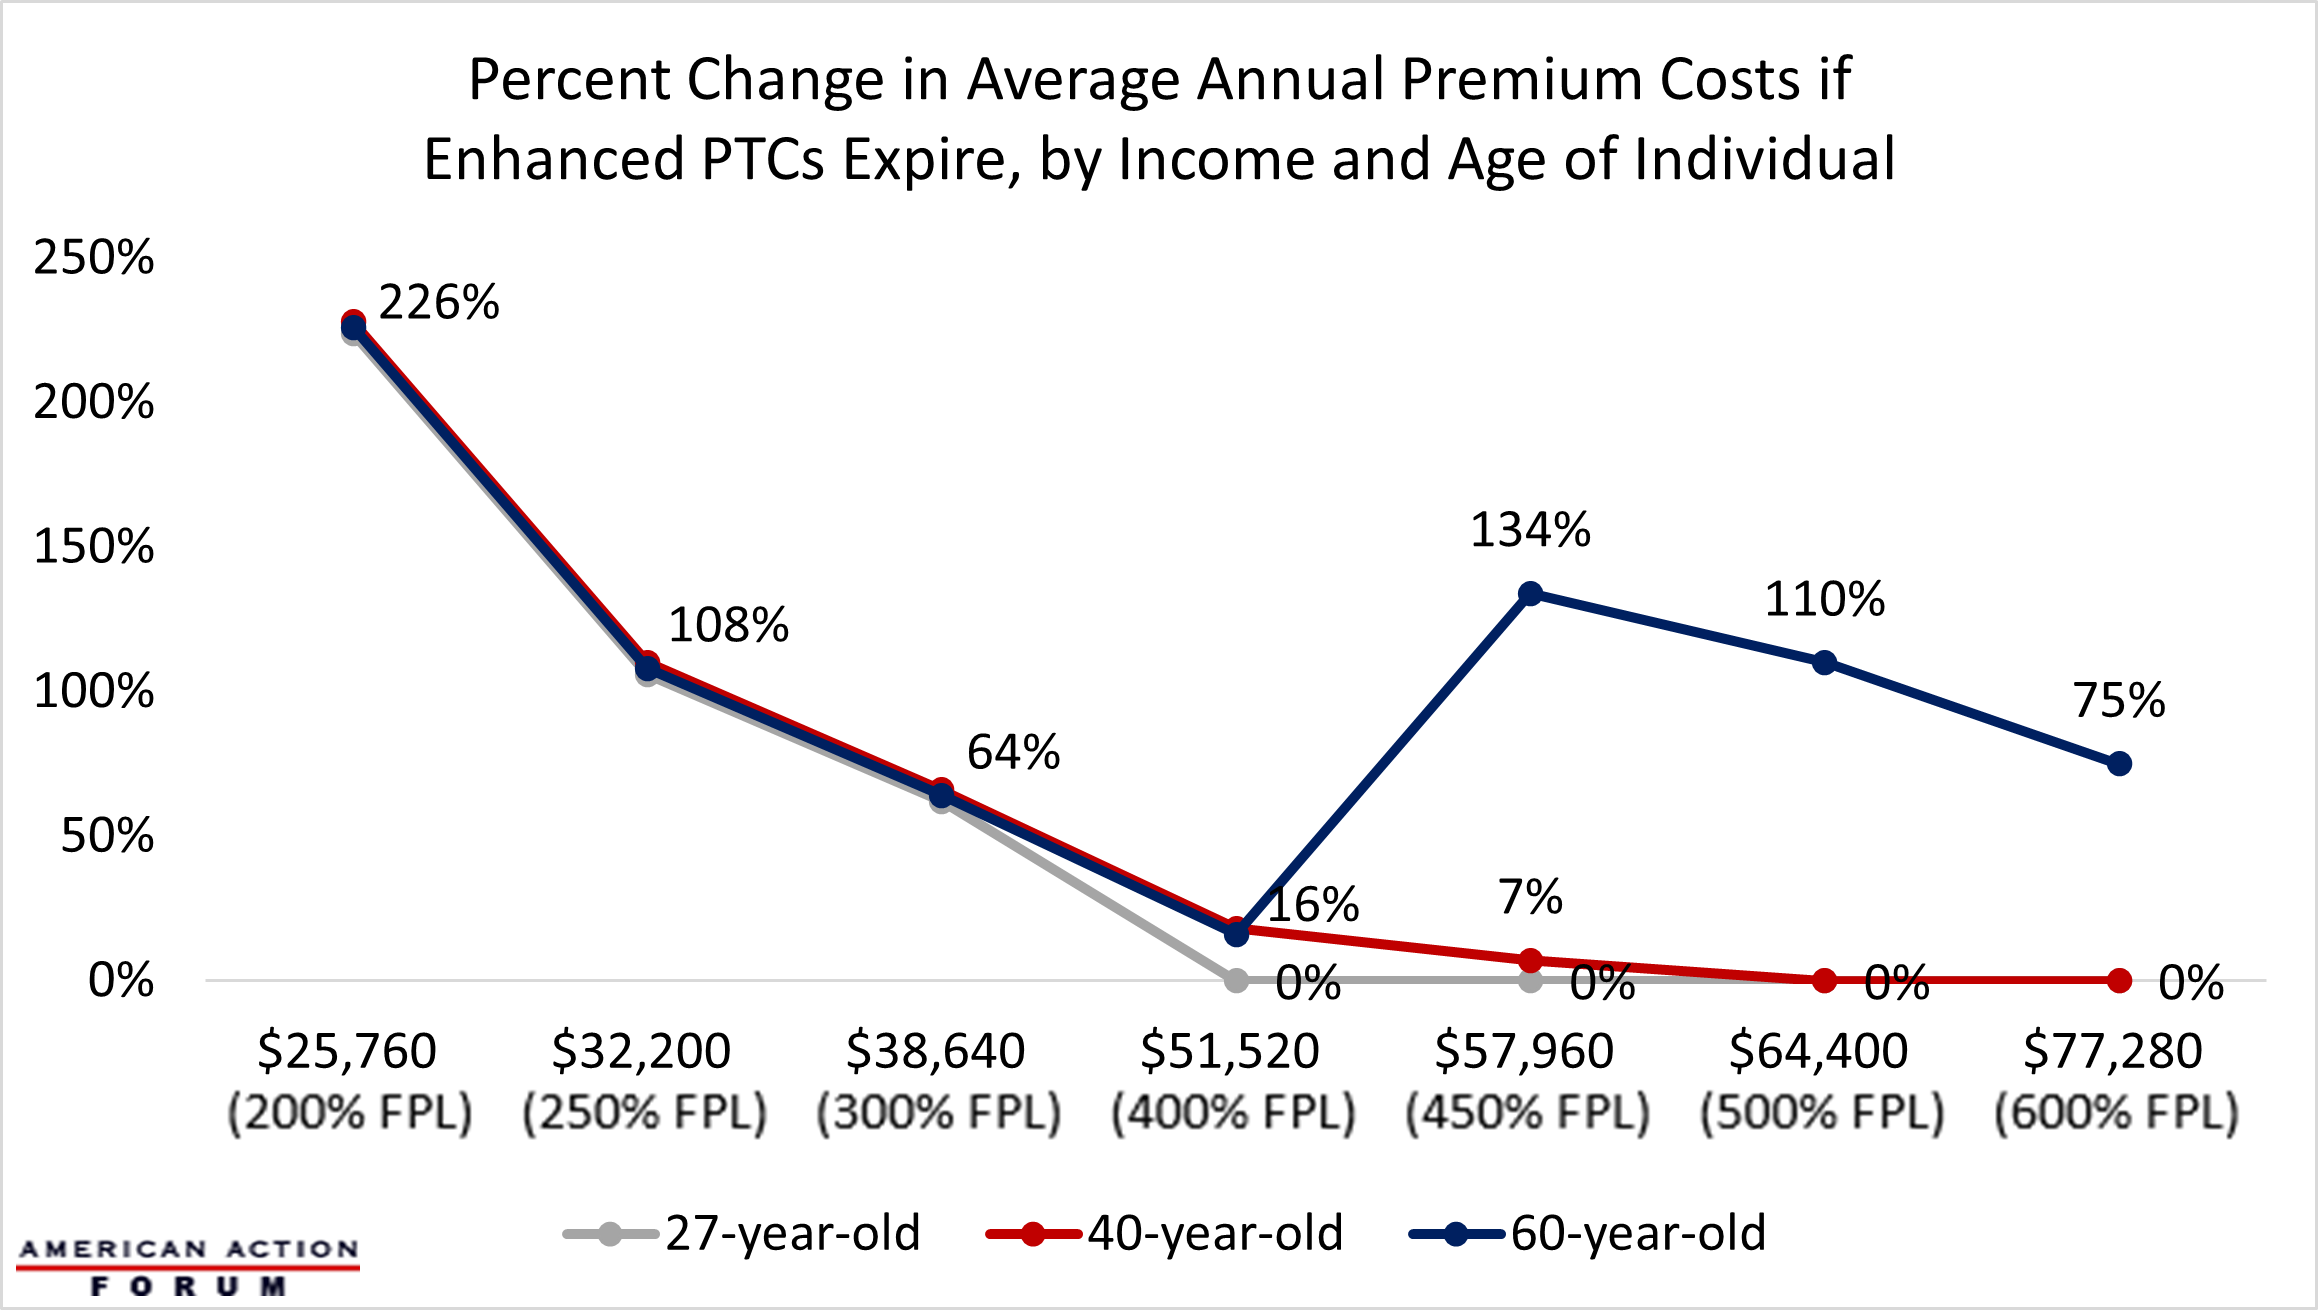
For individuals with incomes at or above 400 percent of FPL, the differences in premium contributions between the ACA and ARPA’s enhanced PTCs vary greatly by age, as shown in Chart 3 above, while there are no age-based differences for individuals with lower incomes. This is due to the 3-to-1 age band established by the ACA, which allows health insurers to adjust premiums based on age (a proxy for health status), but limits them from charging the oldest plan participant more than three times the rate of the youngest plan participant. For example, a 27-year-old with an income of 400 percent of FPL sees no difference between the standard ACA PTCs and the enhanced ARPA PTCs because their total premium does not exceed the maximum percent of income under either scenario, while a 60-year-old with income of 400 percent of FPL would see a 16 percent increase under the standard ACA PTCs, versus the ARPA policies (equivalent to $685 annually or about $57 a month).
For those with incomes above 400 percent of FPL, the ARPA caps enrollees’ contributions at 8.5 percent of their income, while under the standard ACA policies these individuals are ineligible for subsidies. As demonstrated in Chart 4 below, the overall impact on enrollees’ contributions varies dramatically by age. While a 35-year-old at 450 percent of FPL will see their annual premium contribution increase by only $95, or less than $8 per month, a 64-year-old at the same income level would face a $7,402 increase in their annual premium contribution, or roughly $616 per month, after losing ARPA eligibility for PTCs.
Chart 4. Changes in Annual Premium Contributions for 35 and 64-year-olds at or above 300 Percent FPL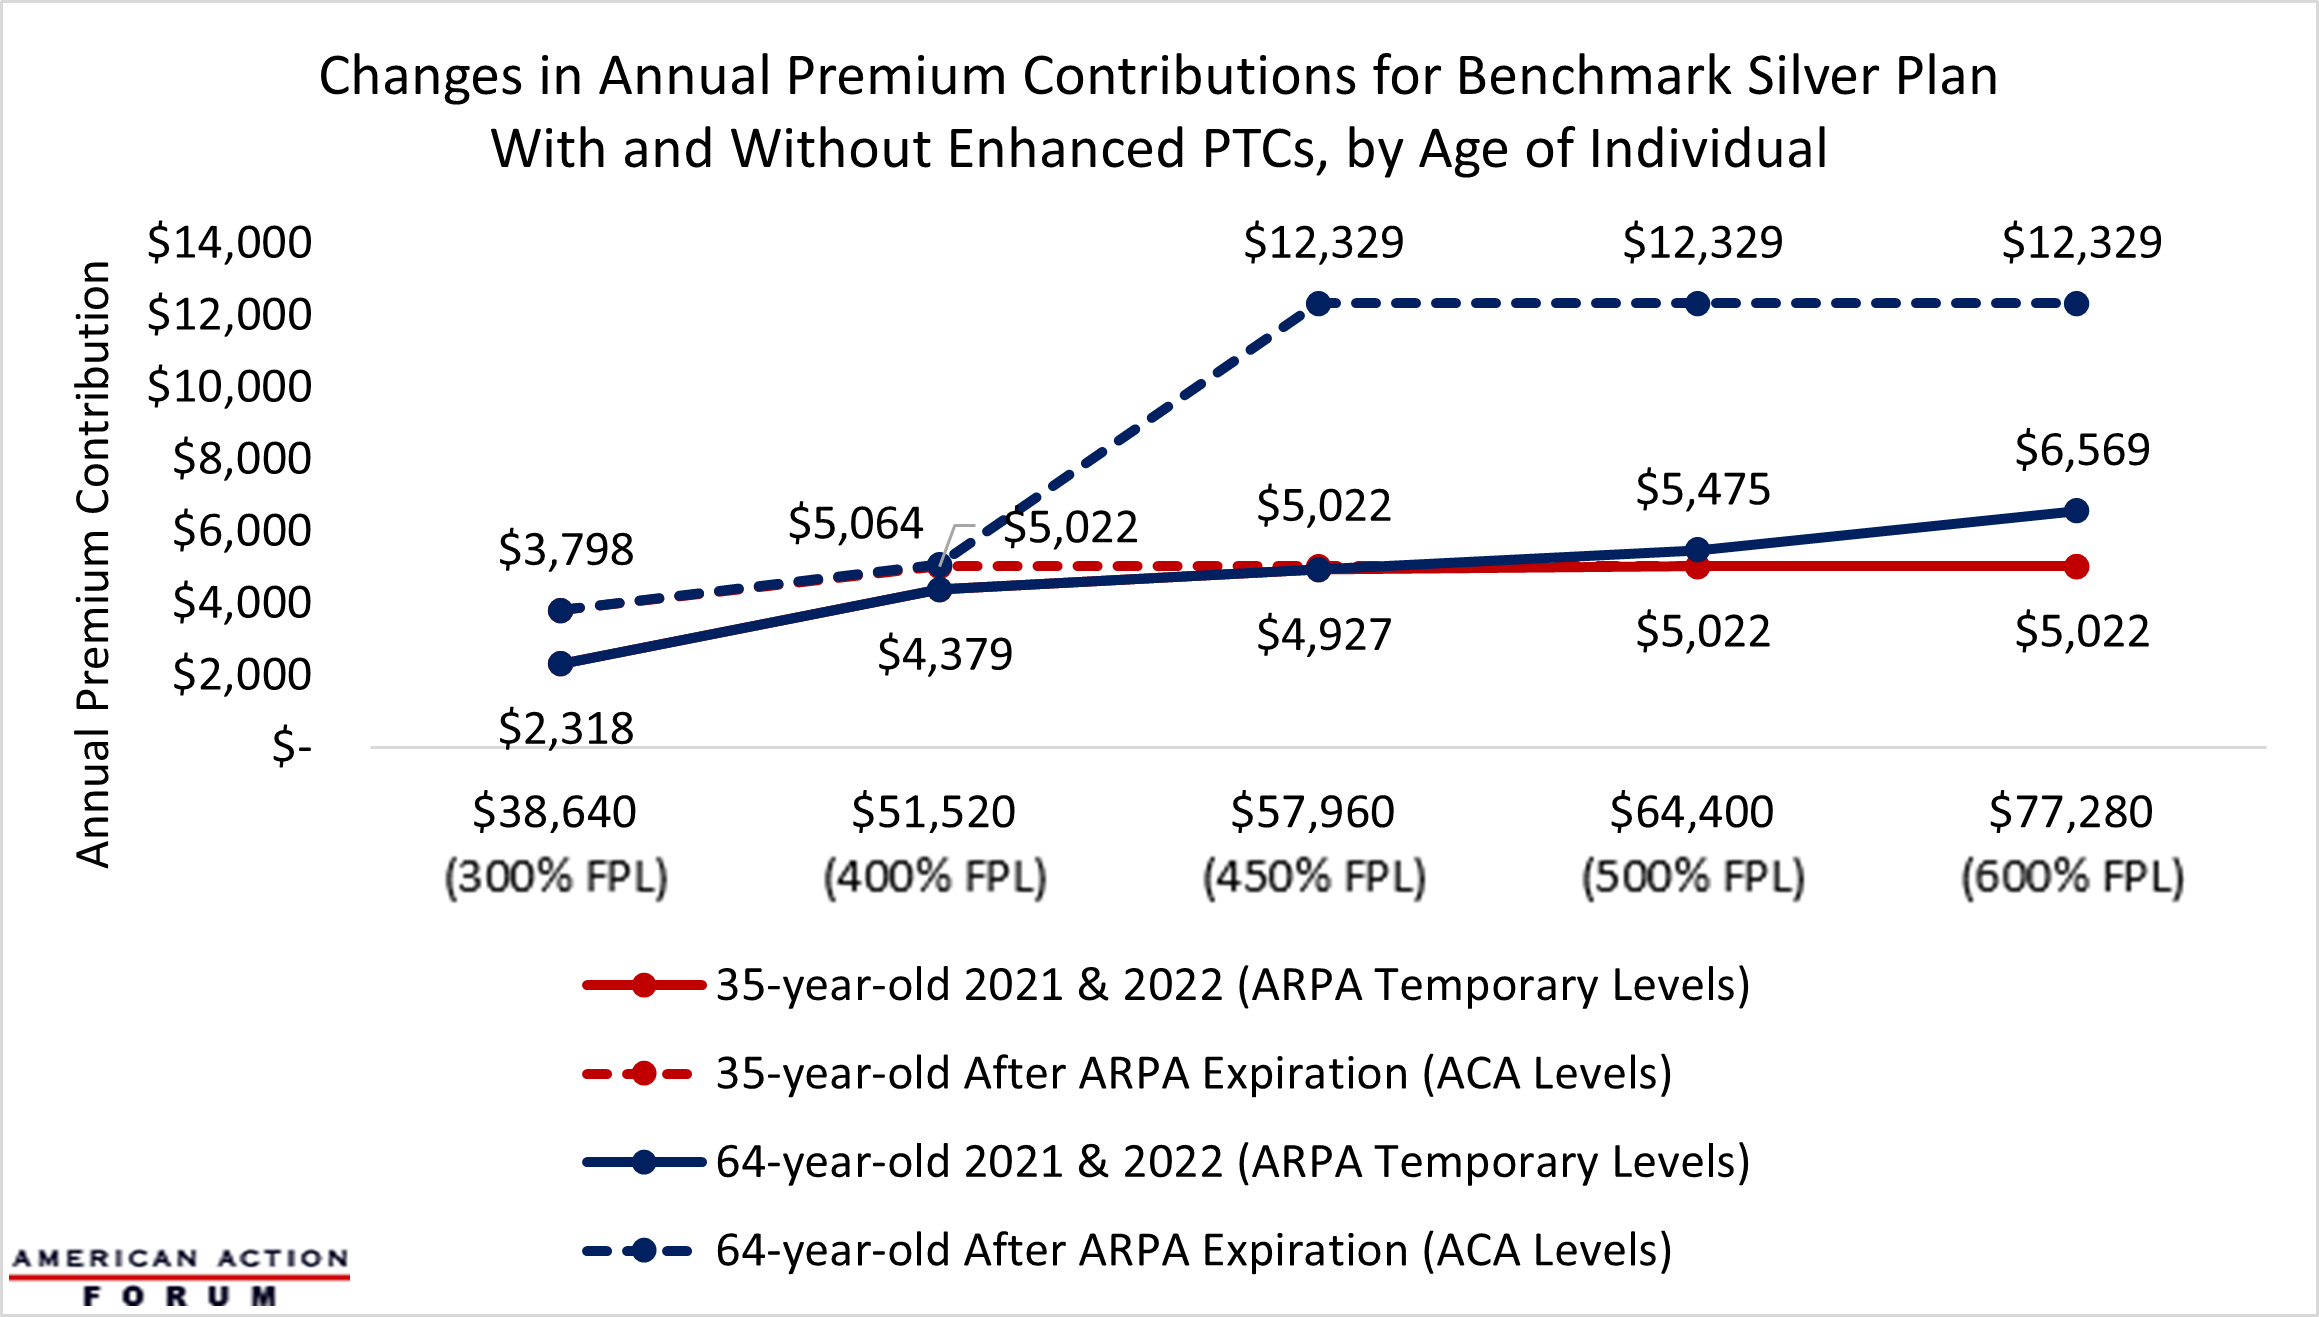
A Note About the Risk Pool
The preceding numbers are derived from applying the PTC policies that will be in effect in 2023 under current law to 2022 premiums, so as to provide a sense of the likely impact of the expiration of the ARPA’s enhanced PTCs. In reality, premiums will be different in 2023 due to several factors. One factor that impacts premiums from year to year is assumptions that insurers make about the risk pool, or the health status of enrollees. It is unclear how the ARPA’s enhanced PTCs have impacted the risk pool, and thereby premiums, in 2021 and 2022. It is conceivable and even likely that lower premium contribution requirements and the expansion of subsidies to higher incomes attracted enrollment among the so-called “young invincibles”—those younger Americans with minimal health care spending who are more likely to forgo insurance coverage because of premium cost—and healthy high-income earners who similarly did not previously find the purchase of individual market coverage to be worth the premium. An influx of these populations could have exerted downward pressure on premiums, thus the reversion to the standard ACA PTCs could drive these individuals from the marketplace and lead to additional premium increases, further expanding increases in premium contribution facing individual market enrollees under the ACA in 2023.
Conclusion
Roughly 12.9 million of the 14.5 million individuals who selected health insurance coverage through the ACA for the 2022 plan year are eligible to receive subsidies. Because of the ARPA’s enhanced PTCs, the vast majority of these subsidized enrollees are paying a smaller share of their premiums than they otherwise would have under the ACA. Assuming 2022 premiums, the vast majority of subsidized enrollees with incomes at or below 400 percent of FPL will see their share of their premium increase in 2023 between a few dollars to $123 per month in 2023. Those above 400 percent FPL will lose subsidy eligibility entirely, although the impact of this reversion to the original ACA subsidies will vary significantly by age.
While subsidized ACA Marketplace enrollees will see their share of the premium increase in 2023, it is important to remember that the ARPA’s enhanced and expanded PTCs were temporary measures in response to the COVID-19 public health emergency. Allowing the enhanced and expanded PTCs to lapse as stipulated in statute will simply represent a return to the subsidy levels that were established by ACA, and which were in effect prior to 2021.