Research
September 29, 2020
Assessing Calls to Defund the Police: Police Budgets and Employment Levels
Executive Summary
- Recent calls for police reform have included campaigns to “defund the police”—either through outright elimination of the police force or, more moderately, through diverting some funding to other programs—in order to reduce the number of interactions that individuals have with police and thus the risk of police abuse.
- Given that 97 percent of police budgets is spent on salaries, pensions, and benefits, any decrease in police funding will necessarily result in a decrease in the number of officers employed.
- The wide variation between cities in funding and staffing levels indicates that it is difficult to tell if cities’ police forces are staffed at appropriate levels, although any universal cut is certain to leave some cities understaffed and would likely reduce the diversity of some cities’ police forces.
- While spending on police forces has grown over the last 30 years, it has grown in line with spending on other potential priorities such as health care and education, and overall spending on health care and education is already far greater than spending on police.
- Cities are increasingly dependent on federal funding for their police, a fact that gives federal policymakers the option of conditioning federal funding on certain reforms.
Introduction
Many across the country—primarily Black Americans—have stated that police do not make them feel safer, but rather the opposite; they fear those who are supposed to protect them.[1] This distrust is nothing new.[2] Given their experiences and the tragedies they have witnessed, numerous groups have called for police reform in recent months, including calls to “defund the police.”
Abolishing the police or, at the very least, reducing police presence and power by cutting their finances is the best way to end police brutality and abusive practices, the argument goes. While some advocates do support completely defunding and abolishing police forces, other activists are seeking to reduce funding to police departments and to repurpose those funds to other programs and means of assistance, a campaign known as “divest and reinvest.” In many instances, police departments have become responsible for dealing with issues outside of traditional policing functions, advocates of this position note, and reducing the number of responsibilities that police officers have reduces an individual’s likelihood of interacting with police and, thus, of being a victim of police abuse. Finally, advocates argue that greater investment in community needs, including education, health care, economic development, and youth activities, will reduce crime and the need for police in the first place.
The common denominator of these positions is a desire to cut police funding, and in order to assess the feasibility of these proposals, it is necessary first to understand how police forces are funded and, by extension, how much money is available to divert to other resources. What proportion of police budgets go toward personnel? How many officers are employed in U.S. cities and towns? Are departments overstaffed? The answers to these questions will indicate how feasible “divest and reinvest” proposals are.
Police Spending
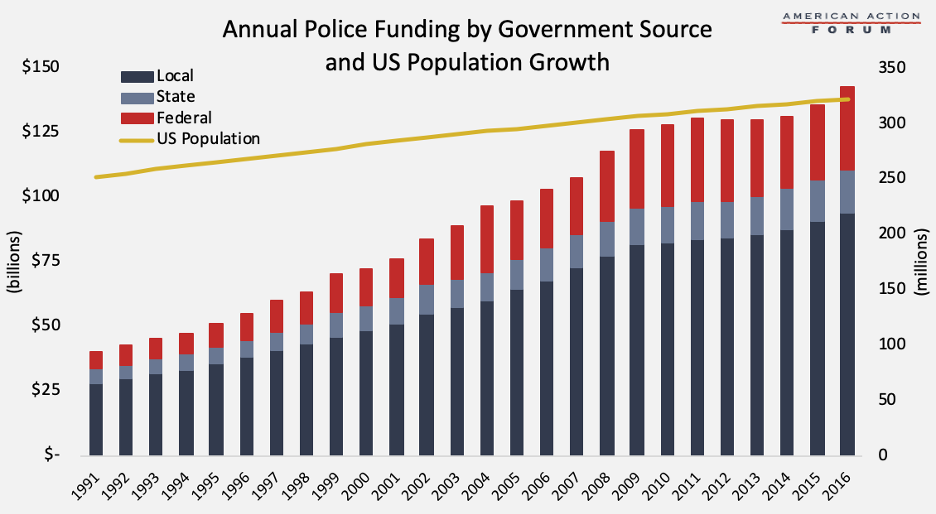
To understand how much police spending should perhaps be reduced, it is important to understand current funding levels. As shown in previous American Action Forum research, nearly $300 billion is spent annually on our criminal justice system, with roughly half ($142 billion) specifically spent on policing. Most police funding comes from local governments, though the federal government does provide nearly a quarter of police funding, primarily through COPS grants and Byrne grants. As shown in the chart below, overall police funding has grown 254 percent from 1991 to 2019, while the U.S. population grew just 30.5 percent during that time.[3] Further, although most police spending continues to be derived from state and local funds, federal police funding has grown at a faster rate, leading federal funding of police to grow from 17 percent of funding in 1991 to 22 percent in 2016. This rising share increases the potential effectiveness of proposals to condition federal funds on police departments’ adoption of certain reforms—an option that nevertheless still has limitations.
Nationally, police spending represents, on average, 4-6 percent of state and local budgets.[4] But averages mask significant differences. Local police budgets vary greatly in size, somewhat a reflection of variation in the size of the population, historical crime rates, and the severity of potential threats. Other factors leading to variation include historical trends, as well as how other responsibilities of the city are funded (i.e., how much state and/or county funding is also provided for police or education or other services), which may provide more or less room in the budget for spending on police. The examples below provide illustrations of the impact of these myriad factors.
The largest police force in the country—the New York Police Department—has a budget of $10.9 billion in 2020: $5.6 billion in operating expenses, 88 percent of which covers salaries, plus $5.3 billion in central expenses, which primarily cover the cost of benefits and pensions.[5] Given the city’s historical and continued terrorist threat, 5 percent of the budget ($315 million) is allocated to intelligence and counterterrorism, an allocation for which most localities likely have no need.[6] The total police budget represents 11 percent of the city’s overall budget and is the second largest expenditure behind the city’s Department of Education, which has a budget of $24.1 billion in 2020.[7] (The New York City Council recently approved a nearly $1 billion cut to the police department’s operating budget.[8])
Looking at other major cities, roughly 20 percent ($1.8 billion) of Chicago’s budget is spent on police in 2020, nearly $1.6 billion of which covers personnel services.[9] The city of Los Angeles spends a similar amount on its police force ($1.9 billion, accounting for 18 percent of the city’s expenditures), but—unlike Chicago—the city also receives roughly an equal share of funding from the county for policing, bringing the total funding for the Los Angeles Police Department to nearly $4 billion.[10]
Oakland, CA has a police budget that is comparatively small in nominal terms (less than a quarter million dollars) but represents more than 40 percent of the city’s general fund expenditures—the highest percentage in the country.[11] Baltimore, the 29th largest city in the country and known for high crime rates, spends the most per capita among U.S. cities on its police force—$904.[12] In 2020, the city’s police budget was $536 million, representing 18 percent of its $2.9 billion city-wide budget.[13] Despite being the 46th largest city, Minneapolis has the 7th highest police expenditure per capita in the United States; nevertheless, at $186.5 million in 2020, the police budget was only 10 percent of the city’s expenditures.[14], [15]
As these cities demonstrate, despite funding for police more than tripling over the last three decades, policing still does not constitute an overwhelming portion of cities’ budgets. Further, the variation indicates that while there could be bloating and opportunities for cuts in some cities, it is impossible to draw any universal conclusions. The growth in the federal share of police funding provides an opportunity for federal policymakers to condition funding on certain reforms, but would-be reformers must keep this diversity firmly in view.
Police Funding in Relation to Funding for Other Public Services
Advocates for defunding the police argue that law enforcement consumes too large a share of the budget, hindering opportunities to fund other programs and services. But as detailed above and shown in the graph below—which charts government spending on various public services over the past three decades from a national perspective—police funding, while quite variable, is typically a relatively small share of overall spending.[16] While spending on policing has grown more than 250 percent during that period, spending on health care for low-income individuals via Medicaid has grown the most rapidly at more than 700 percent. Spending on elementary and secondary education and higher education has grown at roughly an equal rate to police spending, but, combined, remains more than 4 times greater. The nation spends roughly an equal amount on transportation services as it does on policing.

It should be noted, however, that as with local police funding, there are wide variations in funding for other types of services, including education, which is largely funded through local revenues.[17] Poor neighborhoods with high incarceration rates often have some of the worst-performing and lowest-funded schools.[18] Thus, while education funding, nationally, consumes a significant share of government budgets, there may be areas in which increased funding is warranted and could reduce incarceration rates given the connections between education, poverty, and incarceration.[19] That said, the evidence on whether more funding produces better educational outcomes is mixed.[20]
Ultimately, it is difficult to know if a given area is spending the right amount of money on its police force. Comparisons to other cities of comparable size provide some useful context, but local factors vary greatly and each city must determine the appropriate level based on its particular needs and priorities.
Law Enforcement Employment
Given that the vast majority of police spending (97 percent) is attributed to operational expenses, which consist primarily of salaries and benefits, any conversation about reducing police funding will necessarily result in a reduction of the number of officers employed. [21] This outcome follows the stated goals of many of the “divest and reinvest” advocates, who want to see less contact with the police. Others have advocated for better racial representation to more closely reflect that of a given community, as an alternative to cutting police personnel.
Overall Employment
Over the past two decades, the number of law enforcement officers has grown, but at a slower rate than the population. As of 2016, there were roughly 701,000 full-time sworn general-purpose law enforcement officers; 468,000 were employed by local police departments, while the other third was employed by municipal, county, and regional police departments, sheriff’s offices, and state and highway patrol agencies.[22] Since 1997, the number of sworn general-purpose officers has increased 8 percent while the population has increased 21 percent, resulting in an 11 percent decrease in the number of officers per resident.[23] Some cities have seen larger declines: New York City’s police force declined 19 percent on a per capita basis between 1997 and 2016, for example.
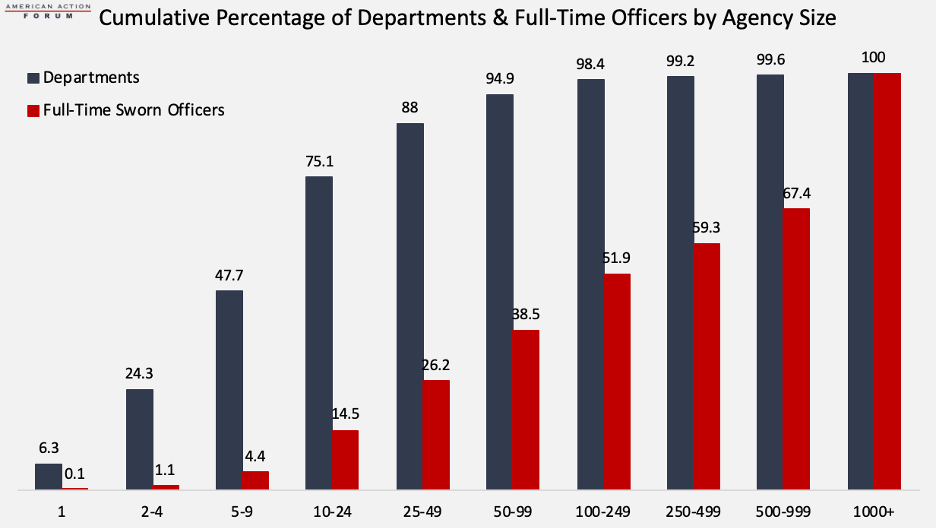
The number of officers employed by a given police department varies widely with significant concentration in the largest cities. Three-fourths of all local police departments employed just 14 percent of full-time officers: 770 departments (about 6.3 percent of all departments) employed a single officer; more than 2,200, representing 23.4 percent of agencies, employed 2 to 4; another 27 percent employed between 10 and 24.[24] Thus, 86 percent of all police officers were employed by just one-fourth of local police departments. New York City has long had the nation’s largest local police force, employing more than 5 percent of the nation’s sworn officers in 2016, and more than three times the 2nd largest force in Chicago (36,008 versus 11,965). Chicago, however, employs slightly more officers per resident (44 per 10,000, versus 42 per 10,000 in New York).[25] Los Angeles has the nation’s third largest police department but employs just 25 officers per 10,000 residents; Washington, DC, on the other hand, employs the most per capita at 54 per 10,000 residents, not counting the thousands of federal law enforcement officers stationed in the nation’s capital.[26]
Of note, the number of officers employed per resident is highest in the areas with the largest and smallest populations, as shown in Figure 2 of the Bureau of Justice Statistics’ 2016 report “Local Police Departments, 2016: Personnel,” copied below. Given the connection between crime and poverty, and the fact that poverty rates tend to be higher in large cities and small rural areas than mid-size suburban towns, this trend is not entirely surprising. Poverty rates in the suburbs, however, have been growing much more quickly than urban and rural areas, so this imbalance may change in the future.[27]
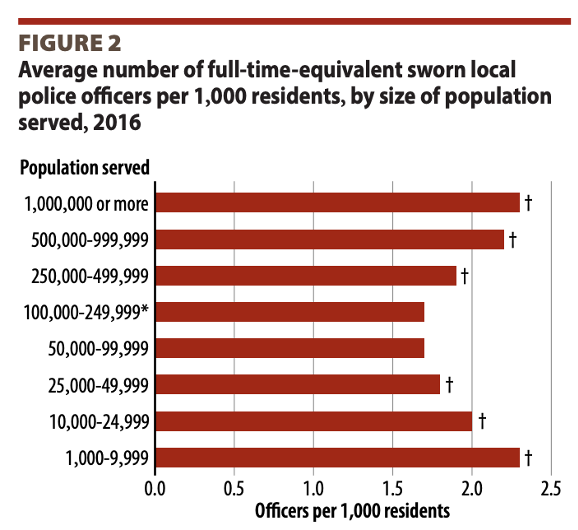 Source: Bureau of Justice Statistics’ 2016 report “Local Police Departments, 2016: Personnel
Are these policing levels appropriate? Not necessarily. Police unions and criminal justice experts suggest that staffing levels should be based on current and projected workload rather than a simple population-based determination.[28] The Department of Justice suggests workload determinations could be based, at least in part, on an examination of 911 calls, including an analysis of peak call times to allow for variation in staffing levels throughout the day and by day of the week as well as the types of calls to understand how much of an officer’s time is likely needed per call.[29] Other factors to consider include the productivity of the officers as well as a department’s scope of responsibilities. Given the possible range of variation in each of these factors, the appropriate number of officers in a given area will vary significantly based on local factors. Because of the complexity of this formula, however, most cities resort to simpler methods and thus may not be staffed at an ideal level—they could need either more or fewer officers.[30]
As these figures indicate, staffing levels vary by city, and often appropriately so. Thus, any efforts to cut the number of officers must be tailored to the city; a universal policy of cutting funding likely will leave numerous cities under-policed.
Racial and Ethnic Composition
Greater shares of racial and ethnic minorities are employed in police departments serving larger populations (with the exception of Black officers), where non-Whites tend to make up a larger share of the population. For example, in the 10 cities in the United States with a population of more than 1 million, on average, 17.8 percent of the of the population is Black and 37.8 percent of the population is Hispanic or Latino, while only 31.9 percent of the population is White and not Hispanic or Latino.[31] While the share of Black officers decreased to 16.6 percent in areas serving 1 million or more people, compared to 21.5 percent in areas serving between 500,000 and 1 million, this mirrors the demographic trends of larger cities: the Black population is higher in many of the cities with fewer than 1 million people, such as Indianapolis and Columbus, OH.[32], [33] Overall, the share of Black officers has remained relatively constant for the past 20 years, dipping slightly from 11.9 percent in 2013 to 11.4 percent in 2016, while the share of Hispanic officers and those of other minority groups has increased more than 50 percent, yet remains at just 12.5 percent for Hispanics and 3.6 percent for all other minorities.[34] Recent findings from The New York Times reveal that despite this growth among some minority groups, it has not been enough to make much of an impact in larger cities: Among the police departments with at least 100 officers, the share of White officers increased in more than two-thirds of departments between 2007 and 2016.[35] The overall share of White officers stands at 71.5 percent.[36]
Representation in leadership is also important. Police chiefs and supervisors were much more likely to be White, though there are significant differences between departments serving 250,000 people or more and those serving fewer people. Overall, 90 percent of police chiefs in 2016 were White, but among departments serving 250,000 or more, only 65 percent were White, while 19 percent were Black and nearly 13 percent were Hispanic.[37] A similar pattern follows for intermediate and first-line supervisors.[38]
While these data suggest an alternative policy to defunding—increasing diversity—they also point to a potential consequence of diverting funds from the police force. Because cutting police budgets will result in cutting personnel, and the first officers to be let go would likely be those with the least seniority, police forces would likely become less diverse as a result of defunding. In short, defunding the police could result in a police force that less reflects the makeup of the community it serves.
The Prospects for the Campaign to Divest and Reinvest
Police budgets vary widely across the country, both in nominal terms and as a percentage of a community’s overall budget. There are many reasons for this variation, including population and crime levels, historical spending trends, and revenue streams. This variation makes it difficult to determine if and which cities may be spending too much on their police force and thus how much money may be available to divert to other uses. There is one commonality, however: Any reduction in police budgets is almost guaranteed to lead to a reduction in police employment, given that 97 percent of police budgets pay for personnel costs.
With nearly half of the country’s police departments employing fewer than 10 officers, it seems unlikely they are significantly overstaffed or could easily reduce the size of their force without hindering their ability to respond to calls for help. While it is difficult to know how many police forces are over- or understaffed, many cities have failed to adopt the expert-preferred workload method for determining appropriate staffing levels based on need. The data also suggest there is room for improvement in increasing diversity to better reflect the communities served, in addition to other reforms. Policymakers should be mindful of local diversity rates as they consider any possible cuts to the police force; given that non-White officers are more likely to be newer hires, as noted above, any policy to make cuts based on years of service may result in disproportionately cutting officers of racial and ethnic minorities.
Besides understanding what’s possible, it’s also worth knowing what the American people want. Unfortunately, there is as much variation in the public’s opinions as in police funding and employment levels. A September poll by The New York Times in Wisconsin and Minnesota found only a third of non-White likely voters supported decreasing police funding, while the rest supported maintaining or even increasing funding. A national poll from Gallup in July found very different results: Overall, 47 percent of Americans supported the campaign to divest and reinvest, but support was much higher among Blacks at 70 percent compared with 49 percent of Hispanics and 41 percent of Whites.[39] There was even broader support for police-practice reforms and increasing transparency and accountability.[40] It is in this regard that the federal government could take advantage of its stake in police funding: Federal funds could be conditioned on the adoption of various reforms, as proposed in legislation from both the House and the Senate.
[1] https://issuu.com/ftpzines/docs/gbnf_zine_all
[2] https://www.yalelawjournal.org/essay/police-reform-and-the-dismantling-of-legal-estrangement
[3] https://www.multpl.com/united-states-population/table/by-year
[4] https://www.urban.org/policy-centers/cross-center-initiatives/state-and-local-finance-initiative/state-and-local-backgrounders/police-and-corrections-expenditures
[5] https://cbcny.org/research/seven-facts-about-nypd-budget
[6] https://cbcny.org/research/seven-facts-about-nypd-budget
[7] https://cbcny.org/research/seven-facts-about-nypd-budget
[8] https://www1.nyc.gov/office-of-the-mayor/news/487-20/in-face-an-economic-crisis-mayor-de-blasio-budget-prioritizes-safety-police
[9] https://www.chicago.gov/content/dam/city/depts/obm/supp_info/2020Budget/2020BudgetOverview.pdf
[10] https://www.urban.org/urban-wire/what-police-spending-data-can-and-cannot-explain-amid-calls-defund-police
[11] https://populardemocracy.org/sites/default/files/Freedom%20To%20Thrive%2C%20Higher%20Res%20Version.pdf
[12] https://www.statista.com/chart/21963/amount-spent-on-policing-per-person/
[13] https://bbmr.baltimorecity.gov/sites/default/files/Final%20SOTA%20FY20-compressed%20web.pdf
[14] https://www.politifact.com/largestcities/, https://www.statista.com/chart/21963/amount-spent-on-policing-per-person/
[15] https://minneapolismn.opengov.com/transparency#/35901/
[16] https://www.nasbo.org/reports-data/state-expenditure-report
[17] https://www.governing.com/topics/education/gov-state-education-spending-revenue-data.html
[18] https://www.prisonpolicy.org/scans/naacp/misplaced_priorities.pdf
[19] https://www.americanactionforum.org/research/incarceration-and-poverty-in-the-united-states/
[20] https://www.brookings.edu/research/its-not-nothing-the-role-of-money-in-improving-education/
[21] https://www.urban.org/policy-centers/cross-center-initiatives/state-and-local-finance-initiative/state-and-local-backgrounders/police-and-corrections-expenditures
[22] https://www.bjs.gov/content/pub/pdf/lpd16p.pdf
[23] https://www.bjs.gov/content/pub/pdf/lpd16p.pdf
[24] https://www.bjs.gov/content/pub/pdf/lpd16p.pdf
[25] https://www.bjs.gov/content/pub/pdf/lpd16p.pdf
[26] https://www.bjs.gov/content/pub/pdf/lpd16p.pdf
[27] https://www.pewsocialtrends.org/2018/05/22/demographic-and-economic-trends-in-urban-suburban-and-rural-communities/
[28] https://www.hsdl.org/?view&did=727864
[29] https://www.governing.com/topics/public-justice-safety/gov-cities-police-officers-hiring.html
[30] https://www.hsdl.org/?view&did=727864
[31] https://www.census.gov/quickfacts/newyorkcitynewyork?
[32] https://www.bjs.gov/content/pub/pdf/lpd16p.pdf
[33] https://www.census.gov/quickfacts/fact/table/IN,indianapoliscitybalanceindiana/PST045219
[34] https://www.bjs.gov/content/pub/pdf/lpd16p.pdf
[35] https://www.nytimes.com/interactive/2020/09/23/us/bureau-justice-statistics-race.html
[36] https://www.bjs.gov/content/pub/pdf/lpd16p.pdf
[37] https://www.bjs.gov/content/pub/pdf/lpd16p.pdf
[38] https://www.bjs.gov/content/pub/pdf/lpd16p.pdf
[39] https://news.gallup.com/poll/315962/americans-say-policing-needs-major-changes.aspx
[40] https://news.gallup.com/poll/315962/americans-say-policing-needs-major-changes.aspx