Research
November 30, 2017
Energy Growth and Employment from Renewable Sources
Summary
- Non-hydro renewable energy is the fastest growing utility-scale electricity sector, with generation growth of 490 percent since 2001. Of that growth, about 81 percent was from wind, 13 percent from solar, and 6 percent from other renewables.
- The Department of Energy estimates there are 860,000 jobs supported by electric generation in the United States, up 13 percent from the year prior. Virtually all growth has been from the renewable energy industry, with wind employment increasing by 32 percent in the same period and solar employment increasing by 7 percent.
- Policymakers should avoid policies that could unduly distort energy markets, and instead focus on creating a level playing field where private sector preferences are a stronger force.
Introduction
In the 1970s, the United States suffered an economic downturn that was exacerbated by oil embargoes and other constraints on fossil fuel availability. Consequently, there was a major energy policy shift with an aim to spur domestic energy production. Affordable non-hydro renewable energy was a particularly targeted goal of U.S. energy policy, and Americans are now bearing the fruit of those policies (federally funded research, tax incentives, etc.). Renewable energy sources, particularly wind and solar power, are the fastest growing electricity sources in the United States.
The falling costs of wind and solar power have spurred a market preference for these energy sources where they are available. This is reflected in the data of planned capacity growth among energy sources, and American Action Forum (AAF) analysis projects that over the next ten years there will be at $268 billion invested in new electrical generating capacity, of which $120 billion will be in new wind power and $20 billion in solar power, making up more than half of all expected capital investments in currently planned capacity additions. Similarly, employment growth in these industries has grown significantly, and combined renewable energy industries make up two-thirds of all jobs related to electric generation.
This report takes a closer look at the state of renewable energy in the United States, with an emphasis on wind and solar power. The report observes energy generation, expected investments, and employment data. Overall, the renewable energy sector in the United States has grown considerably, will continue to grow, and should be expected to be a significant portion of the nation’s electricity portfolio for the foreseeable future.
Renewable Energy Growth
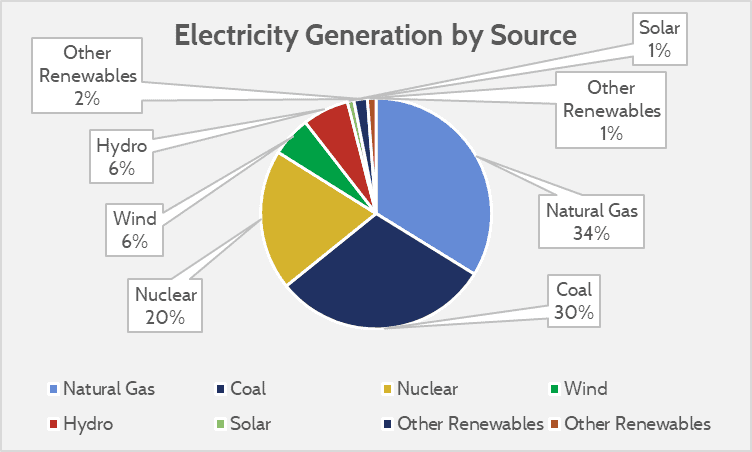
According to the Energy Information Agency (EIA), the share of U.S. electricity generation from non-hydro renewable energy in 2001 was 1.8 percent. Since then, it has grown to 8.5 percent. Wind power has been the biggest source of that growth, accounting for 5.6 percent of the total U.S. electricity generation today. Utility-scale solar still accounts for only about 1 percent, and other non-hydro renewables are about 2 percent of total electricity generation.
 Source: Energy Information Administration
From 2001 to 2016, wind has gone from 6.7 million megawatt-hours (MWh) to 226.8 million MWh. Solar has increased from 0.5 to 36.7 million MWh, and other non-hydro renewables have grown from 63.5 to 79.9 million MWh. This equals about 25 million more households being powered by renewable energy today than in 2001 (assuming an average 10,766 kilowatt-hours of annual consumption).
Job Growth
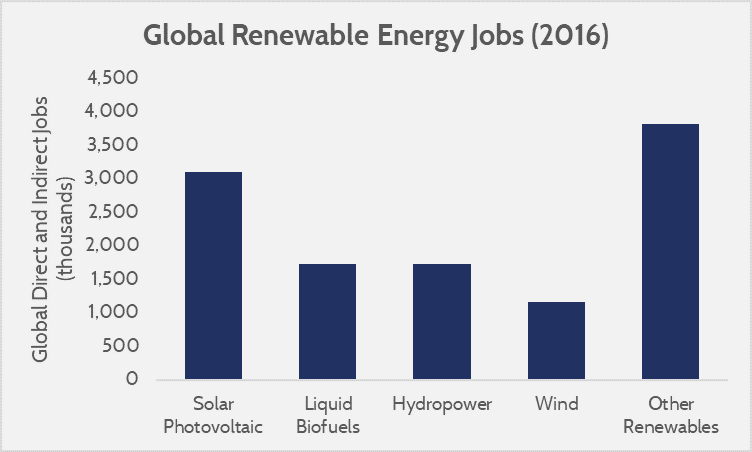
Growing interest in renewable energy, increased production output, and increased capital investment has spurred renewable energy job creation globally. According to the International Renewable Energy Agency (IRENA), there are now 9.8 million jobs worldwide either directly or indirectly supported by renewable energy. Of this 9.8 million, 3.1 million are from solar, 1.2 million are from wind, 1.7 million are from hydropower, and 3.8 million are from non-hydro renewables.
 Source: IRENA, Renewable Energy Jobs Annual Review
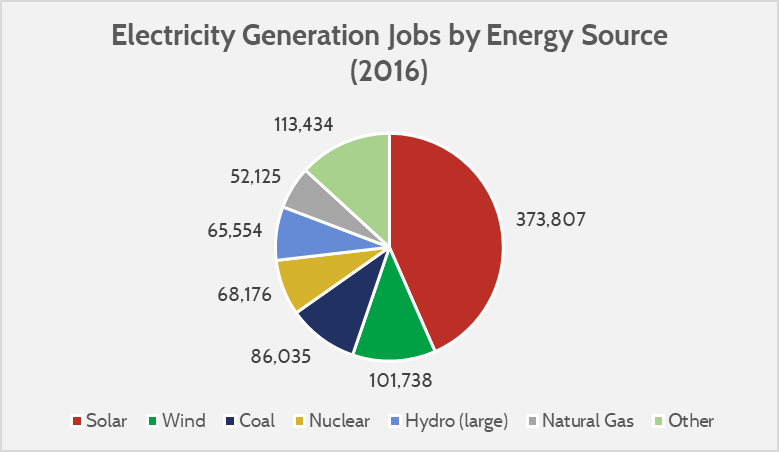
Domestically, the total energy industry (including non-electric energy consumption) is responsible for about 1.9 million jobs per the Department of Energy’s (DOE) latest Energy and Employment Report. Renewables, including hydropower, account for 678,000 of those jobs, or about 35 percent. Jobs related to electric generation makes up about 860,000 of those 1.9 million total jobs, and renewable energy accounts for 66 percent of total electric generation-related employment.
 Source: DOE Energy and Employment Report, 2017
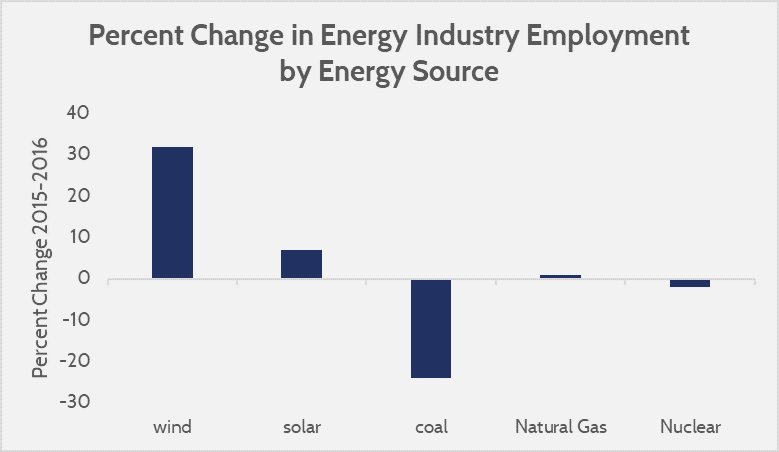
In terms of employment change, renewable energy in the electric generation source has been growing considerably faster than fossil fuels or nuclear power. According to the DOE, employment in the coal industry declined 24 percent from 2015-2016, and natural gas employment remained flat at a growth rate of about 1 percent. Nuclear employment declined by 2.1 percent. Renewables showed considerable growth, with wind employment growing by 32 percent in 2015-2016, and solar growing by 7 percent.
Source: Department of Energy, 2017 Energy and Employment Report
These growth changes are consistent with the changing composition of the electric power sector. A previous AAF report found that declines in coal generation can be explained almost entirely by the falling costs of natural gas and wind power. AAF found that about two-thirds of coal generation decline was being replaced by natural gas, and about one third was being replaced by renewables (mostly wind power). Furthermore, AAF concluded that the changing composition of the electricity sector was explained mostly by market preference and costs, rather than by regulation.
Expected Investment
In line with the DOE’s expected employment growth by industry, AAF estimates considerable capital investment in energy over the next ten years that heavily favors renewable energy. Data from the EIA shows there are about 112 gigawatts (GW) of planned capacity additions in the electric power sector over the next ten years, of which 70 GW will be renewable; 51 GW from wind, 5 GW from solar, and 14 GW from other renewables (including hydro).
AAF estimates the required investment for the above 112 GW of capacity additions will be approximately $268 billion over the next ten years. Of this, the largest shares of energy investment will be to wind power ($120 billion), natural gas ($37 billion), and nuclear power ($26 billion).
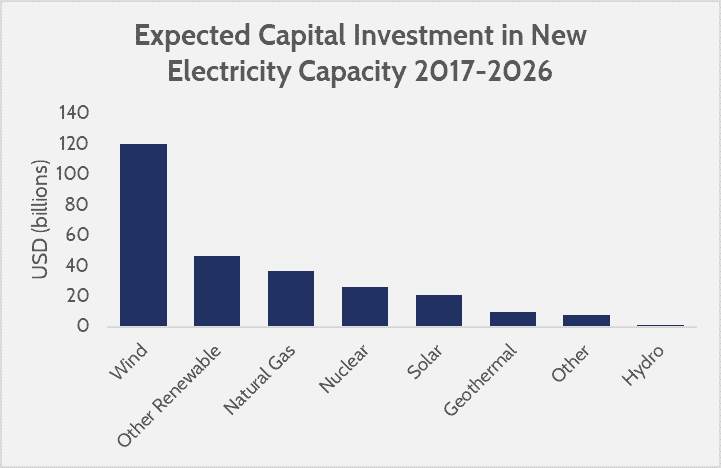 Source: AAF estimates based on EIA planned capacity data and overnight capital costs.
Projected Electricity Demand, Labor Requirements, and Capital Investment Required
The rate of growth in electricity demand over recent years has been relatively low and has favored traditional electricity sources. However, this trend will not continue indefinitely. The EIA projects modest growth in U.S. electricity demand, and expects that new capacity will be provided mostly by renewable energy. While critics may point out that renewable power’s intermittency prevents it from entirely supplanting baseload sources, such an argument fails to acknowledge that renewable power has shown itself to be a common choice for servicing new electricity demand. The capital costs for wind and solar have dropped significantly over the past ten years, and by 2022 will have comparable unsubsidized electricity costs to that produced by natural gas, which is currently the cheapest electricity source.
The following data illustrates the role that renewable power, particularly wind, will play in electricity markets as a high-productivity energy source, though one should note that jobs assessments are only focused on electricity generation. Supply chain comparisons, which give a better idea of overall industry employment, are omitted due to data unavailability.
The EIA’s latest projections through 2027 show an increase in annual electricity demand of around 400 GWh, or about a 10 percent increase from current levels. Virtually all the increased production is expected to come from wind power, hydroelectricity, and solar power, with fossil fuel energy likely becoming more stagnant and a slight decline in nuclear power.
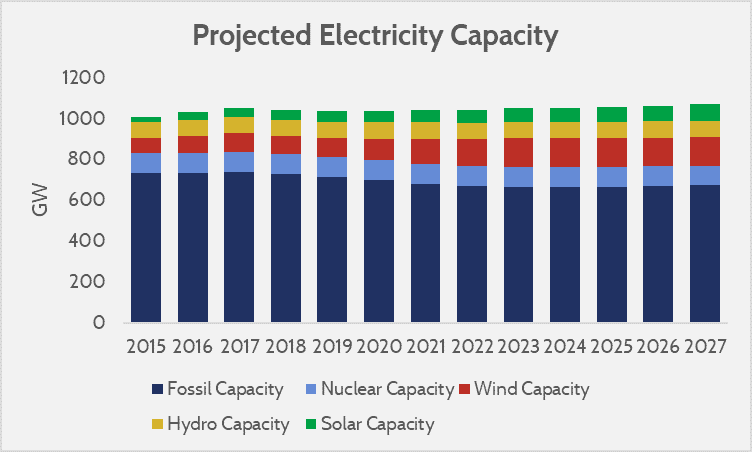 Source: EIA AEO 2017 (No CPP Side Case)
Growth in renewable energy capacity will change the composition of labor requirements in electricity generation, and likely lead to an overall increase in worker productivity. Renewable energy sources, once installed, can satisfy demand with a smaller labor pool, improving their cost competitiveness with labor-intensive electricity sources..
On average, the number of workers required to generate one gigawatt hour (GWh) of electricity varies significantly across electricity generation types. Wind requires the least number of workers, and nuclear requires the most. Note that these figures are based only on the Bureau of Labor Statistics’ (BLS) reporting of workers employed by utilities. As the DOE has noted, the BLS has not yet developed codes for differentiating electricity-specific employment in supporting industries.[1] Overall industry employment is substantially different, as only 4.1 percent of wind jobs and 0.7 percent of solar jobs are in utilities, whereas 37.3 percent of coal jobs and 14 percent of natural gas jobs are represented in utilities data.
| Electricity Generation Jobs | Mean Annual Earnings | 2015 Generation (Thousand GWh) | Labor Cost/GWh | |
| Fossil | 94,100 | 77,990 | 2723 | $ 2,695 |
| Nuclear | 48,140 | 88,400 | 797 | $ 5,338 |
| Wind | 4,220 | 72,170 | 193 | $ 1,575 |
| Hydro | 5,850 | 72,810 | 249 | $ 1,711 |
| Solar | 2,290 | 90,250 | 40 | $ 5,104 |
Source: AAF estimates based on May 2016 BLS’ OES data, and EIA reported electricity data.
The chart above shows nuclear coming in at the highest, which is not surprising considering the stringent security requirements imposed on nuclear power. Solar power is also high, despite the fact that it requires very little labor in comparison to its installed capacity. Wind power has the lowest labor costs and lowest number of workers relative to the total electricity generation, making it essentially the most productive electricity source per laborer (for utilities only).
The graph and chart below show the ratio of labor requirements of workers for each electricity source to the EIA’s projections for electricity generation and produces an estimate of the potential labor costs for each source in 2027.
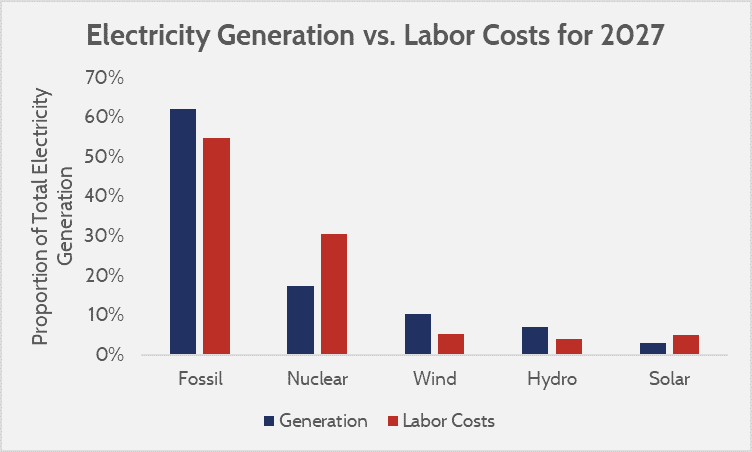
| Fossil | Nuclear | Wind | Hydro | Solar | |
| Generation in 2027 (GWh) | 2724 | 766 | 451 | 312 | 134 |
| Labor Costs in 2027 (2016 $, billions) | 7.34 | 4.09 | 0.71 | 0.53 | 0.68 |
Source: AAF estimate based on EIA AEO 2017 data and BLS May 2016 OES data.
Wind will have significantly lower labor costs (excluding construction and manufacturing) relative to the produced electricity. Note, though, that levelized electricity costs that include the entirety of costs in supply chains will paint a different picture. The above data merely shows that the utilities component of electricity costs for wind power is highly efficient, and a likely contributor to its projected demand.
Possible Changes to Energy Tax Credits
The House version of the Tax Cuts and Jobs Act (TCJA) proposes a reduction in the Production Tax Credit (PTC), originally a 1.5 cent per kilowatt hour tax credit on production from eligible sources, which is adjusted for inflation (and currently sits at 2.3 cents per kilowatt hour). The Treasury Department estimated in 2017 that the 10-year cost of the PTC would be $40 billion, and AAF estimates that 92 percent of that value will go to wind power.
In the proposed tax reform, new facilities that go into operation in 2018 will only be eligible to claim the PTC without an inflation provision, or at 1.5 cents per kilowatt hour instead of 2.3 cents per kilowatt hour. The Joint Committee on Taxation (JCT) estimates that this change would save the federal government $12.3 billion, and this money will go to reducing other taxes.[2] As the PTC mostly goes to wind power, states that have a lot of wind power capacity planned—especially Texas—will be most affected by the change. It should be noted, however, that other aspects of the tax reform, such as the reduction in the corporate and business tax rates, would yield other benefits.
The House version of the TCJA also includes changes to other renewable energy tax credits; however, these changes are aimed mostly at expanding the eligibility of the Investment Tax Credit (ITC). These changes would boost preferences, and thus employment, in affected industries—but the BLS does not yet track employment at a granular level in the affected industries, and there is insufficient data to show employment in those specific industries outside of solar.
Wind and Solar Energy by State
In 2016, 47 states were using wind and solar energy. The five states with the most electricity generation from wind and solar were Texas, California, Oklahoma, Iowa, and Kansas, with Texas having the most. In total, these states accounted for 55 percent of total U.S. wind and solar electricity generation. The maps below show wind and solar generation by state, as well as the estimated employment in both industries (data for other non-hydro renewables on employment was not consistently available).
Wind Generation and Employment by State, and PTC Changes
Solar Generation and Employment by State
Conclusion
Renewable energy, led primarily by wind power, has a growing economic footprint. Overall, the data make a very clear point: Renewable energy, especially wind power, will be a growing component of the U.S. energy portfolio, and most new electricity demand will be serviced by renewable energy. Policymakers should be careful to ensure government policies do not impede the growth of renewable energy capacity in the United States. In particular, policymakers should recognize that renewable energy is in high demand, and avoid policies that could unduly distort markets or contribute to market uncertainty. The path forward for the treatment of energy sources, particularly as they pertain to tax policy and regulations, should be focused on creating a level playing field where private sector preferences are a stronger force.
[1] U.S. Energy and Employment Report, U.S. Department of Energy, page 37 (January 2017: Washington, D.C.)
[2] Note that although the JCT’s official score of the change is $12.3 billion, AAF is not convinced that this value will be reflected over ten years. Past scoring of “tax expenditures” are based on tax form behavior, meaning it does not assume behavioral changes in response to a change in the tax provision. As the baseline estimate is $40 billion, an estimated savings of $12.3 billion most likely reflects an estimated change to all PTC eligible parties that are currently claiming or expected to claim the PTC. However, the text of HR1 specifies that the the inflation provision “shall not apply with respect to any electricity or refined coal produced at a facility the construction of which begins after the date of the enactment…” Meaning the reduced subsidy is likely much lower than $12.3 billion, as there are 22.7 gigawatts of capacity planned on top of the current capacity of 81.3 gigawatts.