


Research
May 9, 2023
Evaluation and Macroeconomic Impact of the FairTax
Executive Summary
The FairTax Act of 2023 (H.R. 25) would replace the existing federal revenue system – individual income tax, corporation income tax, payroll taxes, and estate and gift taxes – with a single, national sales tax. This analysis presents an evaluation of the FairTax as designed in H.R. 25 and estimates its macroeconomic impacts. It finds:
- The 23-percent tax rate in H.R. 25 is an optimistic lower bound; measured on a tax-exclusive basis, applied to a tax base more typical of state sales taxes, and in the presence of significant non-compliance, the rate could reach a confiscatory level in excess of 380 percent.
- Under the FairTax, American families would face an immediate jump in consumer prices comparable in size to the applicable tax rate, and a reduced standard of living over the first five, and possibly 10, years.
- Ultimately, a shift to taxing consumption generates increases in capital accumulation, labor supply, and output; the most beneficial effects occur when discipline on the size of government keeps the tax rate as low as possible.
Introduction
The fair tax is a long-standing tax reform proposal that would replace the existing federal revenue system – individual income tax, corporation income tax, payroll taxes, and estate and gift taxes – with a single, national sales tax. The fair tax has two immediately appealing features: its apparent simplicity and potential economic efficiency. A sales tax is one form of consumption taxation; moving the United States toward a reliance on consumption taxation would improve long-run incentives for saving, capital accumulation, output growth, and productivity growth.
The FairTax also comes with a list of immediate concerns: Sales taxes are notoriously regressive (although advocates will argue that FairTax design features address this), a federal sales tax would poach on a tax base important to many states, the tax rate would have to be quite high to replace existing federal revenue, there would be strong incentives to evade the tax, and when introduced prices would rise enough to accommodate the tax (following the standard assumption that the Federal Reserve accommodates FairTax by increasing the money supply). In an economy currently enduring the highest inflation in four decades, this latter feature is especially problematic at this moment.
With news reports that the most recent legislative version of the FairTax, the FairTax Act of 2023, (H.R. 25), may be taken up for consideration by the House of Representatives, the American Action Forum (AAF) sought to identify better the empirical magnitudes of the impacts. To move past a qualitative discussion of the FairTax requires a formal model of the U.S. economy. AAF retained EY’s Quantitative Economics and Statistics (QUEST) Group to conduct the analysis. EY’s “overlapping generations model” (see the Appendices) is similar to those used by the Congressional Budget Office, the Joint Committee on Taxation, and the U.S. Treasury Department. It thus embodies the consensus impacts in the research literature.
Description of the FairTax
The FairTax would replace the corporate income, individual income, payroll, and estate and gift taxes with a national retail sales tax. The FairTax would nominally abolish the Internal Revenue Service. The import of this feature is not obvious, however, because there would nevertheless have to be some tax administration authority in its stead.
A retail sales tax is a consumption tax as it would apply to final sales to consumers. The FairTax, as proposed in H.R.25, would be imposed at a 23-percent inclusive rate (see below) on a broad base of consumption that also includes consumption by governments (federal, state, and local).
The FairTax includes a Family Consumption Allowance (FCA) that would rebate each month the tax liability owed at the federal poverty level (which varies by family size) for all families. This would effectively exempt from tax a subsistence level of consumption and reduce the regressivity of the FairTax. The FCA also includes an adjustment to address the marriage penalty.
The FairTax adjusts Social Security benefits for the initial changes in the price level as measured by the Consumer Price Index. This adjustment is intended to ensure that the real value of Social Security benefits would be maintained after the FairTax has the effect of substantially raising effective prices.
Analytic Issues
This analysis estimates the macroeconomic impacts of the FairTax. In doing so, EY had to consider alternative estimating assumptions. The first is the degree of non-compliance under the FairTax. As noted above, the text of H.R. 25 specifies a 23-percent tax rate. Yet with substantial non-compliance, the tax rate would have to be much higher. The research literature suggests a base case of 15 percent non-compliance, but EY also did a sensitivity analysis of the implications of 30-percent rate of non-compliance.
A related issue is whether the tax rate is expressed on a tax-inclusive or tax-exclusive basis. To see the difference, the tax-exclusive tax rate is the tax over a good’s pre-tax price. Suppose, for example, a product costs $100 and the sales tax is $30. In this case, the tax-exclusive rate is 30 percent ($30/$100). In contrast, the tax-inclusive rate would be 23 percent ($30/($100+$30)). H.R. 25 specifies a 23-percent tax-inclusive rate.
A second issue is how the FairTax affects the size of government. If the initial FairTax rate provides insufficient revenue to maintain this, one could simply keep the amount of spending unchanged and adjust the tax rate. Notice that even if consumption taxes have better growth incentives, prohibitively high taxes will still damage economic growth.
Alternatively, one could adjust spending to restore budget stability. If the FairTax results in both more efficient taxation and a smaller government that permits lower tax rates, the growth outcomes would be much improved. Nevertheless, this would have more to do with shrinking the size of government than the FairTax per se.
A final and related issue is whether government spending is productive. If some government spending adds to the productivity capacity of the economy, shrinking the size of government is no longer an unambiguous improvement in growth prospects. EY conducted a sensitivity analysis regarding the productivity of government spending as well.
Basic Results
What Is the FairTax rate?
The starting point for the analysis is the estimated tax rates required to replace the existing revenue sources. These rates are shown in Table 1. As shown in the first column, the tax rate in H.R. 25 is 23 percent (tax-inclusive basis) or 29.9 percent (tax-exclusive basis). Those rates, however, are not sufficient to maintain the existing size of federal spending (in real, inflation-adjusted) terms. To do so without any non-compliance means the rates have to be either 27.8 or 38.4 percent on a tax-inclusive and tax-exclusive basis, respectively. Not surprisingly, as non-compliance rises, the rate required to maintain the size of government rises as well and reaches 68.8 percent when measured on a tax-exclusive basis.
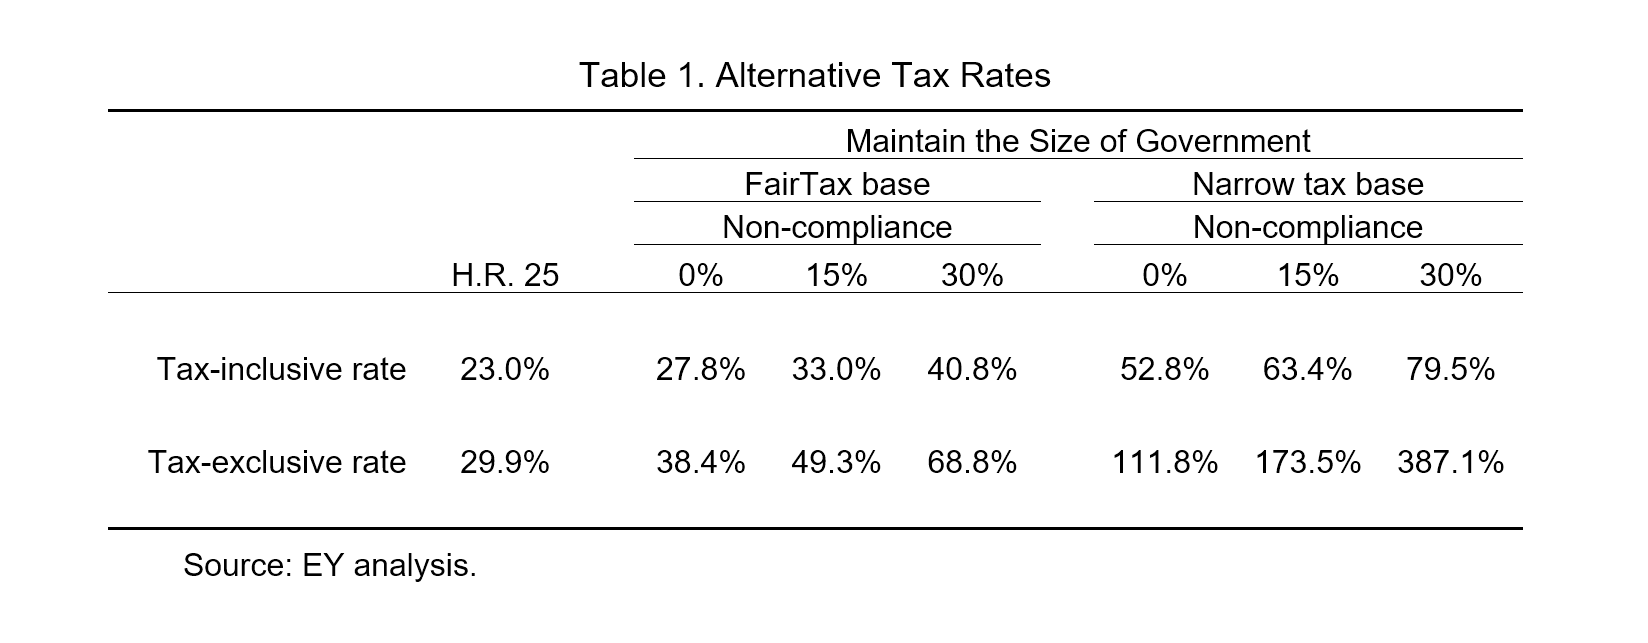 The right-side panel of Table 1 displays much higher estimates of the necessary tax rate. These reflect the real possibility that political considerations will make it difficult to tax all consumption (as was assumed thus far). Instead, these tax rates are imposed on a base typical of state sales taxes, which is much narrower (see the Appendices). Clearly, the base matters immensely. With perfect compliance, the tax rates rise to 52.8 and 111.8 percent, respectively, as compared to 23 and 29.9 percent. Acknowledging the reality of non-compliance raises these rates further. As shown at the lower right, the combination of a narrow base and 30 percent non-compliance yields a tax-exclusive rate of 387.1 percent.
Macroeconomic Impacts
What happens to the trajectory of the economy if the FairTax is adopted? The first impact will be a jump in consumer prices (assuming accommodation by the Federal Reserve). The FairTax will be collected from sellers. So, as discussed above, sellers will be obligated to remit, say, 27.8 cents on every dollar of sales. In the absence of any change, businesses will receive 72.8 cents, whereas they once received a full $1.00. There will be a natural incentive for those businesses to raise their prices in order to restore their revenues. Under the most optimistic scenario, retail prices across the economy would rise 27.8 percent – an enormous jolt to consumer prices.
Beyond the initial inflation dynamics, Table 2 summarizes the projected macroeconomic impact of the FairTax for the base case of a broad tax base and some government spending on productive public capital. The left-hand panel shows the results assuming 15 percent non-compliance, while the right-hand panel assumes 30 percent non-compliance. The results differ little; this discussion will focus on the lower non-compliance.
The most dramatic finding is that a large consumption-based tax dramatically alters the mix of demand in the economy. Household purchases of goods and services (inflation-adjusted) are an average of 3.0 percent lower each year for the first five years, while investment spending jumps sharply and averages 18.3 percent more over the same period. The large amount of capital formation raises productivity and real wages (up 4.3 percent), and attracts greater labor supply. Overall gross domestic product (GDP) is 3.1 percent greater, on average, over the first five years. 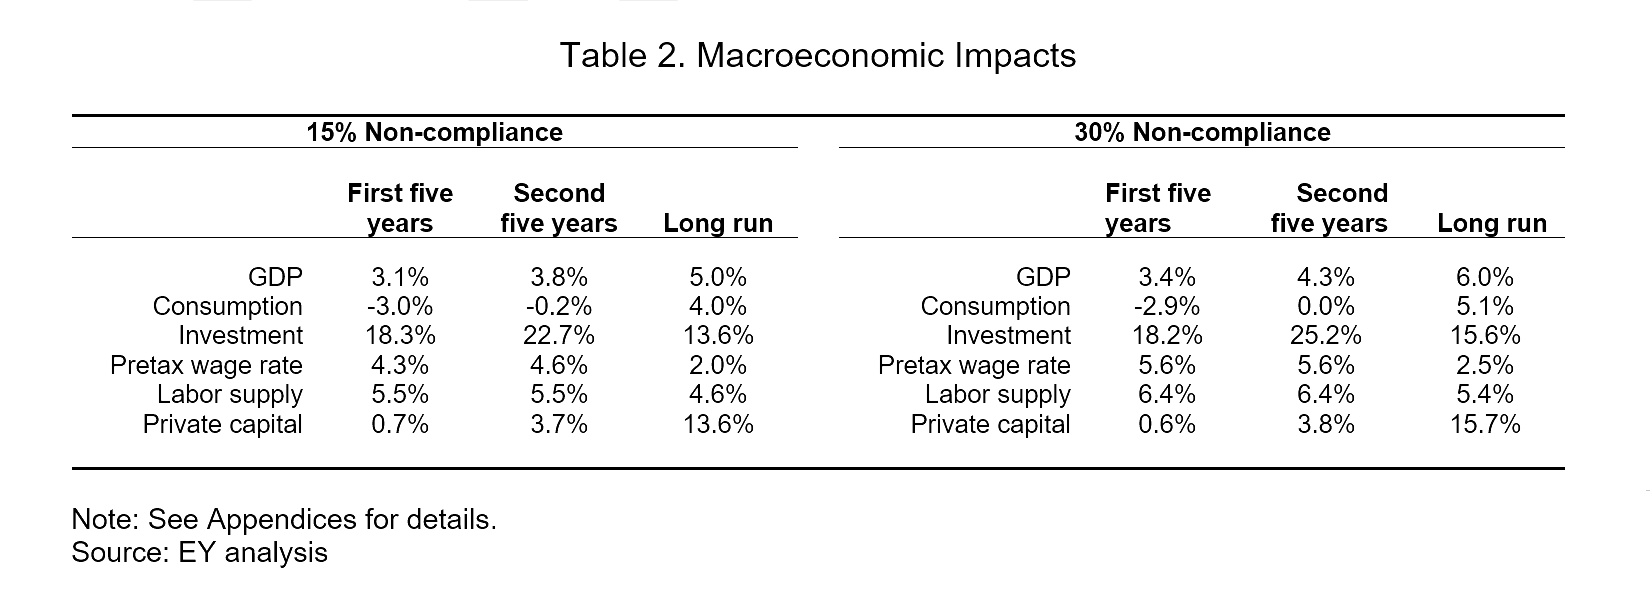 This same pattern – greater investment at the expense of diminished consumption for the household sector – is repeated for the second five years. Only in the very long run does the more rapid growth and expanded size of the economy permit household consumption to rise.
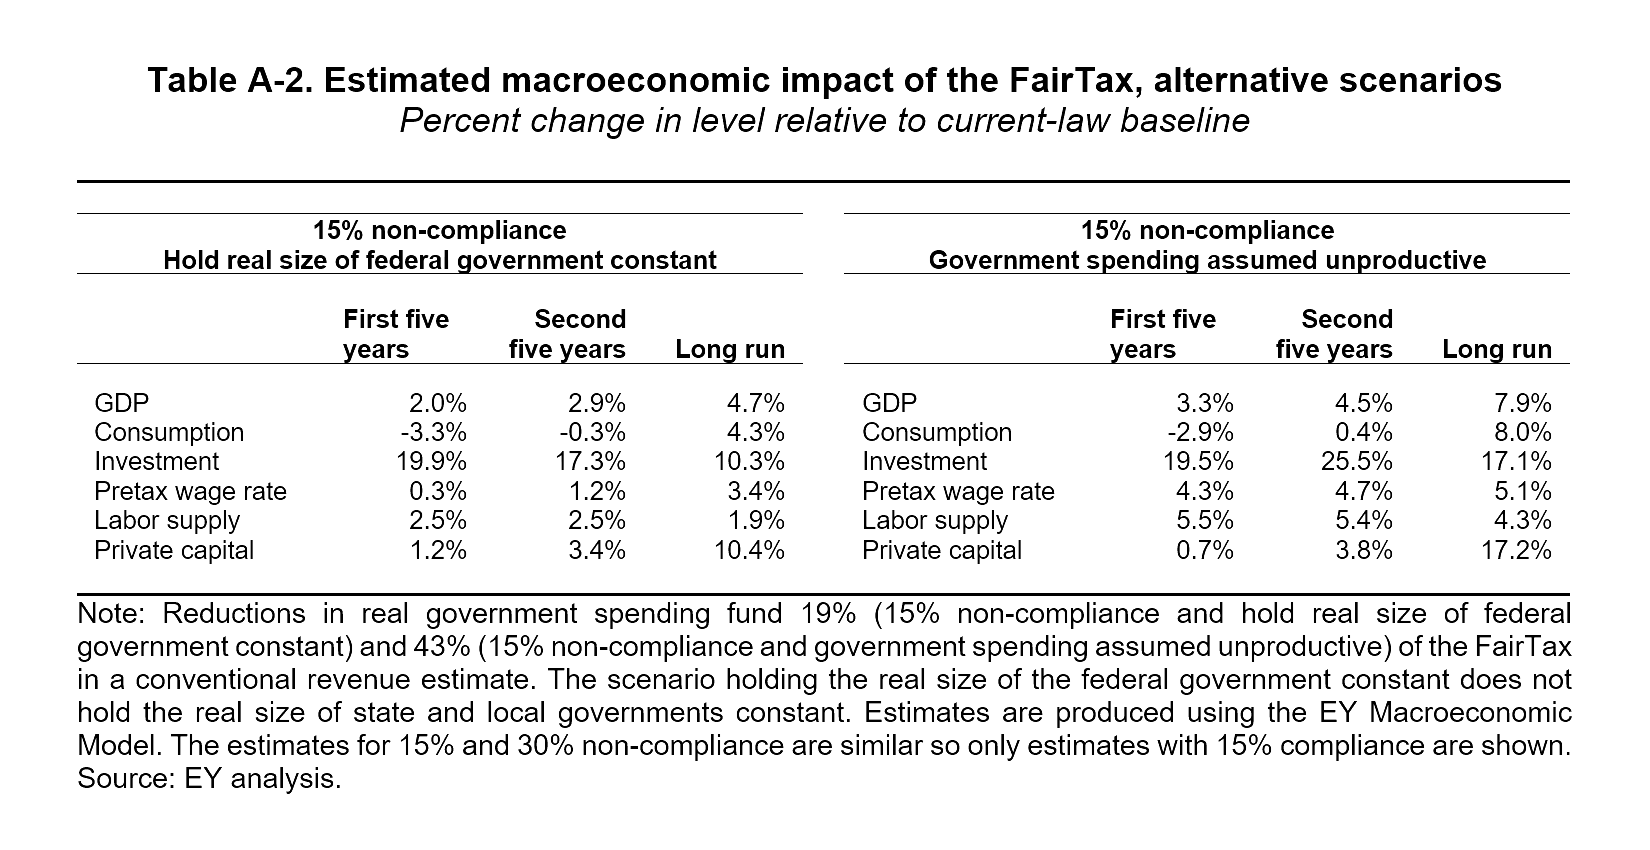
Sensitivity Analysis
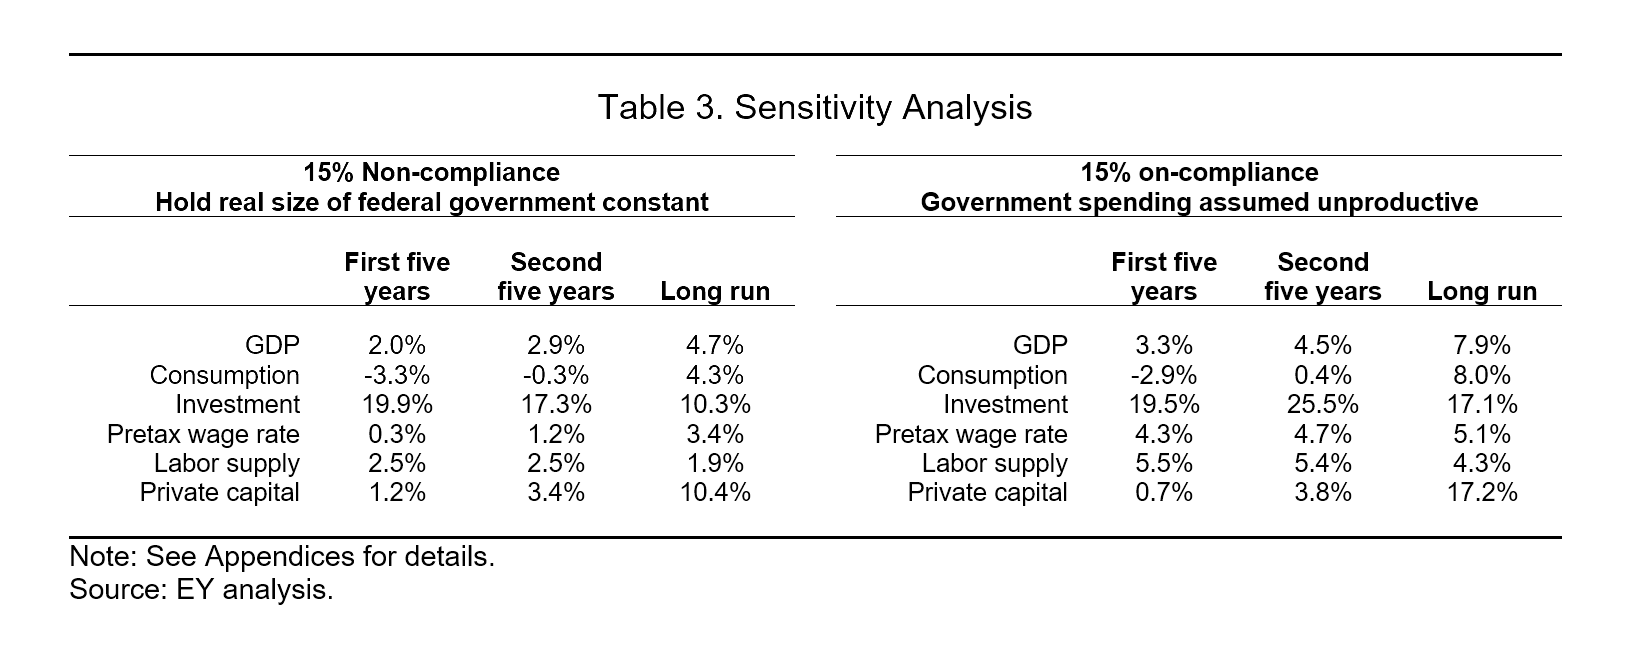
To gain a feel for the importance of the key assumptions, EY conducted a sensitivity analysis, the results of which are presented in Table 3. In each case, EY assumed 15 percent non-compliance. In the left-hand panel, EY assumed the size of government is held constant. In the base case, the FairTax causes the government to shrink considerably. Freezing this channel results in a larger government. Compared to the base case, this yields higher taxes, a more muted investment response, smaller gains in labor supply and productivity, and a smaller impact on GDP. The impact on household consumption is roughly the same. Put differently, this comparison suggests that the negative impacts on households stem directly from the FairTax, while some of the beneficial growth effects stem from shrinking the size of government and not simply a switch to consumption taxation.
The final sensitivity analysis eliminates the assumption that some government spending is dedicated to productive capital. In this case, the benefits of shrinking the government are unalloyed – no productivity-enhancing capital is lost in the process. As a result, investment, labor supply, productivity, and GDP growth are all stronger than in the base case. In addition, households recover from the negative shock of the FairTax more quickly.
Appendices
Appendix A: Estimated macroeconomic impacts of the FairTax
 Appendix B: Revenue and “government spending” neutral tax rates
 Appendix C: Description of macroeconomic model used to estimate economic impacts of the FairTax
The FairTax would replace the corporate income, individual income, payroll, and estate and gift taxes with a national retail sales tax. A retail sales tax is perhaps the most obvious form of consumption tax as it would apply to final sales to consumers. The FairTax, as proposed in H.R.25, would be imposed at a 23% rate on broad base of household consumption. The tax base also includes consumption by the government (i.e., federal, state, and local).
The FairTax includes a Family Consumption Allowance (FCA) that would rebate the amount of tax paid at the poverty level for all families. The FCA would be provided monthly and, because it is tied to the poverty level, would vary by family size. The FCA also includes an adjustment to address the marriage penalty. The FCA is included in the FairTax to address the regressivity of consumption taxes.
The FairTax also adjusts Social Security benefits for changes in the price level as measured by the Consumer Price Index. This adjustment is intended to ensure that the real value of Social Security benefits would be maintained.
This analysis estimates the macroeconomic impacts of the FairTax. As both the treatment of government consumption and assumptions regarding potential non-compliance under the FairTax are significant, the macroeconomic impacts are estimated with different assumptions regarding non-compliance, whether the real size of government falls or is held constant, and whether government consumption adds to the productive capacity of the US economy.
This analysis also estimates the revenues under the FairTax with different assumptions regarding compliance, which provides a measure of the reduction in the size of the federal government under the proposal, as well as revenue neutral or “spending neutral” rates under the FairTax base and a hypothetical narrow tax base assuming that the real size of the federal government is maintained.
The tax rates are estimated on both a tax-inclusive and tax-exclusive basis. Although H.R. 25 specifies a 23% tax rate, this rate is a tax-inclusive rate where the 23% tax is related to the total after-tax price. Sales taxes are typically expressed as tax-exclusive rates, which reflect what one would pay at a cash register. The tax-exclusive tax rate is the tax over a good’s pre-tax price. Suppose, for example, a good costs $100 and the sales tax is $30. Then, the tax-exclusive rate is 30 percent ($30/$100).
The tax-inclusive rate is instead the ratio of the tax payment to the entire cost of the good, including both the pretax price and the tax payment. Following the above example, the tax-inclusive rate is the tax paid, $30, divided by the total cost to the consumer for the good, $130, with a resulting tax-inclusive rate of 23%=$30/(1+$30). Income and payroll taxes are typically expressed as tax-inclusive rates. The tax-exclusive rate is useful to compare a national retail sales tax, such as the FairTax, to existing state and local sales taxes, while the tax-inclusive rate is useful to compare it to existing income and payroll taxes.
EY macroeconomic model of the US economy
This analysis uses an overlapping generations (OLG) general equilibrium model of the US economy to estimate the macroeconomic impacts of the FairTax. This appendix provides a description of the OLG model, the methodology, and various assumptions underlying the estimates. Important assumptions about how the FairTax might operate are also described, as well as caveats and limitations.
Overview of OLG general equilibrium model
The OLG model used for this analysis is similar to those used by the Congressional Budget Office, Joint Committee on Taxation, and US Treasury Department.[1] In this model, tax policy affects the incentives to work, save and invest, and to allocate capital and labor among competing uses. Representative individuals and firms incorporate the after-tax return from work and savings into their decisions on how much to produce, save, and work.
The general equilibrium methodology accounts for changes in equilibrium prices in factor (i.e., capital and labor) and goods markets and simultaneously accounts for the behavioral responses of individuals and businesses to changes in taxation. Behavioral changes are estimated in the OLG framework, whereby representative individuals with perfect foresight incorporate changes in current and future prices when deciding how much to consume and save in each period of their life.
High-level description of model’s structure
- Production
Firm production is modeled with the constant elasticity of substitution (CES) functional form, in which firms choose the optimal level of capital and labor subject to the gross-of-tax cost of capital and gross-of-tax wage. The model includes industry-specific detail through use of differing costs of capital, factor intensities, and production function scale parameters. Such a specification accounts for differential use of capital and labor between industries as well as distortions in factor prices introduced by the tax system. The cost of capital measure models the extent to which the tax code discriminates by asset type, organizational form, and source of finance.
The industry detail included in this model corresponds approximately with three-digit North American Industry Classification System (NAICS) codes and is calibrated to a stylized version of the 2014 US economy. Each of 36 industries has a corporate and pass-through sector except for owner-occupied housing and government production. Because industry outputs are typically a combination of value added (i.e., the capital and labor of an industry) and the finished production of other industries (i.e., intermediate inputs), each industry’s output is modeled as a fixed proportion of an industry’s value added and intermediate inputs to capture inter-industry linkages. These industry outputs are then bundled together into consumption goods that consumers purchase.
- Consumption
Consumer behavior is modeled through use of an OLG framework that includes 55 generational cohorts (representing adults aged 21 to 75). Thus, in any one year, the model includes a representative individual optimizing lifetime consumption and savings decisions for each cohort aged 21 through 75 (i.e., 55 representative individuals) with perfect foresight. The model also distinguishes between two types of representative individuals: those that have access to capital markets (savers) and those that do not (non-savers or rule-of-thumb agents).
Non-savers and savers face different optimization problems over different time horizons. Each period non-savers must choose the amount of labor they supply and the amount of goods they consume. Savers face the same tradeoffs in a given period, but they must also choose between consuming today with consuming in the future (i.e., saving). The model assumes 50% of US households are permanently non-savers and 50% are permanently savers across all age cohorts.
The utility of representative individuals is modeled as a CES function, allocating a composite commodity consisting of consumption goods and leisure over their lifetimes. Representative individuals optimize their lifetime utility through their decisions of how much to consume, save, and work in each period subject to their preferences, access to capital markets, and the after-tax returns from work and savings in each period. Representative individuals respond to the after-tax return to labor, as well as their overall income levels, in determining how much to work and thereby earn income that is used to purchase consumption goods or to consume leisure by not working. In this model the endowment of human capital changes with age — growing early in life and declining later in life — following the estimate of Altig et al. (2001).[2]
- Government
The model includes a simple characterization of both federal and state and local governments. Government spending is assumed to be used for either: (1) transfer payments to representative individuals, or (2) the provision of public goods. Transfer payments are assumed to be either Social Security payments or other transfer payments. Social Security payments are calculated in the model based on the 35 years in which a representative individual earns the most labor income. Other transfer payments are distributed on a per capita basis. Public goods are assumed to be provided by the government in fixed quantities through the purchase of industry outputs as specified in a Leontief function.
Government spending in the model can be financed by collecting taxes or borrowing. Borrowing, however, cannot continue indefinitely in this model. Eventually, the debt-to-GDP ratio must stabilize so that the government’s fiscal policy is sustainable. The model allows government transfers, government provision of public goods, or government tax policy to be used to achieve a selected debt-to-GDP ratio after a selected number of years. This selected debt-to-GDP ratio could be, for example, the initial debt-to-GDP ratio or the debt-to-GDP ratio a selected number of years after policy enactment. The baseline of the model is calibrated such that federal revenue as a share of GDP, federal spending on Social Security as a share of GDP, and the federal debt-to-GDP ratio matches the Congressional Budget Office’s The 2019 Long-Term Budget Outlook.[3]
- Modeling the United States as a large open economy
The model is an open economy model that includes both capital and trade flows between the United States and the rest of the world. International capital flows are modeled through the constant portfolio elasticity approach of Gravelle and Smetters (2006).[4] This approach assumes that international capital flows are responsive to the difference in after-tax rates of return in the United States and the rest of the world through a constant portfolio elasticity expression. Trade is modeled through use of the Armington assumption, wherein products made in the United States versus the rest of the world are imperfect substitutes.
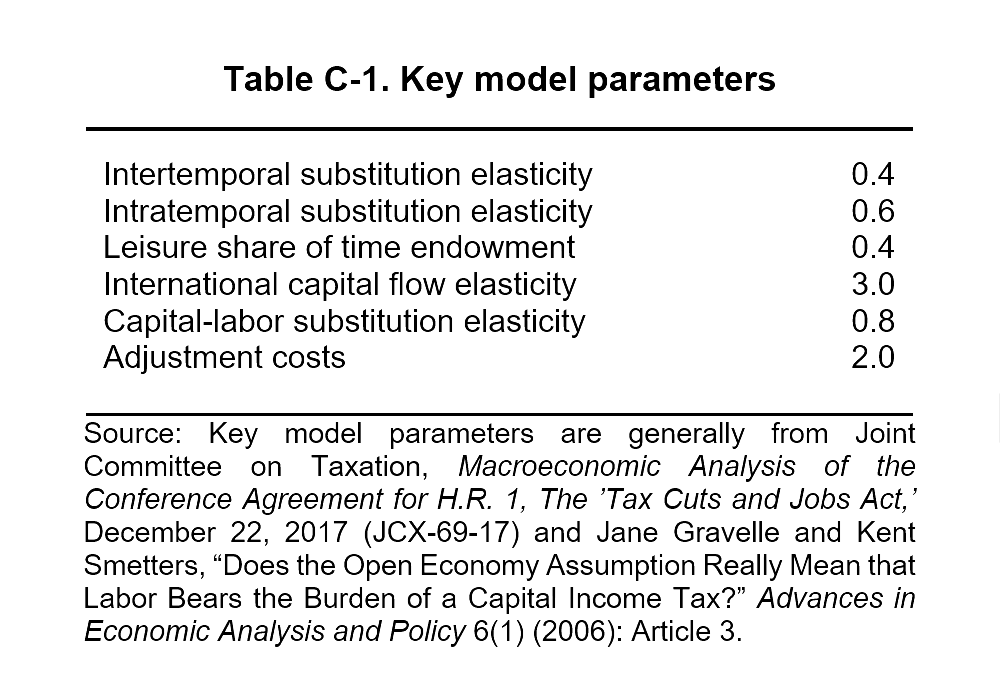
Key model parameters are displayed in Table C-1.
 Modeling the FairTax
Before estimating the macroeconomic impacts, there are four basic steps to modeling the FairTax: 1) defining the tax base, 2) estimating non-compliance, 3) estimating the cost of the FCA, and 4) estimating the budget neutral rates.
- Tax base of the FairTax
The tax base of the FairTax would generally include all goods and services purchased for consumption. All personal consumption expenditures would be included with relatively few exceptions. The definition of the tax base is displayed in Table C-2. As a general approach, the tax base captures sales of consumption items (i.e., good and services) to households, and, as discussed below, governments. One exception is the exclusion of education and job training, which are viewed as investment.[5] Sales between businesses and sales between households would be excluded. This analysis follows the tax base as defined in H.R. 25.
Treatment of government consumption
An important aspect of the FairTax is its treatment of government. The FairTax explicitly includes government consumption (federal, state, and local) in the tax base. Based on the National Income and Products Accounts (and displayed in Table C-2), including government consumption would significantly expand the tax base of the FairTax. In 2021, federal, state, and local government consumption was $2.4 trillion, which comprises approximately 10% of gross domestic product (GDP) and approximately 14% of the FairTax tax base.[6] The treatment of government consumption under the FairTax generally has the effect of assuming that the real size of the government falls by the amount of the tax.[7]
However, if the real size of the government is held constant, as shown by Gale (2005), taxing government consumption would not, on net, raise revenue.[8] Gale also finds that the revenue neutral tax rate does not depend on whether the existing taxes (i.e., individual and corporate income taxes, payroll taxes, and the estate and gift taxes) replaced with a transaction-based sales tax result in higher consumer prices. The intuition behind these results is that adding government consumption to the tax base raises the government’s spending needs by exactly the same amount as it raises in revenue. The implication is that, as long as the real size of the government is held constant, the resources the government needs to claim to maintain its activities is unaffected by whether government consumption is included in the tax base.
To assess the impact of the tax treatment of government under the FairTax, this analysis estimates the macroeconomic impacts at specified by H.R. 25. The reduction in the real size of government is measured by the additional revenue that would need to be raised to keep the real size of government constant evaluated at the FairTax’s 23% tax-inclusive rate. This analysis also estimates the macroeconomic impacts where the real size of the federal government is held constant. In addition, this analysis presents estimates whereby government consumption is assumed to add to the productive capacity of the US economy, as well as estimates where it does not. This contrast is important to better understand the potential impact of a contraction in the real size of government on the US economy.
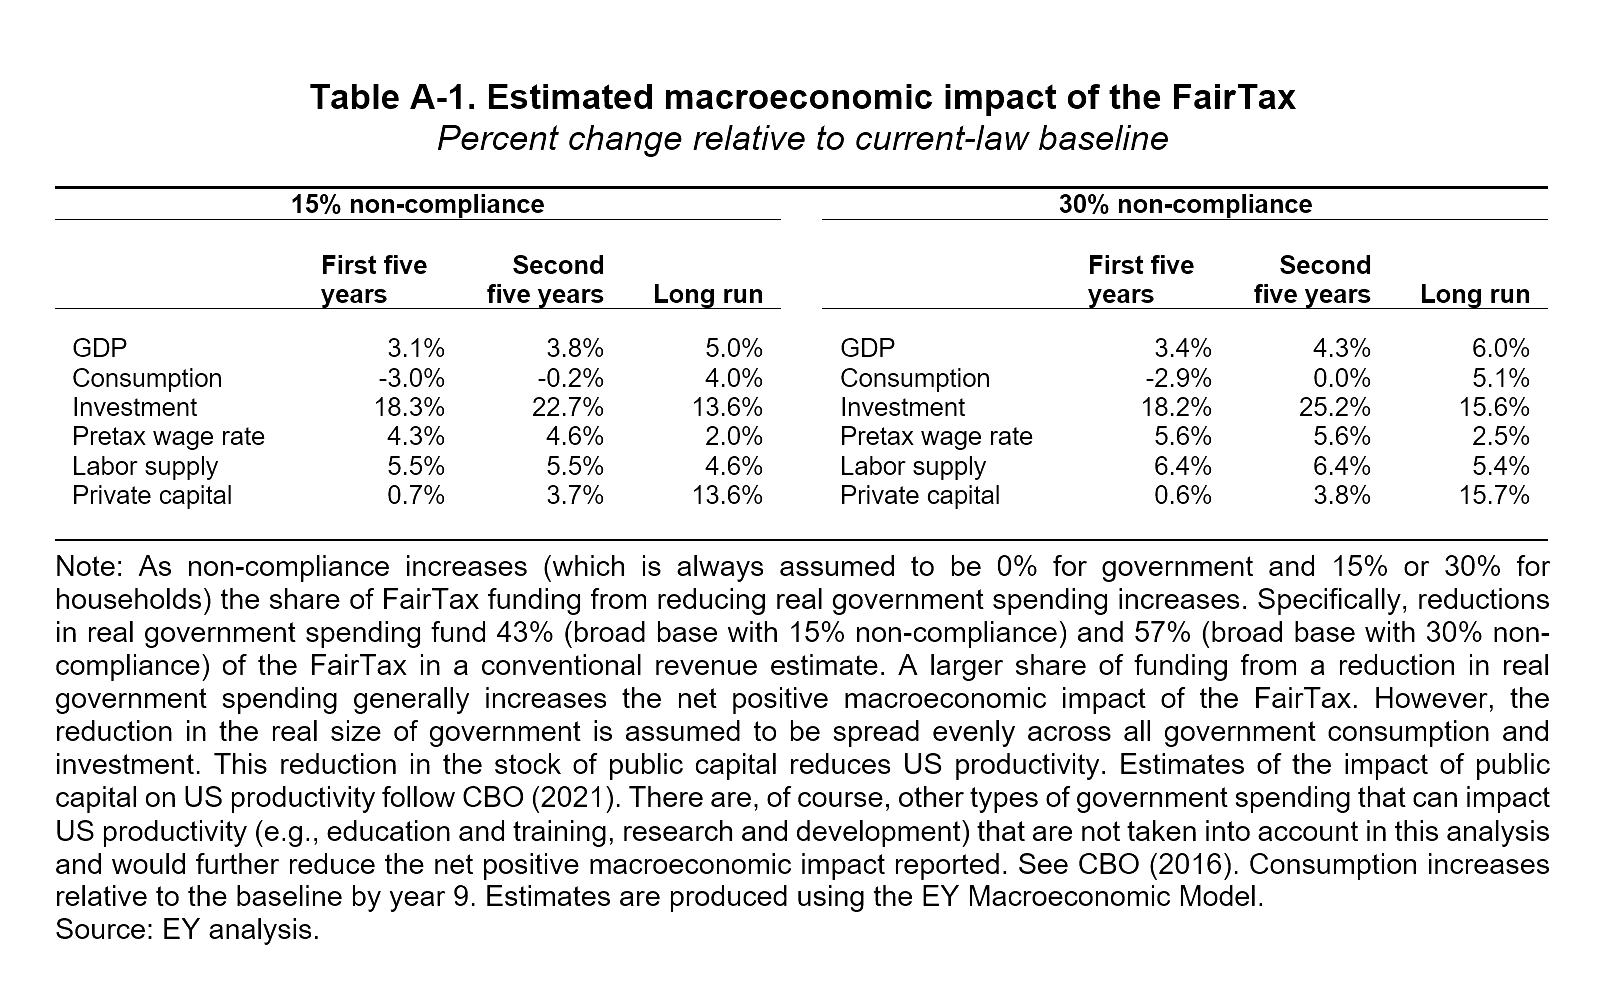
In a highly stylized approach, this analysis attempts to capture the productivity impact of a reduction in the real size of government through a reduction in real spending on public infrastructure. In particular, the reduction in the real size of government is assumed to be spread evenly across all government consumption and investment. This reduction in the stock of public capital reduces US productivity.[9] Estimates of the impact of public capital on US productivity follow CBO (2021). There are, of course, other types of government spending that can impact US productivity (e.g., education and training, research and development) that are not taken into account in this analysis but would further reduce the net positive macroeconomic impact reported.[10] Of course, the composition of government spending after the significant real reduction in total government expenditures from the FairTax is highly uncertain.
Narrow-based sales tax
This analysis also considers a narrow-based sales tax. While, in principle, consumption taxes, such as the FairTax should include all consumption expenditures, in practice, consumption taxes, whether state and local sales taxes or the value-added taxes (VATs) imposed in most other countries are seldom applied to such a broad base even in the presence of low-income subsidies.
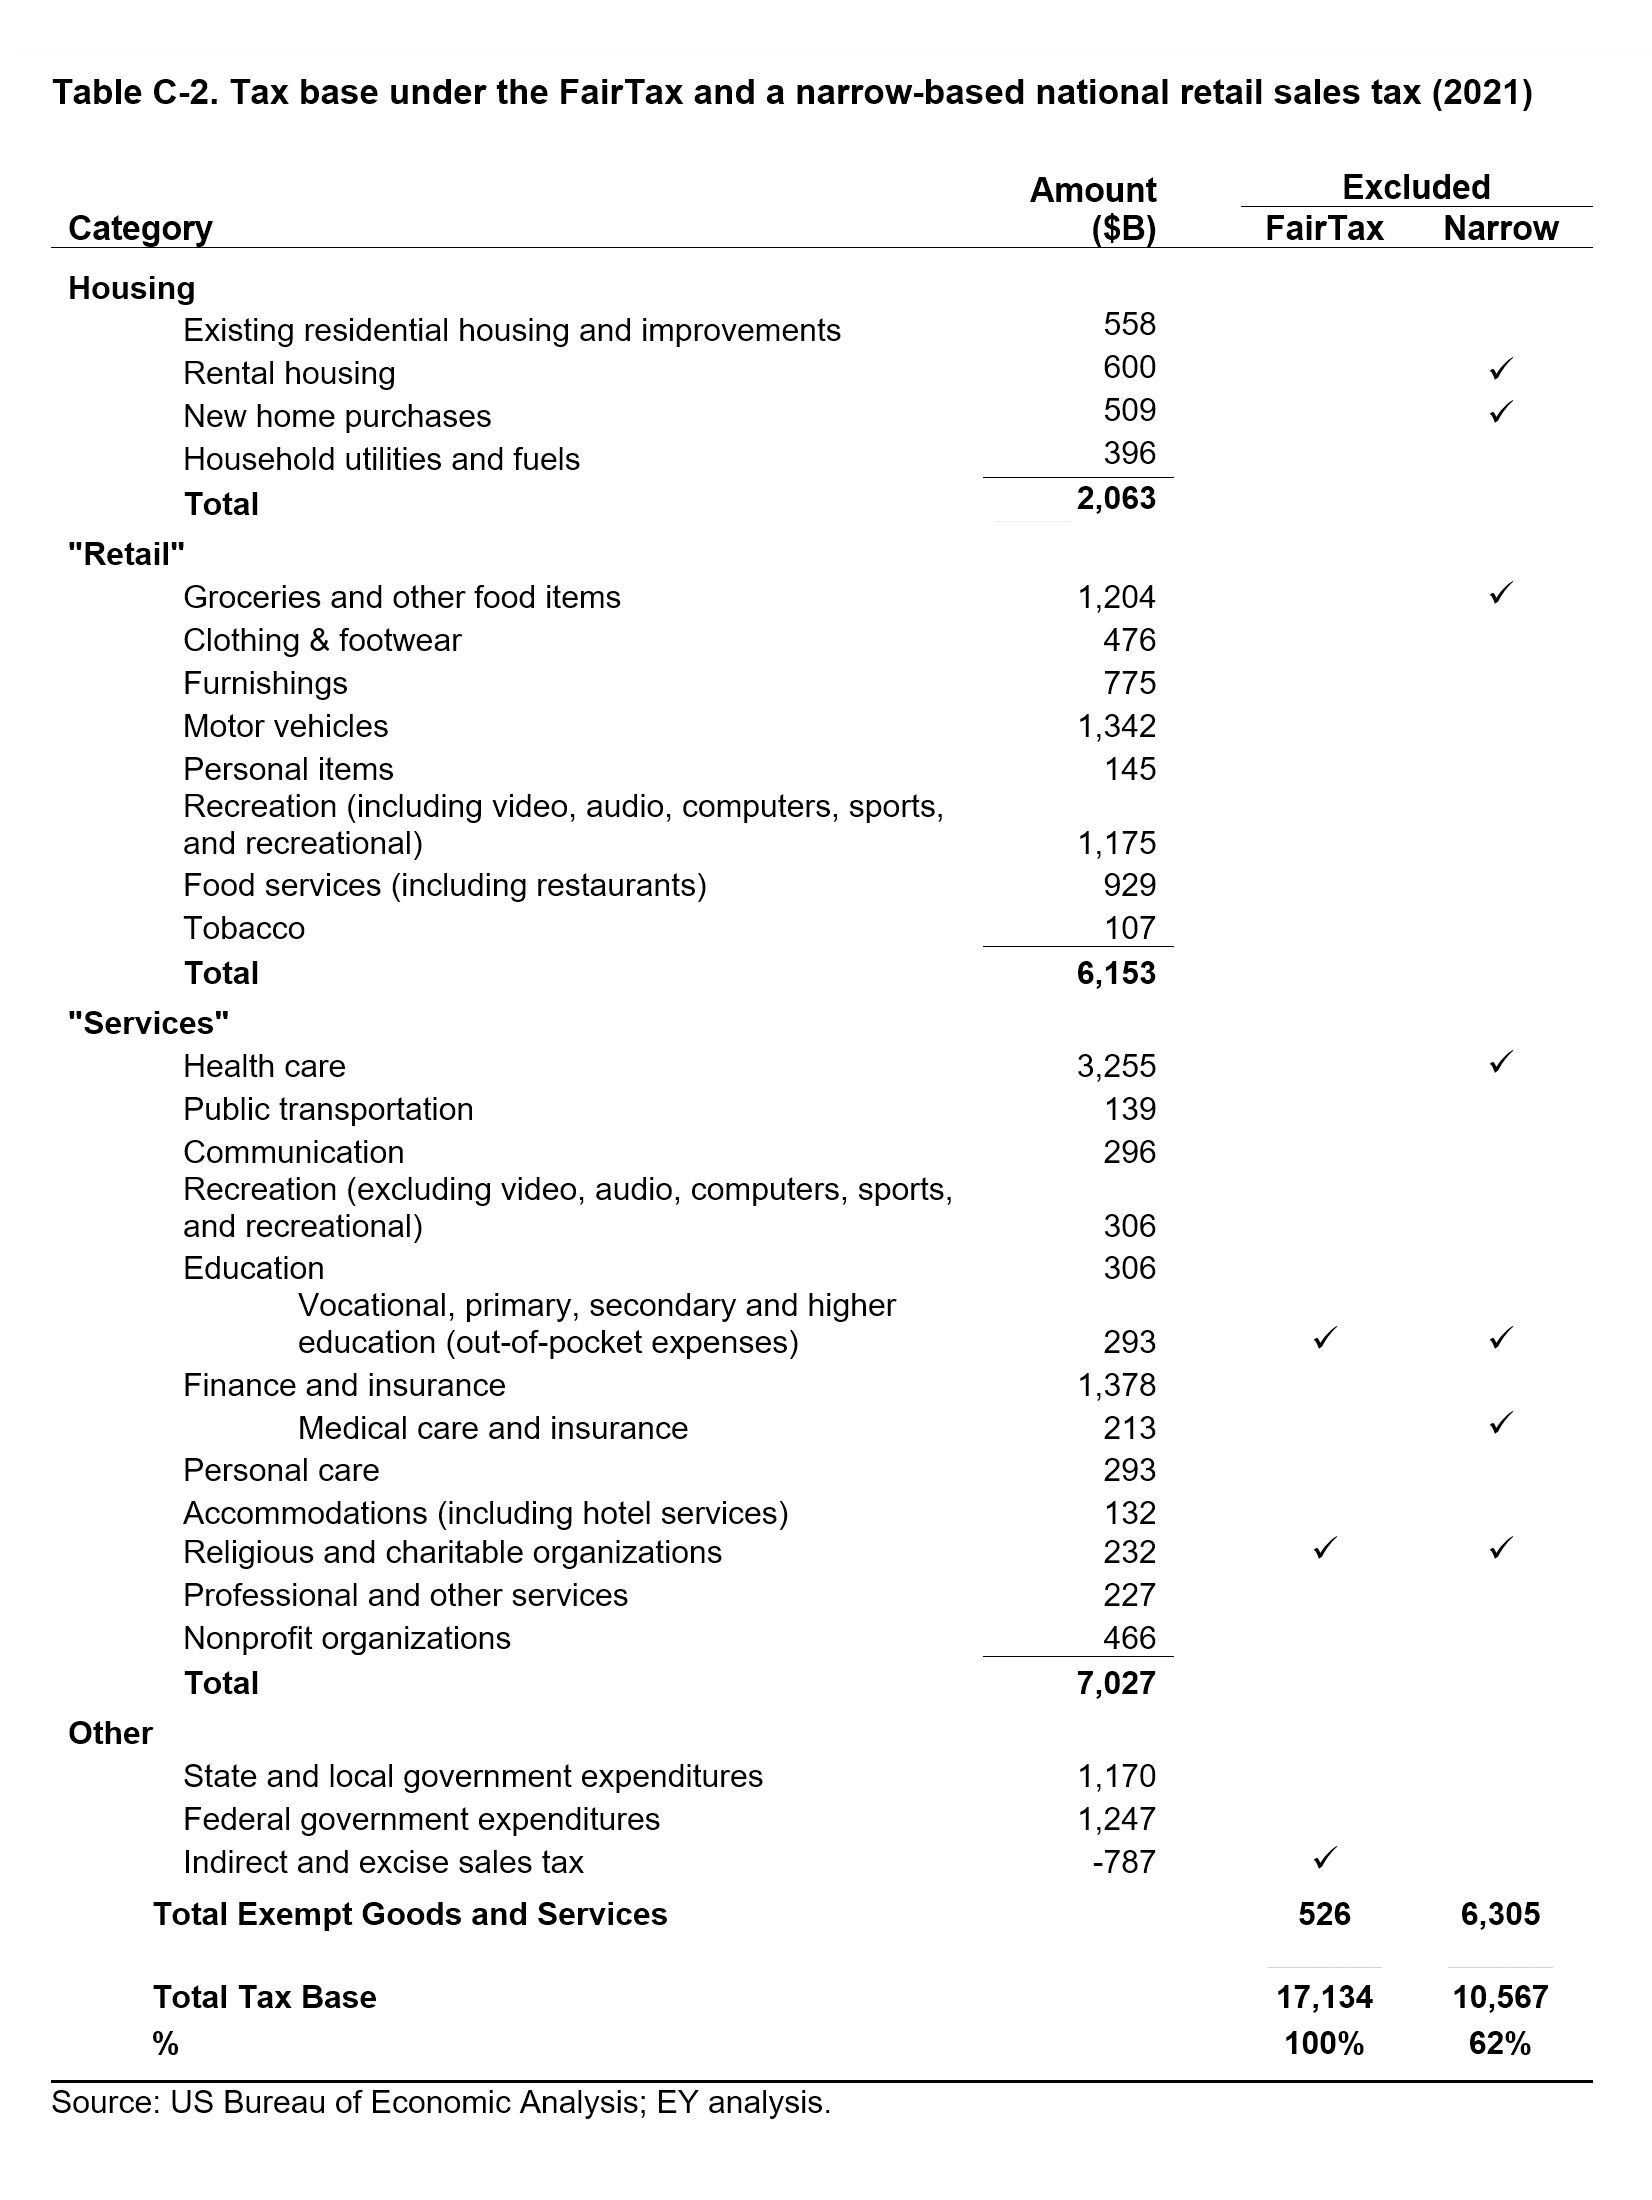 Consumption items, such as food consumed at home, education, or health care services are often excluded from state and local sales taxes or VATs to reduce the tax burden on low-income households or for social reasons. Most states exempt prescription drugs, most medical and education services, as well as most housing services. Many also exempt food for home consumption or tax it at a lower preferential rate. Standard VAT exemptions among OECD countries, for example, include health care, education, and financial services. One study estimated that only 21% of personal consumption expenditures were subject to state and local sales taxes.[11] As displayed in Table C-2, the narrow base used for this analysis is estimated to be 62% of the FairTax base.
- Non-compliance under a national retail sales tax
The federal tax system has a rate of compliance of roughly 85%.[12] Compliance tends to be very high when tax is withheld and reported to the government. Information reporting of various types also help improve compliance. The rate of compliance varies widely depending on withholding and reporting requirements. For the individual income tax, for example, items that are subject to substantial information reporting, such as wages and salaries, have a compliance rate of roughly 99%, while items that are subject to little or no information reporting, such as farm income, proprietor income, and rents and royalties, have a rate of compliance below 50%.
Unlike the current federal tax system which is imposed on and collected in some form from most households and business, the FairTax, similar to state and local sales taxes, would largely be collected only from those businesses that sell final goods and services to consumers.
Although state and local sales taxes might be similar in form to the FairTax and could potentially serve as a guide for expected compliance, the tax rate under the FairTax would be multiples of the 7% to 8% average state and local tax rate. Nevertheless, some research suggests that non-compliance of state sales and use taxes has been between roughly 5% to 20%.[13] [14]
The VATs in other countries also do not provide a useful guide because their structure has built-in self-compliance because a taxpayer only receives a credit for tax previously paid if such tax is reported, a feature absent from sales taxes, and VATs are typically not imposed at rates above 20%, well below the FairTax’s tax rate.
This analysis evaluates the FairTax assuming two rates of non-compliance: 15% and 30%.[15] The 15% non-compliance rate is similar to the experience with the current federal tax system. The 30% reflects the likely significant compliance challenges that could be faced by a national retail sales tax at the rate proposed in H.R. 25 or estimated below. These two rates of non-compliance correspond to what the 2005 President’s Advisory Panel on Federal Tax Reform used in its analysis of the FairTax. The non-compliance rate for government consumption is assumed to be 0%.
- Cost of the Family Consumption Allowance (FCA)
As described above, the FCA rebates to all families the tax paid at the poverty level under the FairTax tax rate.[16] This analysis uses the official 2022 poverty levels by family size published by the Department of Health and Human Services. The poverty levels are adjusted for inflation over the 10-year budget window using the CBO’s inflation forecast. The poverty levels are then multiplied by the tax-inclusive tax rate, as specified by H.R.25, and the number of families (by size) as reported by the US Census Bureau in each year.[17] As an illustration, the FCA under the 23% tax-inclusive rate specified by H.R. 25 is estimated to cost $19.7 trillion over the 10-year budget window. The FairTax rate is about 4 percentage points higher than otherwise to cover the cost of the FCA. The cost of the FCA reflected in the macroeconomic modeling is dependent on the revenue neutral rates presented below.
- FairTax revenue and revenue or “government spending” neutral tax rates
This analysis estimates the revenue shortfall under the FairTax’s 23% tax-inclusive rate after covering the revenue from the existing federal individual and corporate income taxes, payroll taxes, and the estate and gift taxes. Current revenue is from the Congressional Budget Office’s current law baseline over the 10-year budget window from 2025 through 2034, which totals $58.9 trillion (or 17% of GDP over the 10-years). The calculations include the cost of the FCA and, depending on the scenario, non-compliance at rates of 0%, 15%, or 30% applied to nongovernment consumption.
The FairTax would result in a reduction in the real size of government measured by the revenue shortfall at its standard rate. This analysis reports the average annual revenue shortfall over the 10-year budget window assuming non-compliance at rates of 0%, 15%, and 30%. The analysis also reports revenue or “spending neutral” tax rates where the real size of the federal government is held constant. These rates are calculated under both the FairTax base and a narrow-tax base with the adjustments as described above. Both tax-inclusive and tax-exclusive rates are reported.
Caveats and limitations
Any modeling effort is only an approximate depiction of the economic forces it seeks to represent, and the economic model developed for this analysis is no exception. Although various limitations and caveats might be listed, several are particularly noteworthy. These caveats and limitations are both additions to and re-emphasis of those covered in the description of our modeling of the FairTax:
- Estimated macroeconomic impacts based on stylized depiction of US economy. The general equilibrium model used for this analysis is, by its very nature, a stylized depiction of the US economy. As such, it cannot capture all of the detail of the US economy, the existing US tax system, or the FairTax.
- Estimated macroeconomic impacts presented under two different non-compliance assumptions. This analysis presents estimates based on two different assumptions on non-compliance: 15% and 30%. The 15% is generally reflective of non-compliance under the current federal tax system and perhaps consistent with some of the experience with state sales and use taxes, at least before the Wayfair decision. The high tax rates under the FairTax are likely to put significant pressure on compliance. This analysis makes no judgement regarding what level of non-compliance is likely under the FairTax, but instead presents the range of estimates to indicate how the macroeconomic impacts vary under each.
- Estimated macroeconomic impacts limited by calibration. This model is calibrated to represent the US economy and then forecast forward. However, because any particular year may reflect unique events and also may not represent the economy in the future, no particular baseline year is completely generalizable.
- Estimates are limited by available public information. The analysis relies on information reported by government agencies (primarily the Bureau of Economic Analysis and Internal Revenue Service). The analysis did not attempt to verify or validate this information using sources other than those described in this appendix.
- Estimates do not reflect OECD BEPS Pillar Two. If the United States were to enact the FairTax, US companies would pay no federal corporate income tax on their domestic operations. Under Pillar Two’s Undertaxed Profits Rule (UTPR), any such US company with a foreign affiliate would still owe income tax on its US operations, but payable to one or more foreign governments and calculated using the Global Anti-Base Erosion (GloBE) base and a 15% rate. This analysis makes no attempt to reflect Pillar Two in the estimates.
- Full employment model. This analysis’ model, like many general equilibrium models, focuses on the long-run growth effects of policy changes and thus relies on a full employment assumption (i.e., there is no involuntary unemployment). Any increase in labor supply is a voluntary response to a change in income or the return to labor that makes households choose to substitute between consumption and leisure. To provide a high-level measure of the potential employment impacts, a job-equivalents measure has been included in this analysis’ results. Job-equivalent impacts are defined as the change in total labor income divided by the baseline average labor income per job.[18]
- State policies are not modeled. The simulations do not account for interactions with or potential changes in state policies. The FairTax proposal envisions at least some potential coordination of state sales and use taxes with the national retail sales tax with commensurate administrative and compliance benefits. However, the repeal of the federal individual and corporate incomes taxes, payroll taxes, and the estate and gift tax, may impact the administration of and compliance with similar state level taxes.
- Estimates do not reflect OECD BEPS Pillar Two. If the United States were to enact the FairTax, US companies would pay no federal corporate income tax on their domestic operations. Under Pillar Two’s Undertaxed Profits Rule (UTPR), any such US company with one or more foreign affiliates may owe additional income tax on its US operations, payable to one or more foreign governments and calculated using the Global Anti-Base Erosion (GloBE) base and a 15% rate. This analysis makes no attempt to reflect Pillar Two in the estimates.
Endnotes
[1] See, for example, Shinichi Nishiyama, “Fiscal Policy Effects in a Heterogeneous-Agent Overlapping-Generations Economy With an Aging Population,” Congressional Budget Office, Working Paper 2013-07, December 2013; Joint Committee on Taxation (JCT), Macroeconomic Analysis of the ‘Tax Reform Act of 2014,’ February 2014 (JCX-22-14); JCT, Macroeconomic Analysis of Various Proposals to Provide $500 Billion in Tax Relief, March 2005 (JCX-4-05); and, US Department of the Treasury, The President’s Advisory Panel on Federal Tax Reform, Simple, Fair, & Pro-Growth: Proposals to Fix America’s Tax System, November 2005.
[2] See David Altig, Alan Auerbach, Laurence Koltikoff, Kent Smetters, and Jan Walliser, “Simulating Fundamental Tax Reform in the United States,” American Economic Review 91(3) (2001): 574-595.
[3] See Congressional Budget Office, The 2019 Long-Term Budget Outlook, June 2019.
[4] See Jane Gravelle and Kent Smetters, “Does the Open Economy Assumption Really Mean That Labor Bears the Burden of a Capital Income Tax?” Advances in Economic Analysis and Policy 6(1) (2006): Article 3.
[5] Food produced and consumed on farms would be excluded for administrative reasons. The sale of newly constructed homes occupied by the purchaser would be included in the tax base, while existing housing (a sale between households) and rental housing (a sale between businesses) are not. The imputed value of financial intermediation services would be included (measured as average account balances multiplied by the difference between the interest rate earned on the account and a benchmark Treasury rate). Consistent with consumption taxes including domestic consumption, foreign purchases by US residents would be excluded and domestic purchases by foreigners would be included.
[6] The percentages do not reflect non-compliance.
[7] As explained in Gale (2005), this result holds if producer prices and wages are constant and consumer prices rise by the amount of the tax. The result is somewhat different if consumer prices are constant and producer prices and wages fall by the amount of the tax. In this case, government spending need not change in nominal terms, but the revenue base would fall below its level before the FairTax was imposed. The conclusion, however, is the same as if consumer prices rise – no net revenue is collected from the government and the revenue neutral tax rate that holds the real size of government constant (i.e., real purchasing power) would be the same regardless of whether government is included in the tax base. See William Gale, “The National Retail Sales Tax: What Would the Rate Have to Be?” Tax Notes, May 16, 2005, pp. 889-911.
[8] Ibid.
[9] Estimates of the impact of public capital on US productivity follow: Congressional Budget Office, Effects of Physical Infrastructure Spending on the Economy and the Budget Under Two Illustrative Scenarios, August 2021.
[10] Congressional Budget Office, The Macroeconomic and Budgetary Effects of Federal Investment, June 2016.
[11] Andrew Phillips and Muath Ibaid, “The Impact of Imposing Sales Taxes on Business Inputs,” prepared for the State Tax Research Institute and Council On State Taxation, Ernst & Young LLP, May 2019.
[12] Internal Revenue Service, Research, Applied Analytics & Statistics, “Federal Tax Compliance Research: Tax Gap Estimates for Tax Years 2014-2016,” Publication 1415 (Rev. 08-2022), August 2022.
[13] Cary Christian and Steven Purcell, “Leveraging Big Data Analytics and AI to Combat the Sales Tax Gap,” State Tax Notes, Vol. 106, December 12, 2022, pp. 963-965.
[14] The Supreme Court’s decision in South Dakota v. Wayfair, Inc (the Wayfair decision) has prompted states to enact rules that define nexus (i.e., what establishes a sales and use tax obligation). State adoption of Wayfair laws requiring remote sellers to collect and pay sales taxes based on transactions that occur in their jurisdictions and related rules are expected to, over time, significantly improve compliance of state sales and use taxes.
[15] Some of the FairTax revenue and revenue and “spending” neutral rates are also calculated with 0% non-compliance for comparison purposes.
[16] The calculation for the FCA is the official poverty level multiplied by the tax rate, where the poverty level varies by family size. There is also an adjustment included to eliminate the marriage penalty.
[17] As an example, in 2025 the FCA for a married couple with two children would be $10,270. The poverty level for this family is estimated to be $33,960 in 2025. The marriage penalty adjustment would be $10,690.
[18] Because job-equivalents are defined as total labor income divided by the baseline average labor income per job, the change in job-equivalents may or may not be in the same direction as the change in labor supply. This is because total labor income depends on both the labor supply and the wage rate paid to that labor. The job-equivalents measure has also been used, for example, by the Congressional Budget Office. See, for example, Edward Harris and Shannon Mok, “How CBO Estimates the Effects of the Affordable Care Act on the Labor Market,” Congressional Budget Office, Working Paper 2015-09, December 2015.

