Research
July 31, 2019
Health and Economy Baseline Estimates
![]()
The following report details the most recent updates to the H&E baseline estimates of insurance coverage, federal budgetary impact, plan choice, and the premium landscape of health insurance for Americans under the age of 65. The Center for Health and Economy (H&E) is dedicated to assessing the impact of proposed reforms that attempt to address these issues.
KEY FINDINGS:
- It is estimated that the individual market includes 14 million members in 2019, with 9 million lives covered through subsidized insurance offered in the Health Insurance Marketplace. The total size of the individual market is estimated to decline throughout the budget window—sinking to 10 million in 2028.
- As premiums and health care costs rise, plans chosen in the individual market are expected to shift toward lower-cost options. Highly subsidized enrollment in Silver plans is projected to fade as a percentage of enrollment on the individual market, while enrollment in Catastrophic and Bronze plans grows among both subsidized and unsubsidized consumers. Catastrophic plan enrollment is expected to grow especially as the individual mandate penalty is set to zero beginning in 2019 and Short-Term Limited Duration Insurance (STLDI) plans become more available.
- The health insurance coverage provisions under current law for the non-elderly are estimated to increase federal outlays by $5.18 trillion.
INSURANCE COVERAGE
H&E estimates there will be 246 million non-elderly U.S. residents with health insurance in 2019—90 percent of the total non-elderly population. Estimates of health insurance coverage encompass four primary categories: the individual market, employer-sponsored insurance, Medicaid, and other public insurance. The individual market is divided into two subsets: subsidized and unsubsidized coverage. Subsidized coverage is purchased through the Health Insurance Marketplace, and unsubsidized coverage is comprised of similar insurance plans purchased either directly from the insurer (represented in Other Non-Group Insurance) or through the Marketplace without financial assistance. Included in this category of insurance are STLDI plans that were expanded beginning in 2019. In this analysis, STLDIs are included in Catastrophic coverage.[1] H&E makes no distinction between unsubsidized enrollees through the Marketplace and households that purchase individual market insurance directly from an insurer. Estimates concerning Medicaid also include beneficiaries of the Children’s Health Insurance Program.
Other public insurance is primarily comprised of Medicare coverage for disabled persons, but also includes Tricare, the Indian Health Service, and other federal health care programs for specific populations.
H&E does not make any assumptions about future state take-up of the Medicaid expansion due to the many variables involved in projecting the magnitude of the effects of potential future expansions. Because of this uncertainty, the Medicaid enrollment and spending reflected in this baseline only reflect the projected costs and enrollment of the Medicaid program if it were to remain as it currently is.By 2022, the number of uninsured, non-elderly Americans is projected to increase to 29 million—11 percent of the total non-elderly population. The decrease in insured Americans is primarily the result of premium increases outpacing wage increases. The average population of non-elderly Medicaid beneficiaries is estimated to be 68 million in 2019 and will rise to 69 million by 2029.[2] These estimates are subject to the uncertainty of each state’s decision regarding Medicaid expansion.[3]
The individual market is estimated to decline from 14 million covered lives in 2019 to 10 million in 2029, driven by premium increases in the Marketplace. The decrease in coverage through the individual market is partially offset by an increase in those insured through Medicaid.
PREMIUMS
Estimates of the subsidy-eligible premiums available in the Marketplace are calculated using publicly available data on plans offered in the 36 Federally Facilitated Marketplaces. Premium estimates for unsubsidized health insurance are calculated from a sample of plans available through the Robert Wood Johnson Foundation.[4] In both cases, H&E uses the default age rating curve put forth by the Department of Health and Human Services and by individual states to calculate the applicable premium for a household. For simplification and comparability, H&E uses a standard family size of four (two adults and two children) when estimating family premiums. Subsidy payments and tax revenue are adjusted for the appropriate average family size in budget impact estimates.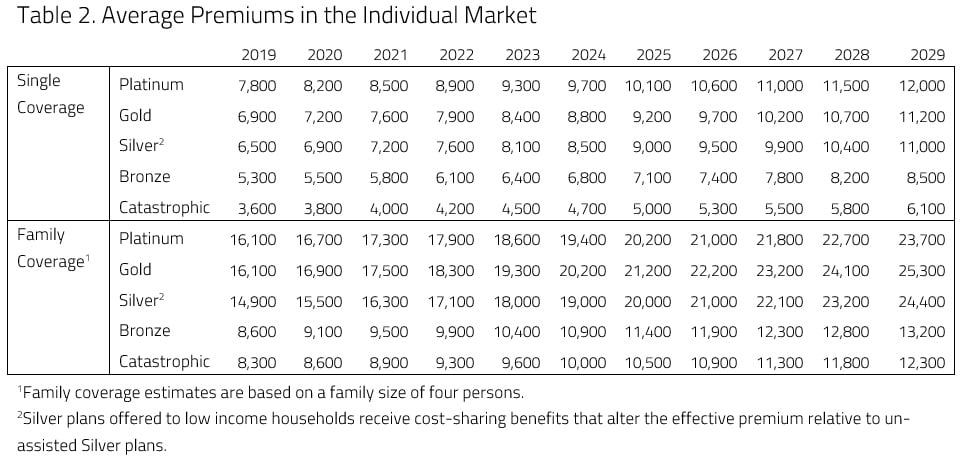
Eligible households may purchase subsidized coverage for a specified percentage of household income that ranges from 2.01 to 9.56 percent in 2019, depending on income. A federal subsidy pays the remaining portion of the premium that is not covered by the household’s specified income contribution. This specified income contribution is also subject to annual increases if the annual increase in health insurance costs exceeds a measure of average income growth for all households. H&E also projects an additional cost control measure, which prescribes further increases in the income contribution if total subsidy spending exceeds .504 percent of GDP. 2018 was the first year this adjustment became eligible to take effect, although H&E does not project it to take place during the budget window. Subsidized insurance plans offered in the Marketplace are divided into four categories— Platinum, Gold, Silver, and Bronze—that correspond to four approximate actuarial values—90 percent, 80 percent, 70 percent, and 60 percent. The actuarial value refers to the expected percentage of annual medical expenses covered by the insurance plan.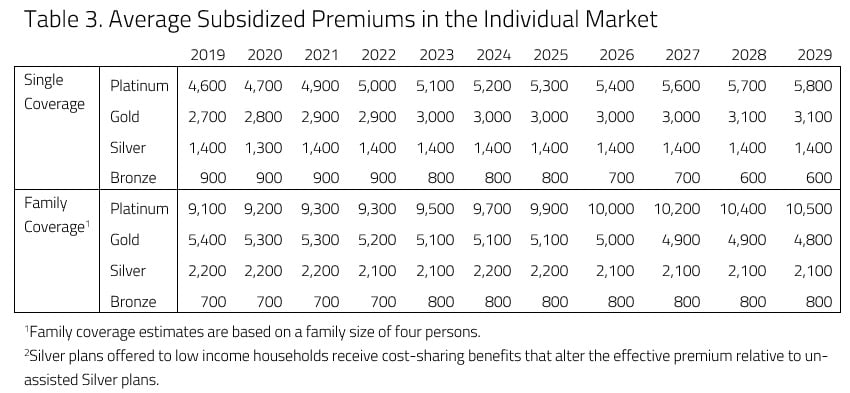
Unsubsidized insurance plans, purchased in the Marketplace or directly from an insurer, are similar in design and price to those eligible for subsidies. The ACA requires that all health insurance plans meet certain requirements to be identified as qualified coverage.It is important to note that, because of additional cost-sharing assistance, the plan designs categorized as Silver vary significantly in actuarial value across different income categories. For enrollees in the marketplace that earn between 100 and 150 percent of the Federal Poverty Level (FPL), Silver plans have an actuarial value of 94 percent, the highest of any plan offered in the Marketplace. For enrollees earning between 150 and 200 percent of FPL, Silver plans have an actuarial value of 87 percent, and for enrollees earning between 200 and 250 percent of FPL, Silver plans have a 73 percent actuarial value. H&E estimates the unsubsidized premiums for these high-value Silver plans using the true actuarial value of the plan, rather than the Silver plan price.
PLAN CHOICE
H&E assumes an underlying health insurance cost growth of 5 percent throughout the 10-year window based on previous trends and other projections.[5] Actual year-over-year premium growth estimates vary as a result of changes in the enrollment mix and other factors. Due to growing applicable income-contribution rates, subsidized premium growth for some plan designs is expected to exceed the underlying health insurance growth rate.
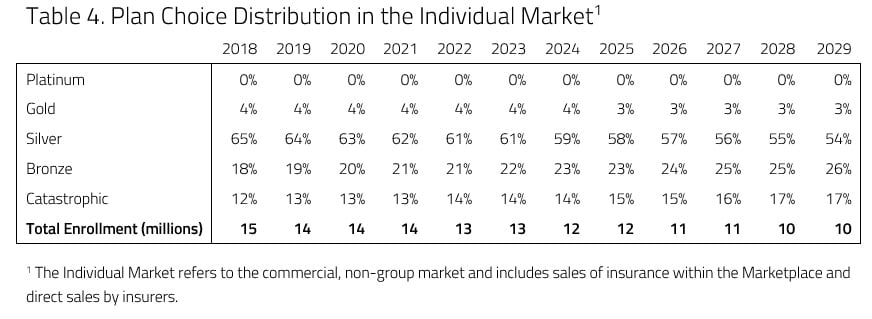
H&E estimates that the large enrollment in Silver plans in 2019 among subsidized insurance plans will give way to higher enrollment in Bronze plans as premiums rise and consumers with less generous subsidy amounts adjust to higher premiums. The large majority of Silver plan enrollment is estimated to be largely comprised of households eligible for extra cost-sharing benefits. As the market grows to include more households that are eligible for premium credits but not cost sharing assistance (earning between 250 and 400 percent of FPL), the distribution of subsidized enrollment among the four metal levels is expected to become less evenly distributed later in the budget window.H&E uses the subsidized and unsubsidized Marketplace enrollment in each metal level after the first year to calibrate plan preferences in the individual market and estimate plan choices throughout the 10-year analysis window.
Two things combine to increase Catastrophic enrollment beginning in the year 2019. First, the mandate penalty was set to $0 beginning in 2019. Second, regulations increasing the availability of STLDIs took effect for the 2019 plan year. Enrollment for Catastrophic plans and STLDIs increase over the budget window as premiums rise and consumers with less-generous subsidies adjust.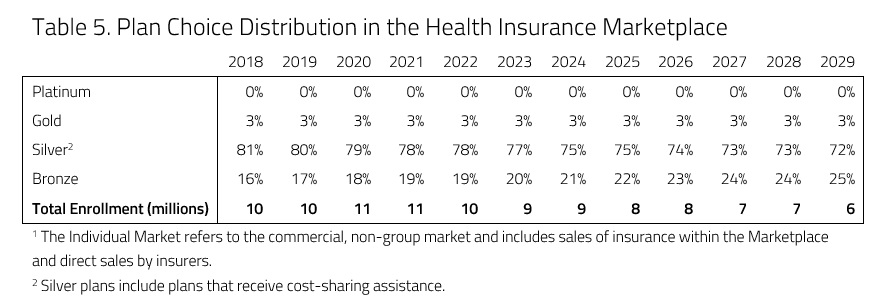
BUDGET
Beyond 2019, lower-cost insurance plans are estimated to gain market share, shifting away from more generous plans in response to the steadily rising cost of health insurance. Throughout the budget window, Silver plan enrollment is expected to dominate the marketplace as cost-sharing benefits are only available for Silver plans in the Health Insurance Marketplace. As time passes and premiums rise, however, enrollment in Bronze plans is expected to increase.
H&E estimates the impact on the federal budget of the major health insurance coverage provisions of current law with regards to the non-elderly population. Budget impact estimates do not include estimates for non-ACA tax expenditures encoded in current law, such as the employer-sponsored health insurance tax expenditure.[6],[7]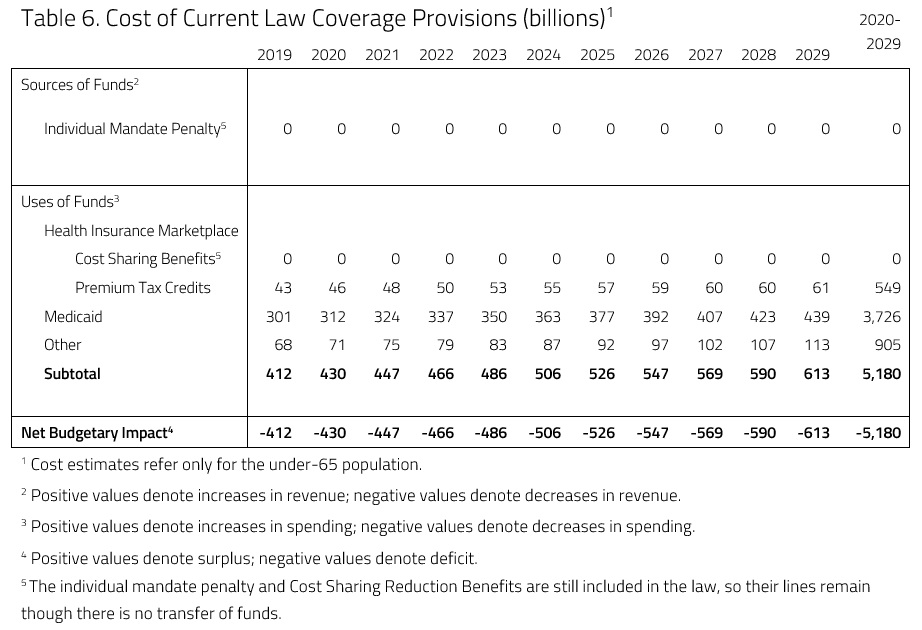
Over the decade spanning between 2020 and 2029, H&E estimates that non-elderly coverage provisions under current law will cost $5.18 trillion. The ACA introduced a number of taxes that are not directly related to the health insurance coverage of the non-elderly population and are therefore not included in this report. Medicaid coverage and expenditure estimates are calculated based on the number of states that had chosen to implement Medicaid expansion by January 1, 2019. These predictions are sensitive to future state-level decisions on expansion as well as new program waivers that alter the design of a state’s Medicaid program.
PRODUCTIVITY AND ACCESS
The Provider Access Index is designed to reflect the availability of primary and specialty physicians and facilities. Plans with large networks, such as Platinum plans offered in the individual market, are ascribed high scores for providing exceptional access. Bronze and other low-cost plans that afford access only to limited networks are ascribed low PAI scores. The index ranges from a low of 1.0 to a high of 5.0.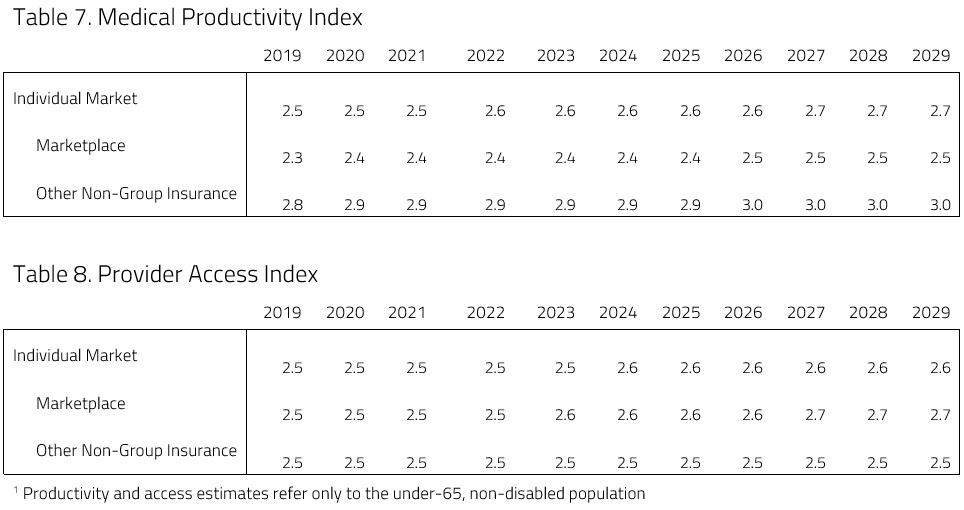
CHANGES FROM PREVIOUS BASELINE ESTIMATES
As an organization, H&E is constantly re-evaluating the assumptions and technical methods that are used to create baseline and proposed estimates of health insurance coverage provisions under current law. This publication is the seventh comprehensive baseline report, and the fifth to include detailed estimates on the net budgetary impact of the ACA and Medicaid for individuals under 65.
For this baseline, H&E updated the under-65 population in the microsimulation model. In previous years, H&E assumed a higher under-65 population. This baseline attempts to reconcile H&E’s estimated under-65 population with trends recorded by the U.S. Census bureau.[8]
UNCERTAINTY IN PROJECTIONS
The Center for Health and Economy uses a peer-reviewed micro-simulation model of the health insurance market to analyze various aspects of the health care system.[9] And as with all economic forecasting, H&E estimates are associated with substantial uncertainty. While the estimates provide good indication on the nation’s health care outlook, there are a wide range of possible scenarios that can result from policy changes, and current assumptions are unlikely to remain accurate over the course of the next 10 years.
[1] For H&E’s analysis of the impact of STLDIs on the individual market see: https://healthandeconomy.org/the-proposed-modifications-to-short-term-limited-duration-insurance-plans/
[2] H&E’s method for estimating Medicaid enrollment was also part of the under-65 model update. As a result, Medicaid enrollment is higher than in previous baselines, accounting for all of the under-65 Medicaid population with the exception of those that are dually eligible for Medicare and Medicaid.
[3] This baseline represents the Medicaid expansion population for states that implemented Medicaid expansion by March 1, 2019.
[4] Accessed at: https://www.hixcompare.org/
[5] Centers for Medicare and Medicaid Services. National Health Expenditure Data. Accessed at: https://www.cms.gov/Research-Statistics-Data-and-Systems/Statistics-Trends-and-Reports/NationalHealthExpendData/
[6] The CBO estimates that the tax exclusion for employer sponsored insurance will cost $3.4 trillion over 10 years. See Distribution of Major Tax Expenditures in the Individual Income Tax System, Congressional Budget Office, May 2013, at: http://www.cbo.gov/sites/default/files/cbofiles/attachments/43768_DistributionTaxExpenditures.pdf
[7] In past baselines, H&E has included various estimates related to the employer sponsored insurance market that included: the excise tax on high cost employer sponsored plans, Medical Productivity in the employer marketplace, and Provider Access in the employer marketplace. These were left out of this baseline due to the update of the under-65 model.
[8]https://www.census.gov/content/dam/Census/library/publications/2018/demo/p60-264.pdf
[9] Parente, S.T., Feldman, R. “Micro-simulation of Private Health Insurance and Medicaid Take-up Following the U.S. Supreme Court Decision Upholding the Affordable Care Act.” Health Services Research. 2013 Apr; 48(2 Pt 2):826-49.