Research
October 8, 2019
Hospital Markets and the Effects of Consolidation
Executive Summary
- Hospital costs account for nearly 40 percent of personal health care expenditures in the United States.
- Despite a decrease in hospital utilization, spending on hospital care grew 32 percent on a per capita basis between 2008 and 2017, and spending is expected to grow 5.7 percent per year, on average, from 2020 to 2027, largely because prices rose 29 percent from 2005 to 2018 and are expected to continue rising.
- Hospital prices are highest in markets with the least competition, and vertical and horizontal hospital consolidation is occurring at a rapid pace, largely fueled by various policies and regulations that provide financial incentives for consolidation—yet the quality of care often declines as consolidation and prices increase.
- Reducing the overall cost of health care in the United States will be difficult without reducing hospital prices.
Hospital Expenditures
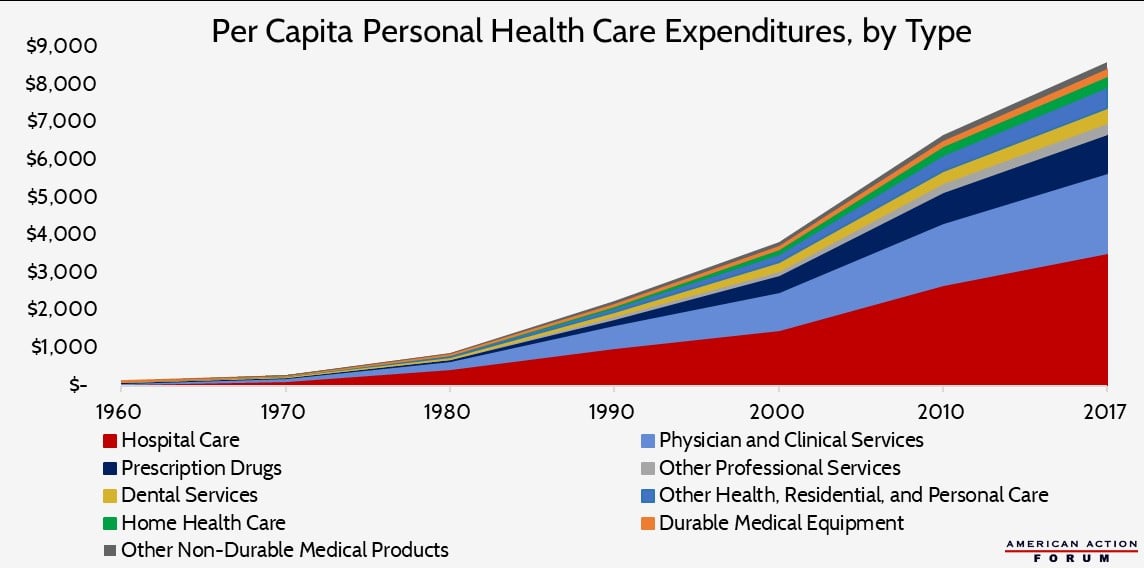
One-third, or $1.1 trillion, of all national health care expenditures in the United States in 2017 was attributable to care provided in hospitals.[1] When narrowed to just personal health care expenditures—those expenses directly tied to treating and preventing disease in an individual person—hospital costs increase to 38.6 percent of expenditures. For comparison, physician services provided outside the hospital and excluding home health care or care provided at nursing facilities accounts for 31 percent of personal health care expenditures (and 26.3 percent of total national health expenditures). For their part, prescription drugs account for 11.3 percent of personal health care expenditures.
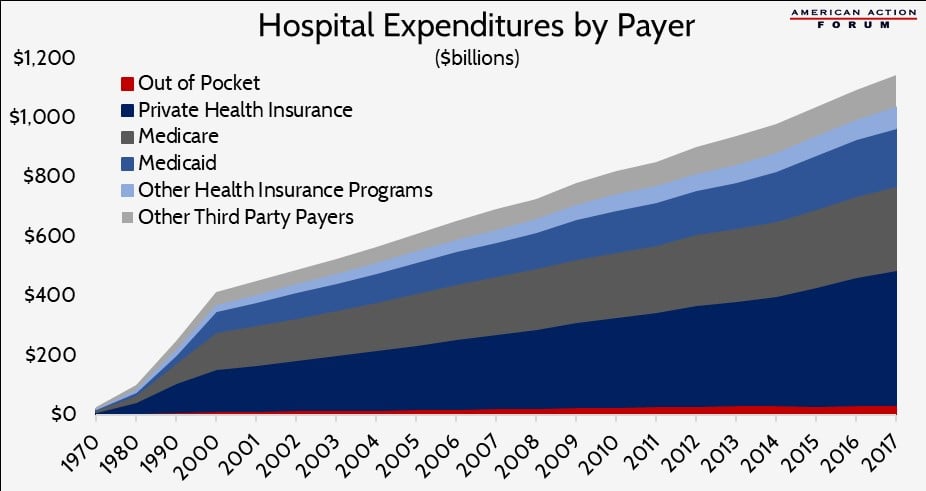
But while total hospital spending was more than $1 trillion, patients paid directly for less than 3 percent of that cost (or $33.9 billion) through out-of-pocket (OOP) expenditures, as shown in the chart below.
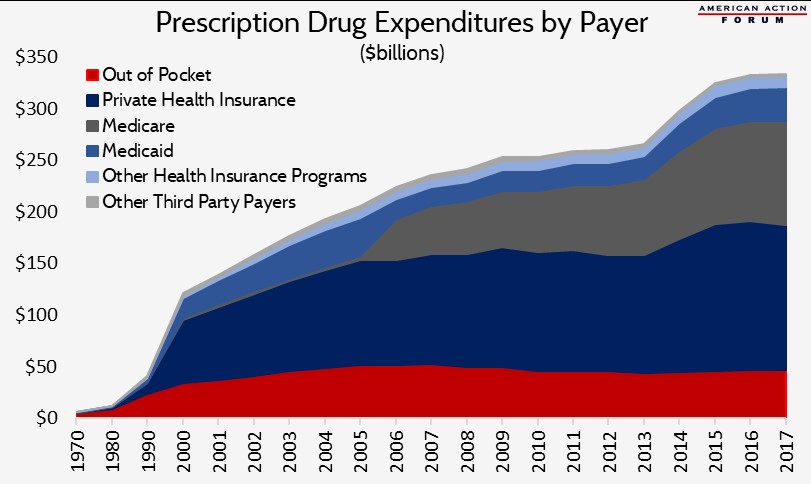
In contrast, prescription drug costs totaled $333.4 billion in 2017, but $46.7 billion (or 14 percent of that cost) was paid by Americans out-of-pocket.[2] In other words, the country spends nearly 450 percent more on hospital care than on prescription drugs, but individual consumers pay 38 percent more out-of-pocket for prescription drugs than for hospital care.
This discrepancy in OOP costs may partially explain why policymakers are devoting so much attention to reducing drug prices rather than hospital costs (aside from surprise billing issues, which are another instance where patients are likely to face rather large OOP expenses). OOP costs are the most direct cost to the patient and are tied directly to the good or service the patient receives. In contrast, an employer typically pays much of the premiums (reflected above in the amounts paid by insurers), and the individuals’ portion is usually deducted from their paycheck, making it less noticeable. Further, enrollees usually do not know how much each care component drives the premium cost. Thus, people have a distorted perception of which aspects of the health care system drive overall costs, and policymakers tend to focus on the issues on which their constituents are focused. (Of course, all this is not to say policymakers can’t address real problems and make worthwhile changes regarding drug pricing.)
How Hospital Spending is Changing
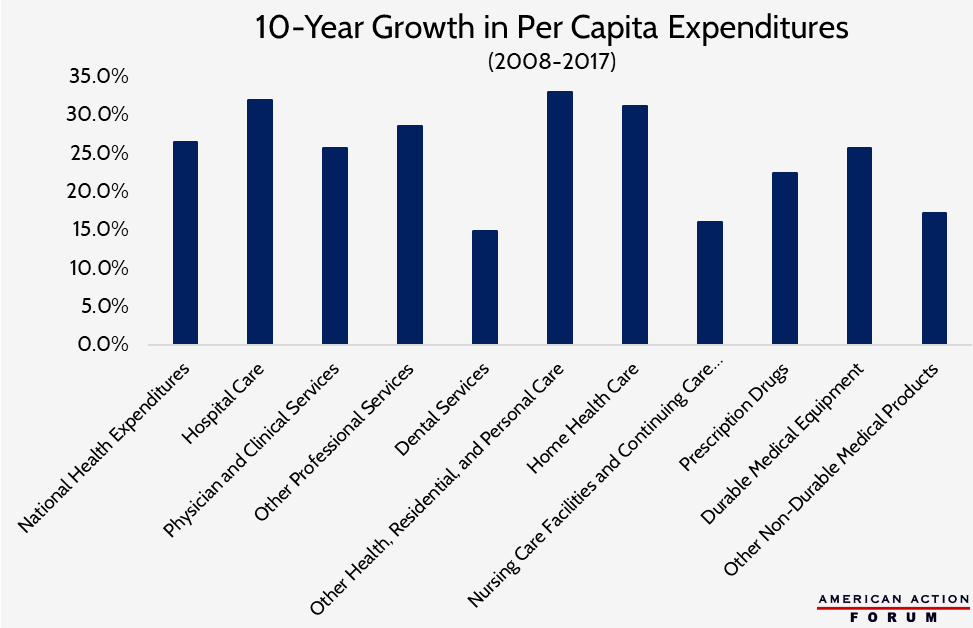
Hospital spending growth is projected to average 5.7 percent per year from 2020 to 2027.[3] This growth is not simply a result of population growth. Between 2008-2017, hospital spending grew 32 percent on a per capita basis, one of the fastest growth rates across all categories of health care, as shown here.
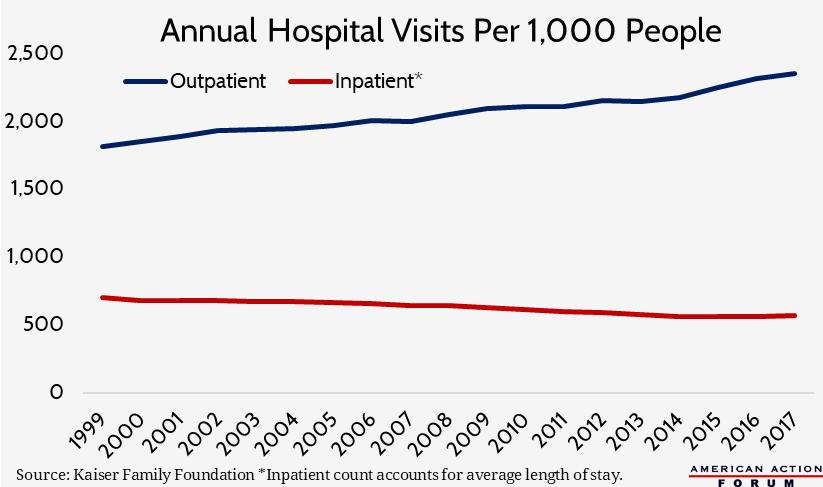
This growth in hospital spending per person is occurring even though the rate at which patients utilize hospital services, particularly more expensive hospital inpatient services, has been declining for years. There are nearly 1,000 fewer hospitals in the United States than in 1981, though most of that decline occurred in the 1980s and 1990s; there are also fewer hospital beds at the remaining hospitals.[4] This decline in capacity appears to mark a recognition that care is moving out of the hospital: Rates of inpatient surgeries have declined more than 40 percent, while outpatient surgeries have increased nearly 400 percent since 1981.[5] When patients are admitted to the hospital, they aren’t staying as long as they used to: The average length of stay is two days shorter now than in 1981.[6] The chart below, based on Kaiser Family Foundation data of inpatient and outpatient visits, illustrates these trends (the inpatient figure accounts for the average length of stay rather than simply the number of persons admitted). Going forward, it is estimated that inpatient visits are expected to decline 2 percent between 2018 and 2027, while outpatient visits (at all sites, not just hospitals) will increase 15 percent.[7]
Advances in medicine and technology are enabling this shift away from hospital inpatient services as well as allowing for shorter average lengths of stay for inpatient procedures.[8] The shift toward outpatient care is largely a response to demands from payers and patients to improve quality and reduce costs. Patients often do not want to spend days in a hospital, and outpatient care is typically much cheaper than inpatient care.
Hospital Prices
As services have shifted toward outpatient care—which is less expensive—hospitals are adjusting their prices, presumably to maintain the revenue at least partially demanded by around-the-clock staffing, substantial overhead costs, and other costs unique to modern hospital infrastructure. In 2013, hospitals’ revenue from outpatient care was equal to 83 percent of its revenue from inpatient care. That ratio increased to 95 percent in 2017 as prices for and utilization of outpatient services rose.[9] Much of the increase is the result of increased prices, rather than utilization: In a single year, 2016-2017, outpatient volume increased 1.2 percent, while hospital outpatient revenue increased 5.7 percent.[10]
Comparing the prices for inpatient and outpatient services illustrates both the inpatient-outpatient dynamic facing hospitals and the high prices they charge. The weighted average submitted charge for an inpatient procedure in 2017 was $54,618, though the average total payment was only $13,029 and the average Medicare payment was $10,990.[11] For outpatient procedures, the weighted average charge was $19,855, while the average Medicare payment was $2,638.[12] This difference is why it is difficult to explain what a hospital procedure “costs”: On average, Medicare paid just 20 percent of charges for inpatient services and even less for outpatient services, at merely 13 percent of charges.
While hospital prices are growing, physicians do not appear to be the primary beneficiaries of revenue increases. Between 2007 and 2014, insurer-negotiated hospital prices for all in-patient care grew 42 percent, while the prices paid to the physicians for that care grew just 18 percent; insurer-negotiated prices for hospital-based outpatient care grew 25 percent, while outpatient physician prices grew 6 percent.[13] The same study found that nearly all of the price increases for six different hospital-based procedures during this period were the result of increased hospital facility fees, which accounted for 92 percent of the growth in the cost of a cesarean section and 97 percent of the growth in the cost of a knee replacement.[14]
Another study by Altarum found similar results: The cumulative growth in overall health care prices from 2005 to 2018 was 29 percent, but hospital prices increased 36 percent while prices paid for physician and clinical services grew just 15 percent.[15] This spread grew substantially over the second half of this period: Since 2012, physician and clinical services prices grew just 1 percent, while hospital prices grew 13 percent. Payments from private insurers in particular are driving this price growth: Hospital reimbursement rates from public payers grew just 19 percent from 2005 to 2018, but prices paid by private insurers grew 56 percent.
Some of this price growth may be to account for a number of factors leading to increased costs. For example, the American Hospital Association estimates that the regulatory burden amounts to $39 billion per year.[16] Hospitals’ labor costs have increased an estimated 19 percent over the past 10 years.[17] Hospitals also need to cover the cost of new technology purchases. Though, there is a question as to how much new technology is needed and how much is purchased simply because the funds are available: For instance, the United States has three times as many MRI machines as comparable countries, on average.[18] Lastly, hospitals may be trying to offset the impact from a shift in payer mix, as a growing number of beneficiaries are covered by Medicare and Medicaid which, as discussed, provide lower reimbursement rates.
Prices also vary substantially, not just across the country, but within cities and counties and even within a hospital itself. One study found that variation in prices accounts for roughly half of the variation in spending per privately insured individual, which varies more than three-fold.[19] Roughly 20 percent of hospital price variation is variation of prices within a hospital (different prices paid by different insurers for the same procedure to the same hospital).[20] According to a study by RAND analyzing the reimbursement rates negotiated by private insurers, prices paid in a single hospital system ranged from 150 percent of Medicare rates to more than 400 percent.[21]
That same RAND study assessing $13 billion worth of hospital payments from 2015 to 2017 found that private payers (i.e. private insurers and self-insured employers) pay significantly more than Medicare, and that difference is growing over time: The average relative price of a service paid by private insurers was 136 percent greater than the Medicare reimbursement rate in 2015 and increased to 141 percent greater in 2017.[22] The average price differential for outpatient services is significantly higher (193 percent greater) than for inpatient care (104 percent).[23] The self-insured employers in this study paid an estimated $7.7 billion over what Medicare would have paid for the same services.
Hospital Markets
The Connection Between Market Share and Prices
Unsurprisingly, hospital prices are highly correlated with a hospital’s market power as well as the competitiveness of the insurance market.
In highly concentrated hospital markets—where one or few hospitals dominate—prices are significantly higher than in less concentrated markets, and hospital prices increase following market consolidation. One study noted, “the clearest differences between low- and high-price hospitals were their size and market share.… [H]igh-price hospitals had market shares about three times as large as those of low-price hospitals” and were more likely to be part of a large hospital system with significant market share.[24] Hospitals with a monopoly in a given area command prices from insurers that are 12 percent higher, on average, than the prices of hospitals with four or more competitors.[25] Numerous studies show that prices charged by hospitals increase 20-40 percent, on average, and as high as 65 percent when hospitals within the same market merge. The greatest price increases occur when merging hospitals are closer together.[26] In economics, this is referred to as the substitution effect: When products have a close substitute, consumers will switch to the substitute when the price of the other product increases; thus, the substitutes act as competitors. The closer two hospitals are, the greater their ability to be substituted for the other. When they merge and are no longer competing for patients, prices rise significantly.
The price differential also depends on the strength of the insurer, which is a function of both the insurer’s market share and the insurance plan’s structure. The likely impact is less straightforward, however, because the strength of the insurer can have counteracting effects. On the one hand, a dominant insurer may be able to exert significant downward pressure on hospital prices; on the other hand, a dominant insurer faces little pressure to offer low premiums.
One study found that, unlike with hospitals, when insurers increased their market share by 10 percentage points, hospital prices declined by 7 percent.[27] Another study of highly concentrated hospital markets similarly found hospital admission prices were 5 percent lower in areas where the insurer market was also highly concentrated, relative to markets with low insurer concentration.[28] Of note, though, prices were lowest where both hospital and insurer market concentration was low: Power was disbursed on both sides. Further, a Health Affairs study found that the median hospital price paid by insurers with more restrictive provider networks was lower and increased more slowly than the prices paid by other insurers.[29]
The lower prices extracted by dominant insurers do not necessarily result in lower insurance premiums, however. In an examination of the individual market, premiums were 5 percent higher in highly concentrated hospital markets, with the highest premiums in markets that also had a dominant insurer.[30] While premiums declined when the number of insurers in a market increased, the reduction was not enough to offset the increase in premiums related to high hospital market concentration. Thus, while the nature of the insurance market is important to the cost of hospital care and the prices patients pay, the evidence suggests the nature of the hospital market has the biggest impact on prices and insurance premiums.
The Current Landscape
The majority of markets are now dominated by one or two hospital entities, leaving many parts of the country without hospital competition. The Health Care Cost Institute (HCCI) has done extensive work documenting and analyzing hospital market concentration, and it recently released the Healthy Marketplace Index in conjunction with the Robert Wood Johnson Foundation, which includes an interactive tool. HHCI found that 72 percent of metropolitan areas had highly concentrated hospital markets in 2016.
Hospital mergers are on the rise. Between 1998 and 2018, there were 1,667 hospital mergers, but the frequency has increased in the past decade: 66 percent of those mergers occurred in 2006 or later.[31] Further, roughly half of these mergers were between hospitals in the same market, hindering competition.[32] Between 2013 and 2017, the number of hospitals that were part of a hospital system increased 5 percent.[33]
The shift toward outpatient care has also incentivized hospitals to acquire physician practices and outpatient clinics. Between July 2012 and January 2018, all regions in the United States saw an increase in the number of physicians employed by a hospital, with a nationwide increase of 71 percent.[34] During this time, hospitals acquired 44,300 physician practices, increasing the total number of hospital-employed physicians to 168,800, or 44 percent of all physicians.[35] This consolidation matters because hospital acquisition affects physician pricing behavior in a way similar to the impacts of hospital mergers: Prices at physician practices acquired by hospitals increased by 14 percent, on average, after the integration, and patient spending increased by 4.9 percent.[36]
The rise of the 340B Prescription Drug Discount Program has also encouraged hospitals to acquire physician practices, as explained here. Hospitals can generate significant savings and profits from these discounts, and their eligibility for the program extends to any outpatient clinic they own. A study by Milliman found that the percentage of chemotherapy infusions delivered to Medicare beneficiaries in hospital outpatient departments (HOPDs) increased from 15.8 percent in 2004 to 45.9 percent in 2014, with most of the increase occurring at 340B hospital-owned sites, and that this shift led to increased Medicare expenditures of more than $4,000 per beneficiary.[37] Further, another study by Avalere found that treatments in HOPDs cost 53 percent more than the same treatment in a physician office.[38] UnitedHeath Group recently released a report showing that between $16,000 to $37,000 per patient (or $4 billion total) could be saved annually if the specialty drugs provided to patients for five different chronic conditions were provided in a physician office or the patient’s home rather than an HOPD.[39]
Hospital Profits
The increased consolidation—and thus, increased negotiating power—has unsurprisingly resulted in increased profits for many hospital systems. Hospital systems with no competition can demand contracts that are more favorable for the health system and may include anticompetitive clauses such as anti-tiering, anti-steering, and “gag” clauses.[40] In 2017, hospitals’ all-payer margins increased to 7.1 percent, on average, a 27 percent increase from 2013—the year prior to the insurance coverage expansions of the Affordable Care Act.[41] This increase is in spite of negative Medicare margins of nearly 10 percent, suggesting significant cost-shifting to private insurers and patients. One study found, however, that the formula may be a little more complicated: Many private insurers set their payment rates as some percentage of Medicare rates; when Medicare rates have been reduced, private payment rates have also fallen.[42] This connection suggests that while there may be some cost-shifting to the private market, some of the price differential may depend more on the hospital and insurers’ relative negotiating leverage, as discussed earlier.
Not all high-price hospitals yield significant profits, though. One study found that high prices may simply reflect a more expensive (less efficient) cost structure: High-price hospitals had operating margins (which measures revenue in excess of daily expenses and is considered to be a measure of a business’s efficiency) of negative 2.8 percent, while low-price hospitals had operating margins of positive 1.5 percent. [43] Low-price hospitals also had the highest total margins (which is a broader measurement inclusive of income from interest earned, donations, government appropriations, etc.), while high-price hospitals’ total margins were 1.2 percentage points less. Further, high-price hospitals only performed better than low-price hospitals on one quality measure studied. These hospitals likely commanded higher prices because of both their market share and the greater likelihood of providing specialized services, such as neonatal intensive care and Level 1 trauma services, that other hospitals in the area do not.
Urban and rural hospitals also differ significantly. Data from the University of North Carolina show that 113 rural hospitals have closed since 2010, primarily in the South.[44] Between 2013 and 2017, there was a 2 percent increase in urban hospitals, while the number of rural community hospitals declined nearly 8 percent during that same time period.[45] In February 2019, Navigant reported that 21 percent of rural hospitals are still at high risk of closure based on their financial status: The average operating margin for Medicare patients at these hospitals is -8.2 percent (when excluding critical access hospitals).[46]
Quality Impacts
One argument that proponents of hospital consolidation make is that such consolidation is necessary to better coordinate care and improve patient outcomes. In fact, recent laws, regulations, and payment structures have been put in place to create Accountable Care Organizations and Patient-Centered Medical Homes and to adjust payment rates based on various patient outcomes. These changes give health care providers a financial incentive to do what is necessary to improve care coordination. For many, the solution has been to consolidate, both vertically (hospitals acquiring physician practices and outpatient clinics) and horizontally (hospitals merging with other hospitals).
Nevertheless, study after study has failed to document improvements in quality; rather, quality is often worse in highly concentrated markets even while prices are higher, as Marty Gaynor, Carnegie Mellon University Professor and former Director of the Bureau of Economics at the Federal Trade Commission, recently testified to Congress. For example, the risk-adjusted one-year mortality rate for Medicare patients suffering a heart attack was 4.4 percent higher in the most concentrated hospital markets relative to the least, which translates to 2,000 more deaths.[47] In another study Gaynor concluded, “We find that the effect of competition is to save lives without raising costs. Patients discharged from hospitals located in markets where competition was more feasible were less likely to die, had shorter length of stay, and were treated at the same cost.”[48]
Conclusion
Hospital expenditures have consistently constituted a third of all health care expenditures in the United States. Hospital-market concentration is highly correlated with high and rising prices for health care services of all kinds, not just hospital services. Numerous policies enacted over the years have incentivized continued market consolidation, both horizontally and vertically. The evidence shows these trends are exacerbating the health care spending crisis in our country.
[1] https://www.cms.gov/Research-Statistics-Data-and-Systems/Statistics-Trends-and-Reports/NationalHealthExpendData/NationalHealthAccountsHistorical.html
[2] Though, the NHE calculated by CMS includes the costs for non-retail prescription drugs, those administered in the hospital or by physicians, in those respective spending categories, rather than in the prescription drug cost category. The Altarum Institute estimates that non-retail prescription drug expenditures totaled $132 billion in 2017, $34.2 billion of which were provided in hospitals: https://www.altarum.org/publications/projections-prescription-drug-share-national-health-expenditures-including-non-retail-0
[3] https://www.cms.gov/Research-Statistics-Data-and-Systems/Statistics-Trends-and-Reports/NationalHealthExpendData/NationalHealthAccountsProjected.html
[4] http://truecostofhealthcare.org/admissions_data/
[5] http://truecostofhealthcare.org/admissions_data/
[6] http://truecostofhealthcare.org/admissions_data/
[7] https://www.beckersasc.com/asc-turnarounds-ideas-to-improve-performance/10-key-trends-for-ascs-and-outpatient-surgery-in-the-next-10-years.html
[8] http://truecostofhealthcare.org/admissions_data/
[9] https://www.modernhealthcare.com/article/20190103/TRANSFORMATION02/190109960/aha-data-show-hospitals-outpatient-revenue-nearing-inpatient
[10] https://www.modernhealthcare.com/article/20190103/TRANSFORMATION02/190109960/aha-data-show-hospitals-outpatient-revenue-nearing-inpatient
[11] Author’s calculation based on data from CMS: https://data.cms.gov/Medicare-Inpatient/Inpatient-Prospective-Payment-System-IPPS-Provider/fm2n-hjj6/data
[12] Author’s calculation based on data from CMS: https://data.cms.gov/Medicare-Outpatient/Provider-Outpatient-Hospital-Charge-Data-by-APC-CY/fmbt-qrrw/data
[13] https://www.healthaffairs.org/doi/abs/10.1377/hlthaff.2018.05424
[14] https://healthcarepricingproject.org/paper/paper-2-hospital-prices-grew-substantially-faster-physician-prices-hospital-based-care-2007%E2%80%9314 (Exhibit 4)
[15] https://altarum.org/publications/health-sector-trend-report-april-2019
[16] https://www.aha.org/sites/default/files/regulatory-overload-report.pdf
[17] https://www.bls.gov/web/eci/echistrynaics.txt
[18] https://www.healthsystemtracker.org/chart-collection/u-s-health-care-resources-compare-countries/#item-per-capita-u-s-three-times-many-mri-machines-comparable-countries-average
[19] https://www.nihcm.org/categories/what-is-driving-variation-in-spending-and-prices-for-those-with-private-health-insurance
[20] https://academic.oup.com/qje/article-abstract/134/1/51/5090426?redirectedFrom=fulltext
[21] https://www.rand.org/pubs/research_reports/RR3033.html
[22] https://www.rand.org/pubs/research_reports/RR3033.html
[23] https://www.rand.org/pubs/research_reports/RR3033.html
[24] https://www.healthaffairs.org/doi/full/10.1377/hlthaff.2013.0747
[25] https://www.nihcm.org/categories/what-is-driving-variation-in-spending-and-prices-for-those-with-private-health-insurance
[26] https://www.nihcm.org/categories/hospital-consolidation-trends-impacts-outlook-citations#slide10
[27] https://www.nihcm.org/categories/what-is-driving-variation-in-spending-and-prices-for-those-with-private-health-insurance
[28] https://www.healthaffairs.org/doi/10.1377/hlthaff.2017.0552
[29] https://www.healthaffairs.org/doi/abs/10.1377/hlthaff.2018.0567?journalCode=hlthaff
[30] https://www.healthaffairs.org/doi/10.1377/hlthaff.2018.05491
[31] https://docs.house.gov/meetings/JU/JU05/20190307/109024/HHRG-116-JU05-Bio-GaynorM-20190307.pdf , https://www.nihcm.org/categories/hospital-consolidation-trends-impacts-outlook
[32] https://docs.house.gov/meetings/JU/JU05/20190307/109024/HHRG-116-JU05-Bio-GaynorM-20190307.pdf
[33] https://www.modernhealthcare.com/article/20190103/TRANSFORMATION02/190109960/aha-data-show-hospitals-outpatient-revenue-nearing-inpatient
[34] http://www.physiciansadvocacyinstitute.org/Portals/0/assets/docs/021919-Avalere-PAI-Physician-Employment-Trends-Study-2018-Update.pdf?ver=2019-02-19-162735-117
[35] http://www.physiciansadvocacyinstitute.org/Portals/0/assets/docs/021919-Avalere-PAI-Physician-Employment-Trends-Study-2018-Update.pdf?ver=2019-02-19-162735-117
[36] https://www.scholars.northwestern.edu/en/publications/the-effect-of-hospital-acquisitions-of-physician-practices-on-pri
[37] http://www.milliman.com/uploadedFiles/insight/2016/trends-in-cancer-care.pdf
[38] https://www.communityoncology.org/pdfs/avalere-cost-of-cancer-care-study.pdf
[39] https://www.unitedhealthgroup.com/content/dam/UHG/PDF/2019/UHG-Administered-Specialty-Drugs.pdf
[40] https://docs.house.gov/meetings/JU/JU05/20190307/109024/HHRG-116-JU05-Bio-GaynorM-20190307.pdf
[41] https://www.modernhealthcare.com/article/20190103/TRANSFORMATION02/190109960/aha-data-show-hospitals-outpatient-revenue-nearing-inpatient
[42] https://www.healthaffairs.org/doi/10.1377/hlthaff.2012.0332
[43] https://www.healthaffairs.org/doi/full/10.1377/hlthaff.2013.0747
[44] https://www.shepscenter.unc.edu/ programs-projects/rural-health/rural-hospital-closures/
[45] https://www.modernhealthcare.com/article/20190103/TRANSFORMATION02/190109960/aha-data-show-hospitals-outpatient-revenue-nearing-inpatient
[46] https://www.navigant.com/-/media/www/site/insights/healthcare/2019/rural-hospital-public-option.pdf
[47] Kessler, D. and McClellan, M. (2000). Is hospital competition socially wasteful? Quarterly Journal of Economics, 115(2):577–615.