Research
June 22, 2022
Industry Concentration and the Effect on Startups
Executive Summary
- Many public officials, pundits, and media outlets are pushing the notion that big companies are using their market dominance to stifle the inflow of competing startups.
- While data from the U.S. Census Bureau’s Business Dynamics Statistics showed that startups as a share of total firms steadily declined over a 32-year period (from 13.3 percent in 1978 to 7.3 percent in 2010), that deep-rooted, downward trend was reversed in the wake of the financial crisis as the share of startups rose in six of the subsequent nine years to 8.1 percent in 2019.
- Analysis of market concentration data from the Economic Census and data on startups from the Business Dynamics Statistics showed no correlation between the percentage point change in the concentration ratio of the four largest firms and the percentage change in the number of startups in 257 industries between 2002–2017; sectors classified as high-tech industries showed a similar pattern.
- Narrowing the focus to companies being targeted by new antitrust legislation (Amazon, Apple, Facebook, Google, and Microsoft), the data showed a positive correlation between the change in the concentration ratio and the change in startups; in other words, the percentage change in startups moves in the same direction as a percentage point change in the concentration ratio.
- There are likely several factors contributing to the slowdown in the share of startups over the past four decades, but absent any correlation between a percentage change in startups and a percentage point change in the concentration ratio, it is difficult to give credence to the idea that the presence of large firms is preventing new market entrants.
Introduction
The idea that “big is bad” has staged a comeback. Big Oil, Big Tobacco, Big Pharma, and other “big” industries have all, at one time or another, been the target of antitrust regulators. Now, Big Tech is in the crosshairs.
In a June 2022 interview with Vox, Federal Trade Commission Chair Lina Khan was asked about antitrust reform in the context of “counter[ing] threats to the economy and democracy that massive companies – especially from very powerful tech companies.” Khan replied, “[T]he tech context, in particular, can have a whole host of ramifications for Americans. It can affect whether people can start their own business and enter the market, or whether they’re going to be squashed out immediately.” She continued, “[It] also affects innovation and what type of products and services are available in the first place. We want to have an economy that is open, that’s competitive, where the next successful startup and entrepreneur who brings a product to the market that consumers really love is able to thrive, rather than get squashed out at the inception.”
Are big firms really flexing their market muscle to stifle the inflow of competitors? Analyzing data from previous American Action Forum (AAF) research on market concentration and data from the U.S. Census Bureau’s Business Dynamics Statistics, there seems to be little correlation between the percentage point change concentration levels and the percentage change in the number of startups entering the market between 2002–2017, suggesting that big firms are not snuffing out young competition. A 2020 study conducted by the Information Technology & Innovation Foundation drew a similar conclusion.
The Startup Landscape
Startups are a vital component of economic growth. They are the main driver of job creation and an important source of innovation.
Data from the Business Dynamics Statistics showed that startups, defined in this study as firms less than one year old, created an average of 2.6 million net jobs per year between 1978–2019. By contrast, firms one year and older averaged over 1 million net job losses.
The benefits of startups are not limited to employment. While it is difficult to quantify innovation, a Forbes article noted that “large companies and start-ups have different attitudes towards innovation. The large companies invest in incremental technologies that have more controllable risks – and predictable returns. By contrast, start-ups invest in breakthrough innovation.”
Given the outsized effects new firms have on employment and innovation, understanding the startup landscape aided the analysis.
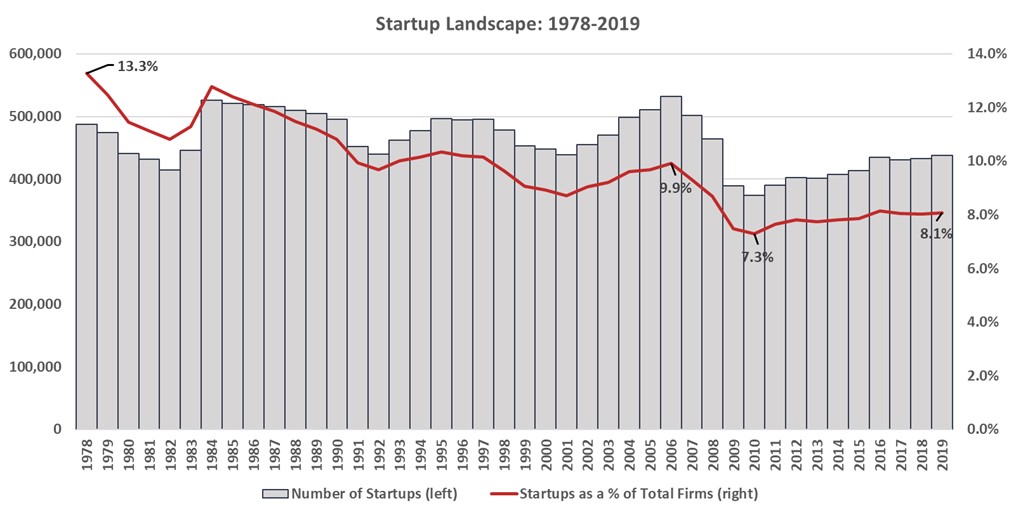
The Business Dynamics Statistics dataset showed a weakening startup environment between 1978–2010. As depicted in Figure 1, nearly 487,000 startups entered the market in 1978, accounting for 13.3 percent of the total number of firms. In the wake of the financial crisis, that share slipped to a low of 7.3 percent (374,000 startups) in 2010. Over that 32-year span, there were 22 years in which the share of startups experienced a percentage point decline. As the effects of the financial crisis waned, however, the share of startups slowly rebounded and climbed to 8.1 percent of total firms in 2019.
Figure 1
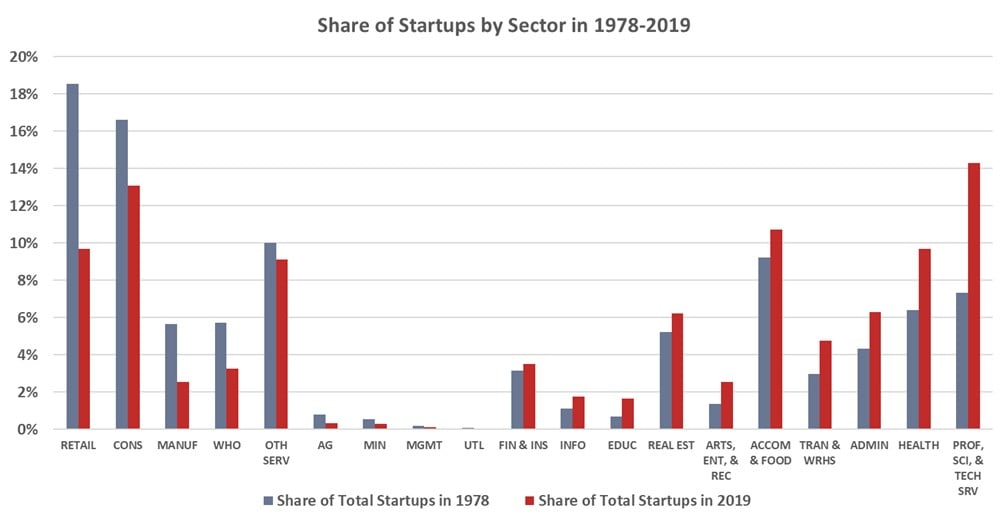
The losses in the share of startups over the last four decades were concentrated in a few sectors. Figure 2 shows the share of startups by sector between 1978–2019. In 1978, the retail trade and construction sectors accounted for 18.6 percent and 16.6 percent of startups, respectively. Those shares declined to 9.7 percent and 13.1 percent by 2019.
Figure 2
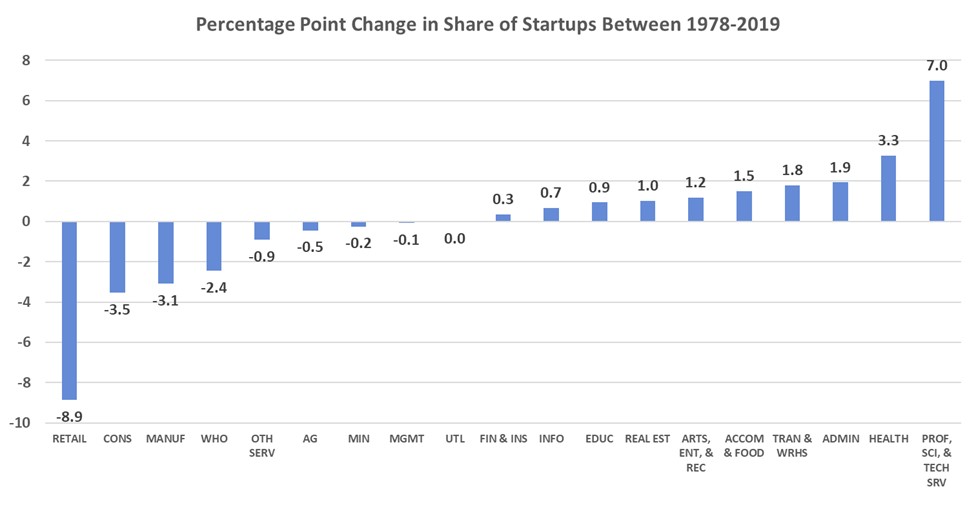
Conversely, the professional, scientific, and technical services sector share of startups increased seven percentage points, from 7.3 percent in 1978 to 14.3 percent in 2019. Figure 3 illustrates the percentage point change in the share of startups across sectors between 1978–2019.
Figure 3
Concentration Ratios and Startups
The Business Dynamics Statistics dataset breaks out the number of firms by age and industry using the North American Industry Classification System (NAICS). Similarly, the concentration ratios calculated in previous AAF research are also categorized by NAICS codes.
NAICS codes range in degrees of specificity from a 2-digit NAICS code (a general sector, e.g., 22 – Utilities) to a 6-digit code (a specific industry, e.g., 221115 – Wind Electric Power Generation). The Business Dynamics Statistics data have NAICS detail at the 4-digit level (e.g., 2211 – Electric Power Generation, Transmission and Distribution). While using the most detailed 6-digit breakdown is preferred, using the 4-digit classification provided a reasonable approximation of the relationship between concentration ratios and startup activity.
The main finding of the study is displayed in Figure 4, with each dot representing one of the 257 4-digit NAICS industries with relevant data. The position of each dot corresponds to the percentage point change in the concentration ratio of the four largest firms (CR4) and the percentage change in the number of startups between 2002–2017.
Figure 4
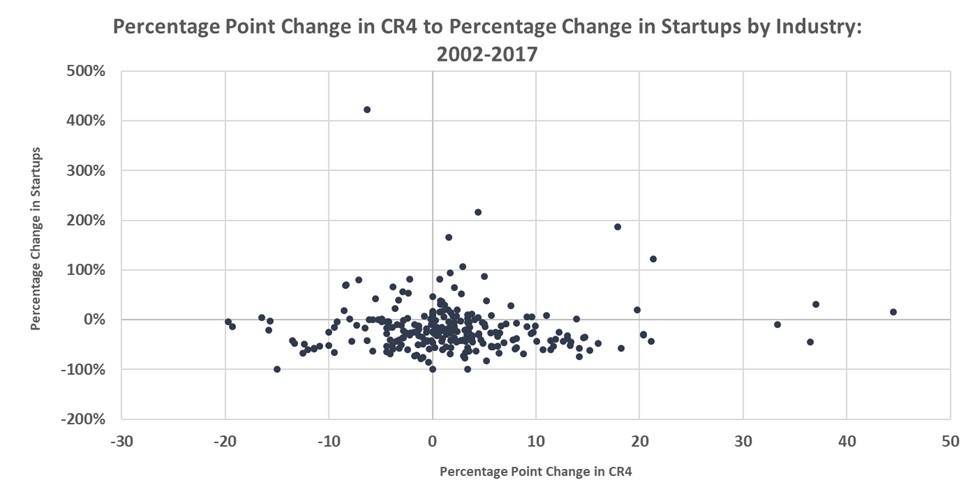
If there is validity to the theory that higher market concentration suppresses new market entrants, there would be a discernible negative correlation between the two variables, meaning that a change in the CR4 moves in the opposite direction of the percentage change in startups. The graph shows zero (0.00) correlation between the variables.
While this study does not attempt to establish a causal relationship between the change in CR4 and the percentage change in the number of startups over time, it does show how the variables move in relation to each other.
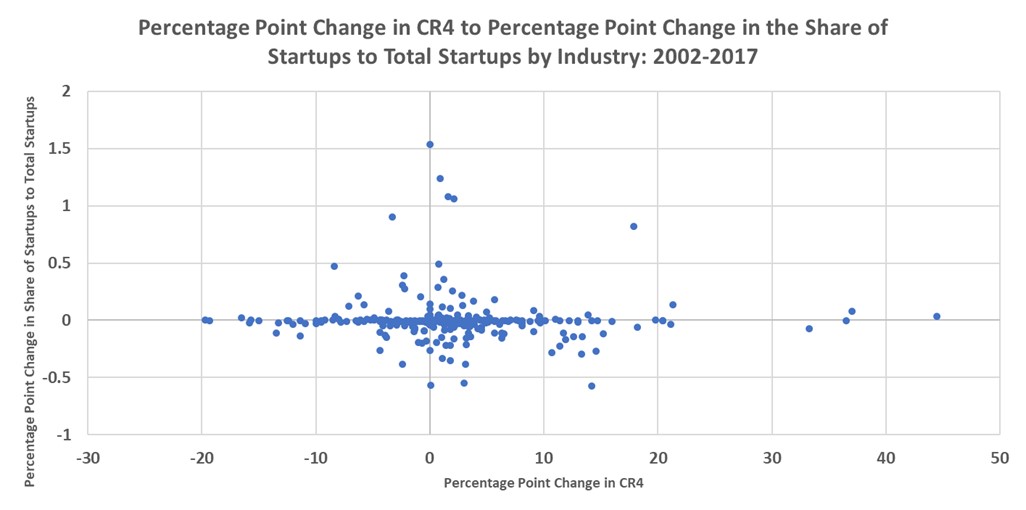
As an alternative approach, this study examined the correlation between the percentage point change in the market concentration ratio and the share of startups in each industry to the total number of startups, rather than the total number of firms. This method would help answer the question of whether increased market concentration shifts startup activity from one industry to another. Based on the theory behind the proposed antitrust legislation, a percentage point change in the concentration ratio for a particular industry would be negatively correlated with a percentage point change in the industry share of startups to total startups. Like Figure 4, Figure 5 shows almost no correlation (-0.04) and refutes the theory that increased market concentration shifts startup activity.
Figure 5
High-tech and Big-tech Sectors
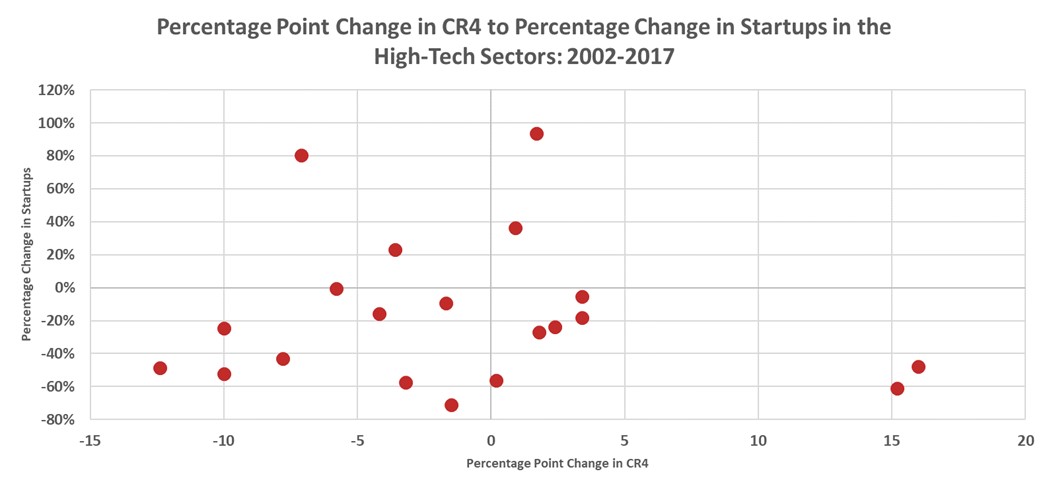
What about high-tech industries? Using the definition of high-tech industries from the U.S. Bureau of Labor Statistics, the sample is reduced to 20 industries. Figure 6 reveals a result similar to that of the overall sample. There was a weak (-0.10), negative correlation between the percentage change in startups and the percentage point change in CR4.
Figure 6
The data showed a very different pattern when the scope was limited to the five big-tech firms targeted by proposed antitrust legislation. The U.S. Securities and Exchange Commission provides the NAICS code for Amazon, Apple, Facebook, Google, and Microsoft. Figure 7 shows a strong (0.71), positive correlation between the two variables for the five companies. This suggests that the two variables move in the same direction for these four industries (Google and Facebook share the same 4-digit NAICS code). It would be misguided to draw an overall conclusion based on such a limited sample, but the correlation had the opposite sign of what the hypothesis suggests. If these big-tech firms were using their increased market power to limit competition, a strong, negative correlation would be evident.
Figure 7

Big-tech Acquisitions Might Spur Innovation, Not Suppress It
In an opinion published by The Hill, the author echoed the popularized opinion that Apple, Amazon, Facebook, Google, and Microsoft “have gobbled up over 600 companies to prevent competing technology that might displace them.”
This study found no evidence to support this claim, and there are myriad reasons why. One such explanation was summarized in a CNBC article highlighting concerns among venture capitalists (VC) over the proposed changes to antitrust laws. The article warned that “tech investors say they’re more concerned with how the bills could squash the buying market for start-ups and discourage further innovation.” The article adds, “their fear is that if companies no longer have enough viable exit paths, institutional investors that back VCs…will shift their money elsewhere. In turn, VCs will have fewer funds to dole out to entrepreneurs, who may see less reason to take the risk of starting a new company.”
Further evidence from the 2020 Global Startup Outlook report from Silicon Valley Bank emphasized the importance of acquisition as a viable exit strategy among entrepreneurs. A majority (58 percent) of survey respondents cited being acquired as a realistic long-term goal for their company compared to 17 percent wanting to go public via an initial public offering (or IPO) and 14 percent planning to stay private. The remaining 11 percent did not know or preferred not to say. Similar responses were found with companies based in the United Kingdom and Canada. The bank survey also showed that 36 percent of startups expect venture capital to be their next source of funding.
The concerns raised by the venture capitalists and the Silicon Valley Bank survey results offer a possible explanation as to why there was such a strong, positive correlation in the big-tech analysis displayed in Figure 7. While more analysis would be required and is beyond the scope of this study, the data are consistent with the VC idea that increased market concentration is correlated with an influx of startups because of the perceived likelihood of being acquired by the dominant firm(s).
If antitrust laws are changed to limit large firm acquisitions of startups and the predictions made by VCs turn out to be accurate, a key source of startup funding could evaporate and innovation from tech startups might be hindered.
Conclusion
Data from the Economic Census and Business Dynamics Statistics showed no evidence of a correlation between the percentage point change in the CR4 and the percentage change in the level of startups by industry between 2002–2017. The results are similar when the scope was narrowed to high-tech firms. A positive correlation was found between the two variables among an even smaller sample of big-tech firms.
While the study does not establish a causal relationship, there was scant evidence to support the claim that big firms, specifically big-tech firms, are using their market power to prevent startup firms from entering the market.