Research
March 10, 2021
PRIMER: The Supplemental Nutrition Assistance Program (SNAP)
Executive Summary
- The Supplemental Nutrition Assistance Program is the country’s largest federal nutrition assistance program, serving roughly 40 million people each year.
- Eligibility is limited to individuals with net income below the federal poverty level, with further restrictions on certain populations, such as non-elderly, childless adults without disabilities.
- Monthly financial benefits are provided based on income, family size, and the government’s estimate of the cost a healthy meal as determined by the Thrifty Food Plan.
- Participation had been steadily declining over the past decade as the economy improved but rose substantially over the past year as millions of people lost their jobs and income as a result of the COVID-19 pandemic. Benefits have also been temporarily increased to provide additional assistance.
Introduction
Within the United States Department of Agriculture (USDA), the Food and Nutrition Service (FNS) aims to end hunger and obesity in the United States through a variety of federal nutrition programs, in partnership with state and tribal governments. Roughly one-fourth of Americans benefit from one or more of the 15 FNS programs in a given year. While the primary means of assistance are financial, these programs also promote a healthy lifestyle through access to nutritious food and nutrition education. The Supplemental Nutrition Assistance Program (SNAP) is the largest federal nutrition program designed to assist families struggling financially to put nutritious food on the table. This program serves roughly 40 million Americans across the country and operates in all 50 states, tribal organizations, the District of Columbia, and five U.S. Territories.
Background
The Food Stamp Act, signed in 1964, expanded a pilot program originally designed to provide financial assistance for the purchase of food, as well as to strengthen the agricultural industry.[i] This program eventually evolved into SNAP, and as the largest federal program working to fight hunger in America, SNAP now assists roughly 40 million low-income individuals in purchasing food each year.[ii] Nearly half of all SNAP participants are children (age 18 or younger), two-thirds of whom come from single-parent households. Benefits are provided using an Electronic Benefit Transfer (EBT) that allows participants to pay for food using a debit card-like payment method, where the value of the available funds are deducted with each purchase over the course of the month. Over 80 percent of SNAP benefits in 2019 were redeemed at a supermarket or “super store.”[iii] The program has been shown to improve nutrition among low-income households.
Eligibility
To be eligible for SNAP, a family or individual must meet both an income and asset limit, as well as a few other criteria. Generally, a household must have net income below 100 percent of the federal poverty level (FPL), and gross monthly household income before deductions must be at or below 130 percent FPL, though there are widely used exceptions.[iv] Cash income from all sources is considered, including earned income (before payroll taxes are deducted) and unearned income. Unearned income includes cash assistance from programs such as Social Security, unemployment benefits, and child-support payments. Second, beneficiaries must pass an asset test: Households without an elderly or disabled member must have liquid assets of no more than $2,250, and households with an elderly or disabled member must have assets of no more than $3,500.[v] Highly liquid assets, such as money in a bank account, are considered because they are resources that could easily be available to the household to purchase food. Items that are not considered for asset-test purposes are homes, personal property, and retirement savings.
States differ in how they define income and household assets, and these variations affect families’ eligibility for SNAP benefits. For example, states can set the gross income thresholds for eligibility (at no more than 200 percent FPL), but the federal government sets the net income requirements. Certain allowable deductions may reduce a family’s net income. Deductions may be used to show that not all of a household’s income is available for purchasing food, thus reducing a family’s net income. Deductions are available for meeting other needs such as child support, medical expenses, excess shelter costs, dependent care, unavoidable costs, work-related expenses, and payroll taxes.[vi] Households with elderly or disabled individuals are not required to meet the gross income limit but must meet the net income limit.[vii]
The 1996 welfare reform law allowed states the option to adopt less restrictive eligibility and benefit rules in SNAP and other social welfare programs. Under these rules, states may raise SNAP gross income eligibility limits and adopt less restrictive (or non-existent) asset tests to promote saving and asset-building.[viii] As a result, over 40 states have implemented categorical eligibility, which enables states to confer SNAP eligibility on any individual who has already been deemed eligible for a non-cash Temporary Assistance for Needy Families (TANF) or state-funded Maintenance of Effort benefit. As a result, individuals in most states face a gross income limit of up to 200 percent FPL and no asset limit; the net income limit still applies, however.[ix] Further, states vary in how they administer and enroll participants, with some states offering more accommodating application methods and conducting more aggressive outreach to those in need.
Some people are not eligible for SNAP regardless of their income or assets, including individuals on strike, all unauthorized immigrants, and certain lawfully present immigrants.[x] Unemployed childless adults who do not have disabilities are limited to three months of SNAP benefits every three years in many states.
Benefits
SNAP benefits are tied to USDA’s Thrifty Food Plan—a diet plan intended to provide sufficient nutrition at a minimal cost. Families that receive benefits are expected to spend 30 percent of their net income on food. Families with no net income receive the maximum benefit. For other SNAP households, the monthly benefit equals the maximum benefit for that household size minus the household’s 30 percent expected contribution.
Currently, a household with two adults, two children, and no earned income is eligible to receive the maximum monthly benefit of $680, assuming no disqualification as a result of not working.[xi] Due to reportable income and other factors, however, the average four-person household typically receives significantly less: $477.[xii]
Spending on this state-administered program typically rises and falls in relation to unemployment and poverty. Similar to unemployment insurance, SNAP is one of the most responsive welfare programs to people’s financial changes, and beneficiaries often receive their benefits within seven days of applying. Because of state flexibilities and the option to adjust eligibility levels, SNAP benefits vary across state lines, as shown in the map below. Rhode Island, Connecticut, and California had the highest average SNAP benefits per person at $144, $143, and $141, respectively, in Fiscal Year (FY) 2020.[xiii] The lowest average SNAP benefits per person are in Arkansas and New Hampshire at $108 and $110, respectively. Hawaii and Alaska are exceptions since the cost of living (and thus FPL) in these states is higher; average monthly SNAP benefits in Hawaii and Alaska are $258 and $181, respectively.
Participation
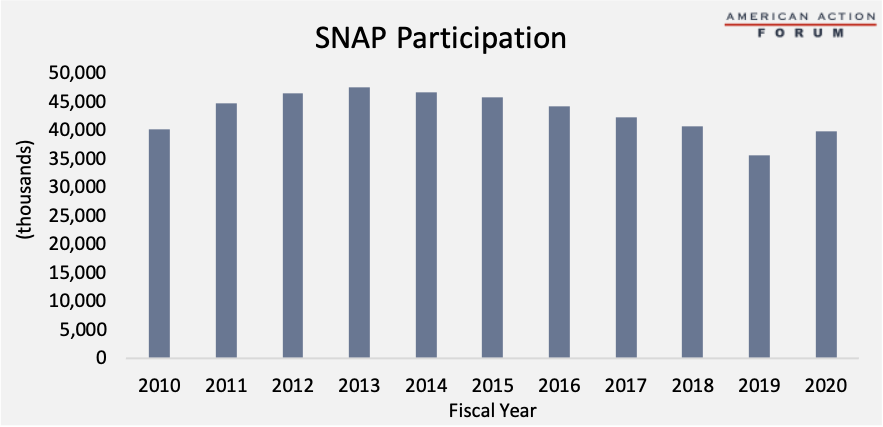
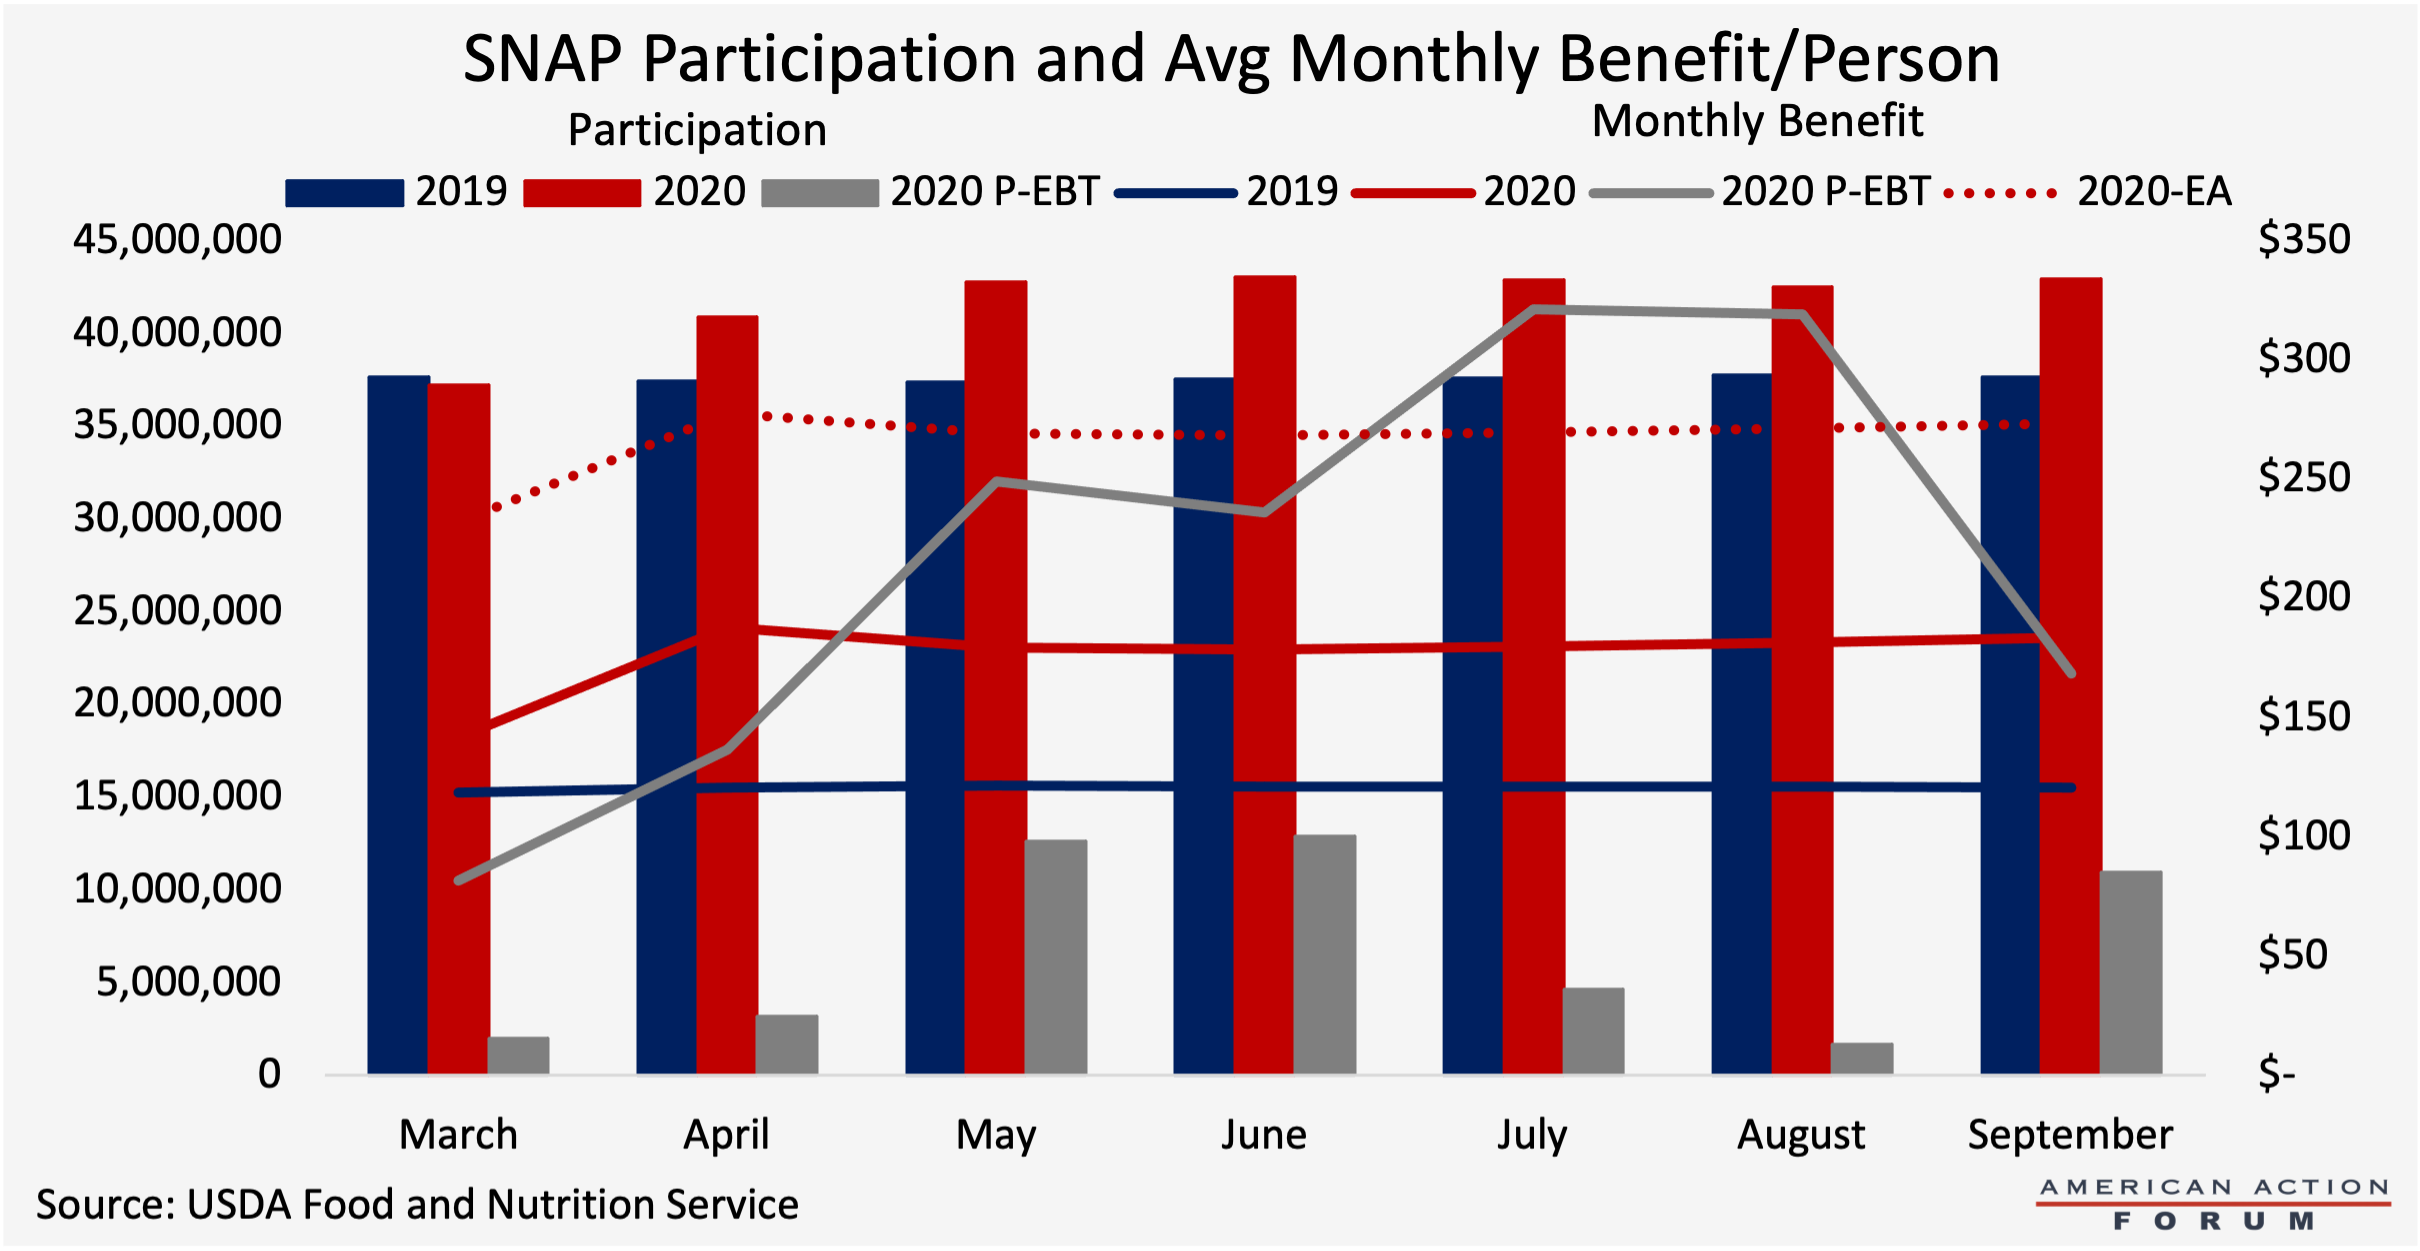
Participation in SNAP over the past 10 years has fluctuated quite a bit. Participation had peaked in FY 2013 at 47.6 million and by 2019 dropped to its lowest level since 2009 at 35.7 million.[xiv] In FY 2020, program participation continued to decrease in the early months, but then increased 10 percent from March to April as the effects of the COVID-19 pandemic were felt across the country; participation throughout the year averaged 40 million.[xv]
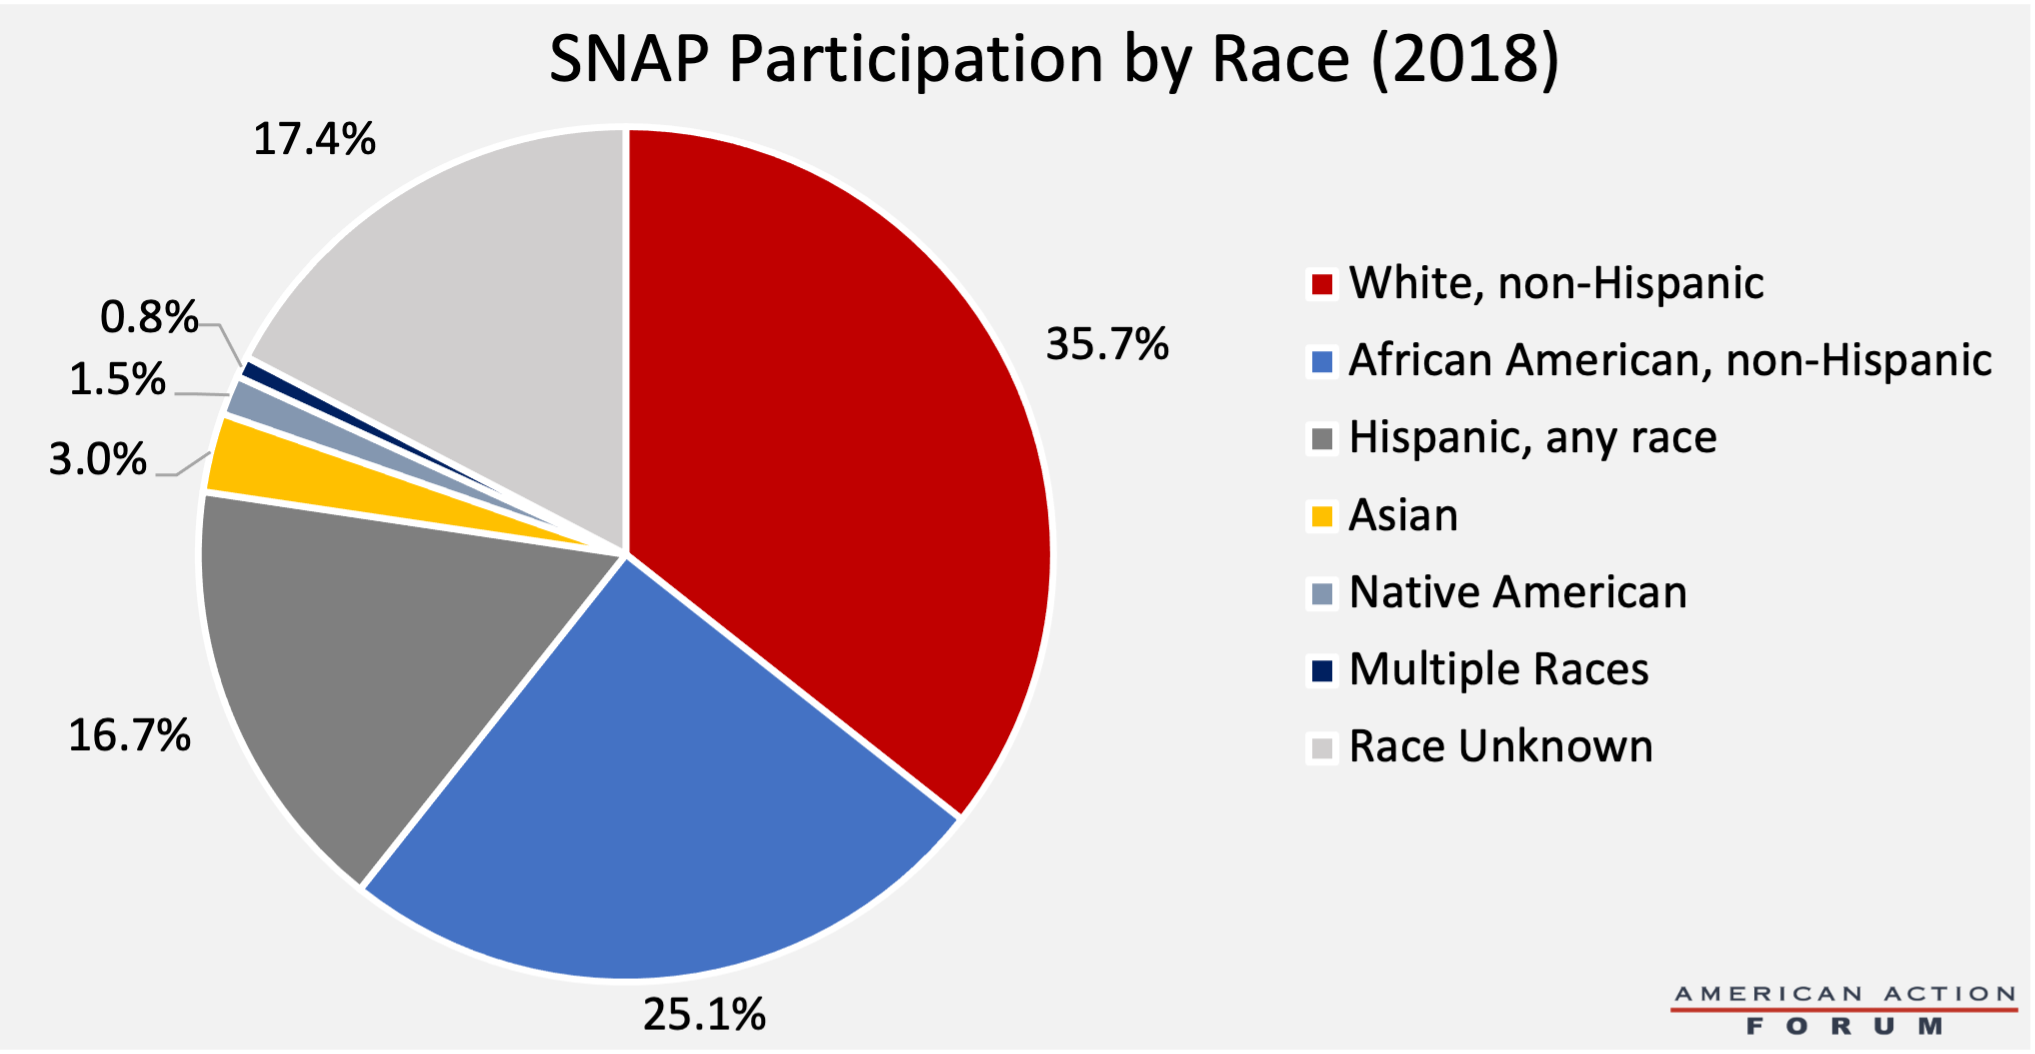
The chart below shows the racial and ethnic make-up of SNAP participants in FY 2018.[xvi] Relative to their share of the population, Black individuals make up a disproportionate share of SNAP participants, while Hispanic and Asian individuals participate at a slightly lower rate.[xvii] White individuals account for the largest share of participants but at a rate significantly below their share of the population.[xviii]
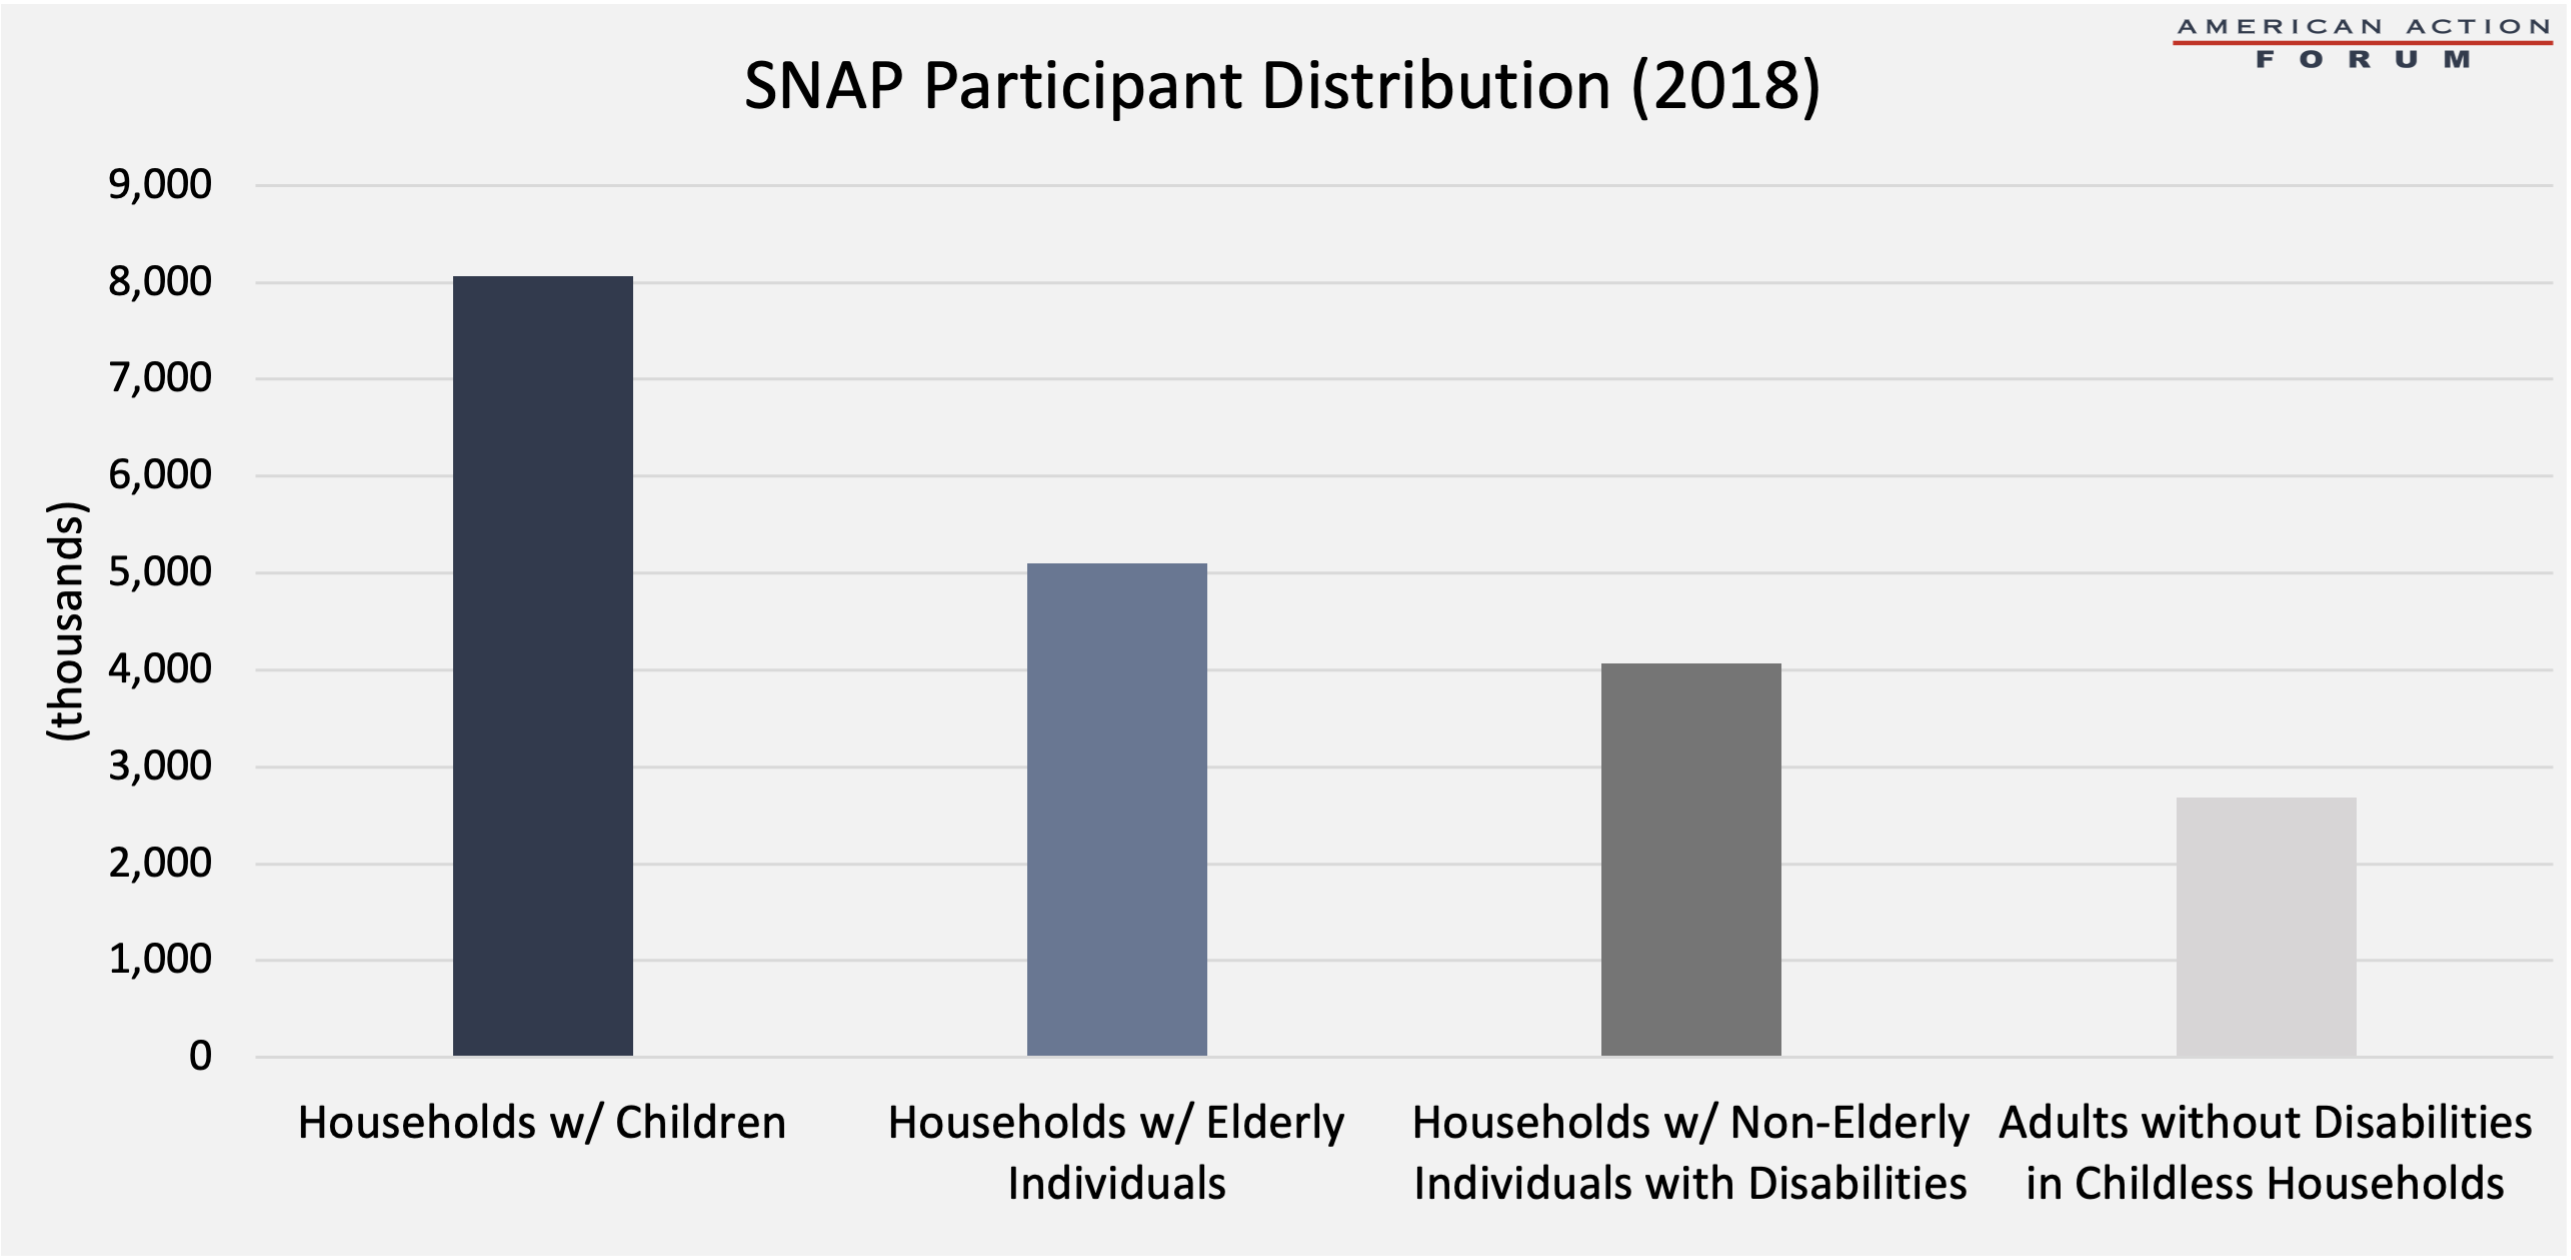
The next chart shows the distribution of SNAP participants by eligibility category in FY 2018. Households with children represent the largest share of SNAP participants, accounting for 41 percent of all SNAP households. Households with an elderly individual represent 26 percent of SNAP participants, and households with a non-elderly disabled individual represent 21 percent of participants. Adults without disabilities in childless households make-up 14 percent of participating households.[xix]
Costs
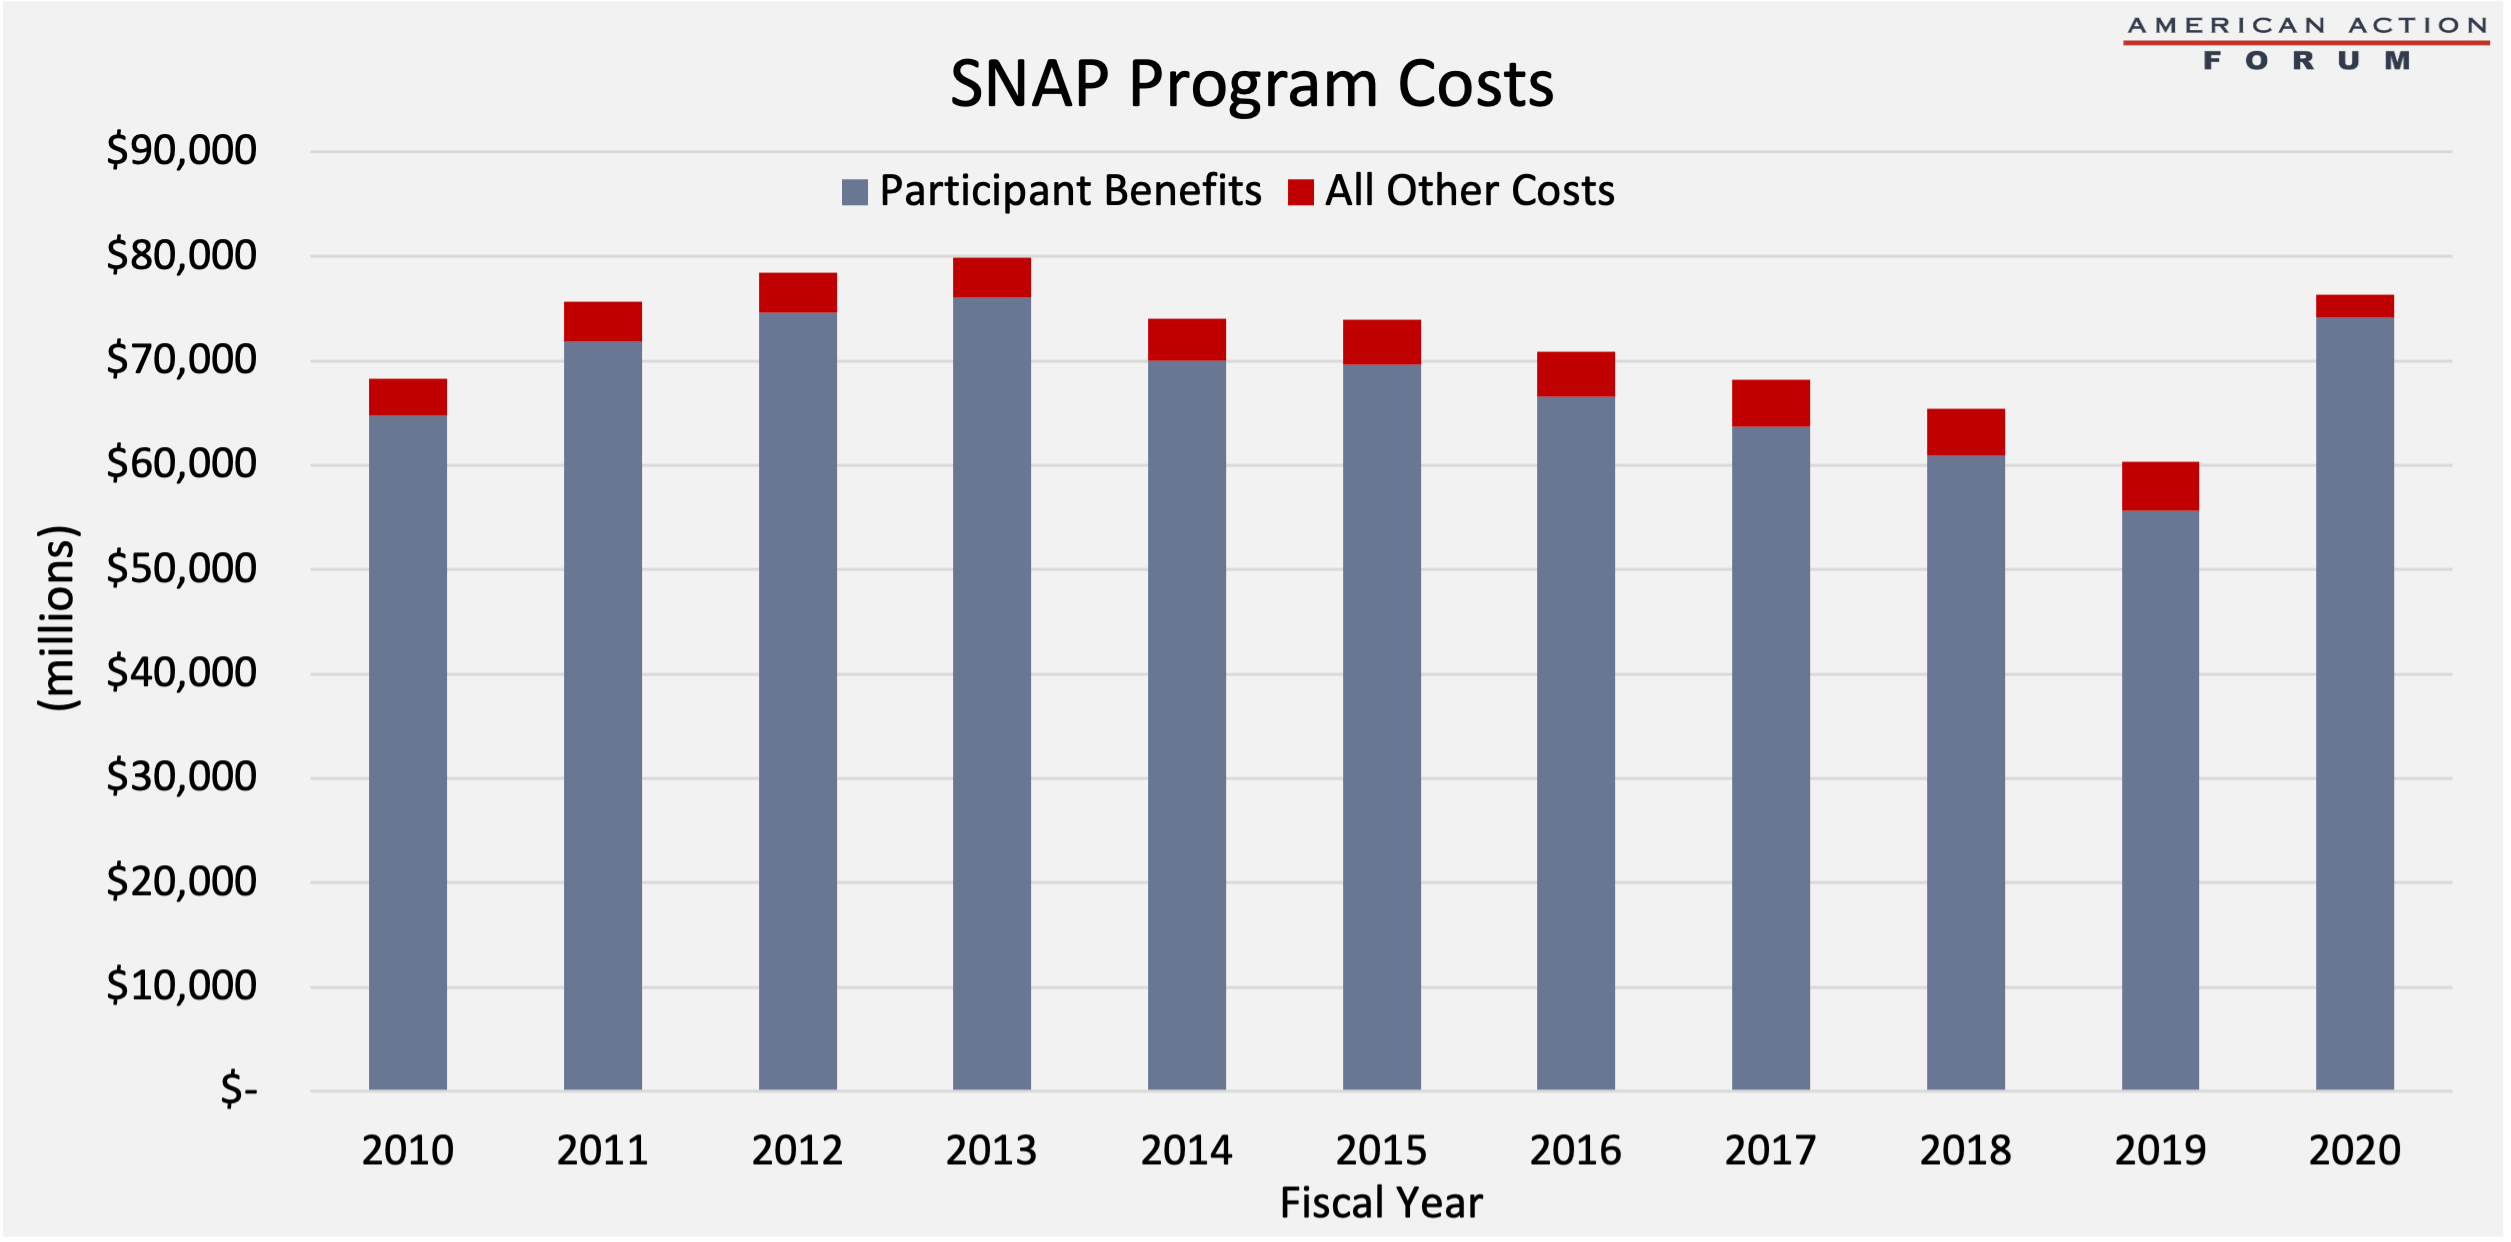
SNAP program costs have also fluctuated over the past 10 years, largely in line with changes in participation. Benefits were the highest in FY 2013 at $76.1 billion and lowest in FY 2019 at $55.6 billion.[xx] The noticeable decline in SNAP benefits from FY 2013 to FY 2014 is a reflection of the November 2013 expiration of the enhanced benefit amounts provided by the American Recovery and Reinvestment Act in 2009. SNAP’s total costs were highest in 2013, followed closely by 2020, and lowest in 2019, matching the peak and valley of program participation during this period. The federal government pays the full cost of SNAP benefits and splits the administrative costs of the program with the states.
SNAP During the COVID-19 Pandemic
The Families First Act increased SNAP benefits 30 percent from March to December 2020 to address increased food security challenges during the COVID-19 pandemic; in December 2020, Congress passed legislation to allow a reduced 15 percent benefit increase from January to June 2021. In addition to the enhanced SNAP benefit payments were emergency nutrition assistance allotments worth $14.6 billion, provided to 23.2 million people per month from March through September 2020. These additional benefits averaged $90 per person per month (as shown by the dotted line in the chart below).[xxi] These emergency allotments allowed individuals who were not receiving the maximum benefit (which has been temporarily increased) to do so. During FY 2020, the government spent a record $85.6 billion on SNAP, about 35 percent more than the $63.5 billion spent in FY 2019.
[i] https://www.fns.usda.gov/snap/short-history-snap
[ii] https://www.fns.usda.gov/snap/short-history-snap
[iii] https://fns-prod.azureedge.net/sites/default/files/resource-files/2019-SNAP-Retailer-Management-Year-End-Summary.pdf
[iv] https://fas.org/sgp/crs/misc/R42054.pdf
[v] https://fas.org/sgp/crs/misc/R42054.pdf
[vi] https://www.fns.usda.gov/snap/recipient/eligibility
[vii] https://www.fns.usda.gov/snap/broad-based-categorical-eligibility
[viii] https://fas.org/sgp/crs/misc/R42054.pdf
[ix] https://fas.org/sgp/crs/misc/R42054.pdf
[x] https://www.cbpp.org/research/food-assistance/a-quick-guide-to-snap-eligibility-and-benefits
[xi] https://www.cbpp.org/research/food-assistance/a-quick-guide-to-snap-eligibility-and-benefits
[xii] https://www.cbpp.org/research/food-assistance/a-quick-guide-to-snap-eligibility-and-benefits
[xiii] https://www.fns.usda.gov/pd/supplemental-nutrition-assistance-program-snap
[xiv] https://fns-prod.azureedge.net/sites/default/files/resource-files/SNAPsummary-1.pdf
[xv] https://www.fns.usda.gov/data/january-keydata-report-september-2020-data
[xvi] https://fns-prod.azureedge.net/sites/default/files/resource-files/Characteristics2018.pdf
[xvii] https://www.census.gov/quickfacts/fact/table/US/PST045219
[xviii] https://www.census.gov/quickfacts/fact/table/US/PST045219
[xix] https://fns-prod.azureedge.net/sites/default/files/resource-files/Characteristics2018.pdf
[xx] https://www.fns.usda.gov/data/january-keydata-report-september-2020-data
[xxi] https://www.fns.usda.gov/data/january-keydata-report-september-2020-data