Research
November 15, 2016
Substantial Premium Increases Prevalent: 2017 Health Insurance Marketplace
Nearly three years ago, the Affordable Care Act (ACA) implemented a new individual insurance marketplace, along with the promise of stability and affordability. The new individual marketplace was to rival that of the employer sponsored insurance (ESI) marketplace in stability and predictability, while premiums were to rise at rates much lower than the historical average.[i] No longer was the individual marketplace to be plagued by 8-12 percent premium increases while the ESI market enjoyed a steady 6 percent yearly increase.[ii] This paper seeks to evaluate the degree to which these promises have been fulfilled, heading into year four. After more modest increases in 2015 and 2016, there looks to be substantial increases for much of the nation in 2017. In this study the American Action Forum finds that the cost of 2016 benchmark Silver plans will increase by an average of 27 percent in 2017 for a 27-year-old non-smoker. While the lowest cost Bronze plan will increase by 22 percent in 2017.
Data and Methodology
The primary sources of data for this report are the 2016 and 2017 individual market medical landscape files that are available through the Centers for Medicare and Medicaid Services (CMS).[iii] These landscape files contain data on the health insurances plans that were offered through the federally-facilitated or federal-state partnership exchanges, which include 38 states in 2016, and 39 states in 2017.
The Robert Wood Johnson Foundation (RWJF) also offers exchange data for 2015 and 2016 in all states.[iv] For any gaps in the data provided by RWJF we use plan compare tools on state-based exchanges where they are available. Overall, we analyze data on 2016 and 2017 Silver plans for 50 states, which account for 499 of the 501 rating areas nationwide. Our estimates on the number of health insurance issuers in a given rating area are also based on Silver plan data.
We use plan compare tools and rate filings on state-based exchanges to obtain information on 2017 Bronze plans not included in the federal data. When computing average effects across rating areas, we calculate a weighted average of the effects in each rating area using the potentially eligible population. The potentially eligible population is defined as the number of individuals who are either uninsured or insured through the individual market, ineligible for Medicaid or the Children’s Health Insurance Program, and determined to be a legal resident. We estimate this population using the 2010-2012 American Community Survey. All the premium estimates in this report are based on those offered to a 27-year-old non-smoker. Unless otherwise noted, the premium changes do not include any subsidies that are available for middle-to-low income households. In our analysis of subsidized 2017 benchmark plans, we consider the post-subsidy premium for a 27-year-old non-smoker that earns $30,000 per year. Where we consider the implications for families, we calculate the premium for a married couple of 27 year olds with two children. We also use both the 2016 and 2017 income contribution scale and along with 2016 and 2017 federal poverty guidelines for calculating the premium subsidy for all three years. We also assume that household income remains the same. An estimate that included some increase in income would lead to a reduction in premium subsidy.
The ACA employs an age-based community rating which limits charging higher risk, older enrollees’ premiums to three times as much as a low risk, young adult, or a 3:1 ratio. In other words, when selling health insurance, an insurer can only charge a 64-year-old three times the amount that is charged to a 21-year-old. Because of this restriction, age-based rates between 21 and 64 are typically a multiple of the base rate by a factor on a spectrum between three and one. Therefore, there is no real need to consider different ages when determining premium growth as a percentage, because each age is going to see proportional growth. For example, if a 21-year-old’s premium increases by 25 percent, then a 55-year-old’s premium is going to increase by 25 percent also, even though the 55-year-old is being charged more. Under current law, the only way that this could change is if a state adopted a more restrictive age-based community rating which would change the ratio insurers use to calculate rates.
Determining Premium Growth
Each state market operates under different conditions and costs of health insurance vary between different regions for each state. To adjust for varying health care costs in different regions of a state, the states are divided into geographic rating areas that all insurers must use as a part of their rate setting. There are also a variety of plans within each rating area that consumers can purchase, and the enrollment numbers for each of those plans will fluctuate according to several factors. Additionally, the discontinuation of risk corridors and reinsurance for 2017, the health of the pool of insured, and changes in the plans offered can all affect premiums in more indirect ways. Averages mask a lot of this variation; therefore, it is necessary to look at the national insurance marketplace from various viewpoints if any legitimate analysis of premiums is to be made.
In the discussion of health insurance costs, the premiums for the second-lowest cost Silver plan, referred to as the benchmark Silver plan, is often the focus because of its high enrollment numbers—roughly 11 percent of the individual market in 2015.[v] This year, in 498 observed rating areas, the population-weighted average premium for the benchmark Silver plan increased by 21 percent relative to 2016 benchmark plans. However, this number can be misleading as a measure of premium growth because many of the 2017 benchmarks are new plans.
Actual premium growth is likely worse than that as the 2016 benchmarks that still exist in 2017 will see a 27 percent increase. Many of the 2016 benchmark plans no longer exist. In the 498 rating areas considered, only 276 (55 percent) benchmark plans from 2016 are still offered in 2017. Enrollees in those plans will be forced to find a new plan that likely has a different benefit structure and provider network. Also, many 2016 benchmarks that survived are no longer the benchmark in their rating areas. Many consumers receiving cost sharing tax credits will also need to shop for a new plan in these cases.
Bronze Premiums
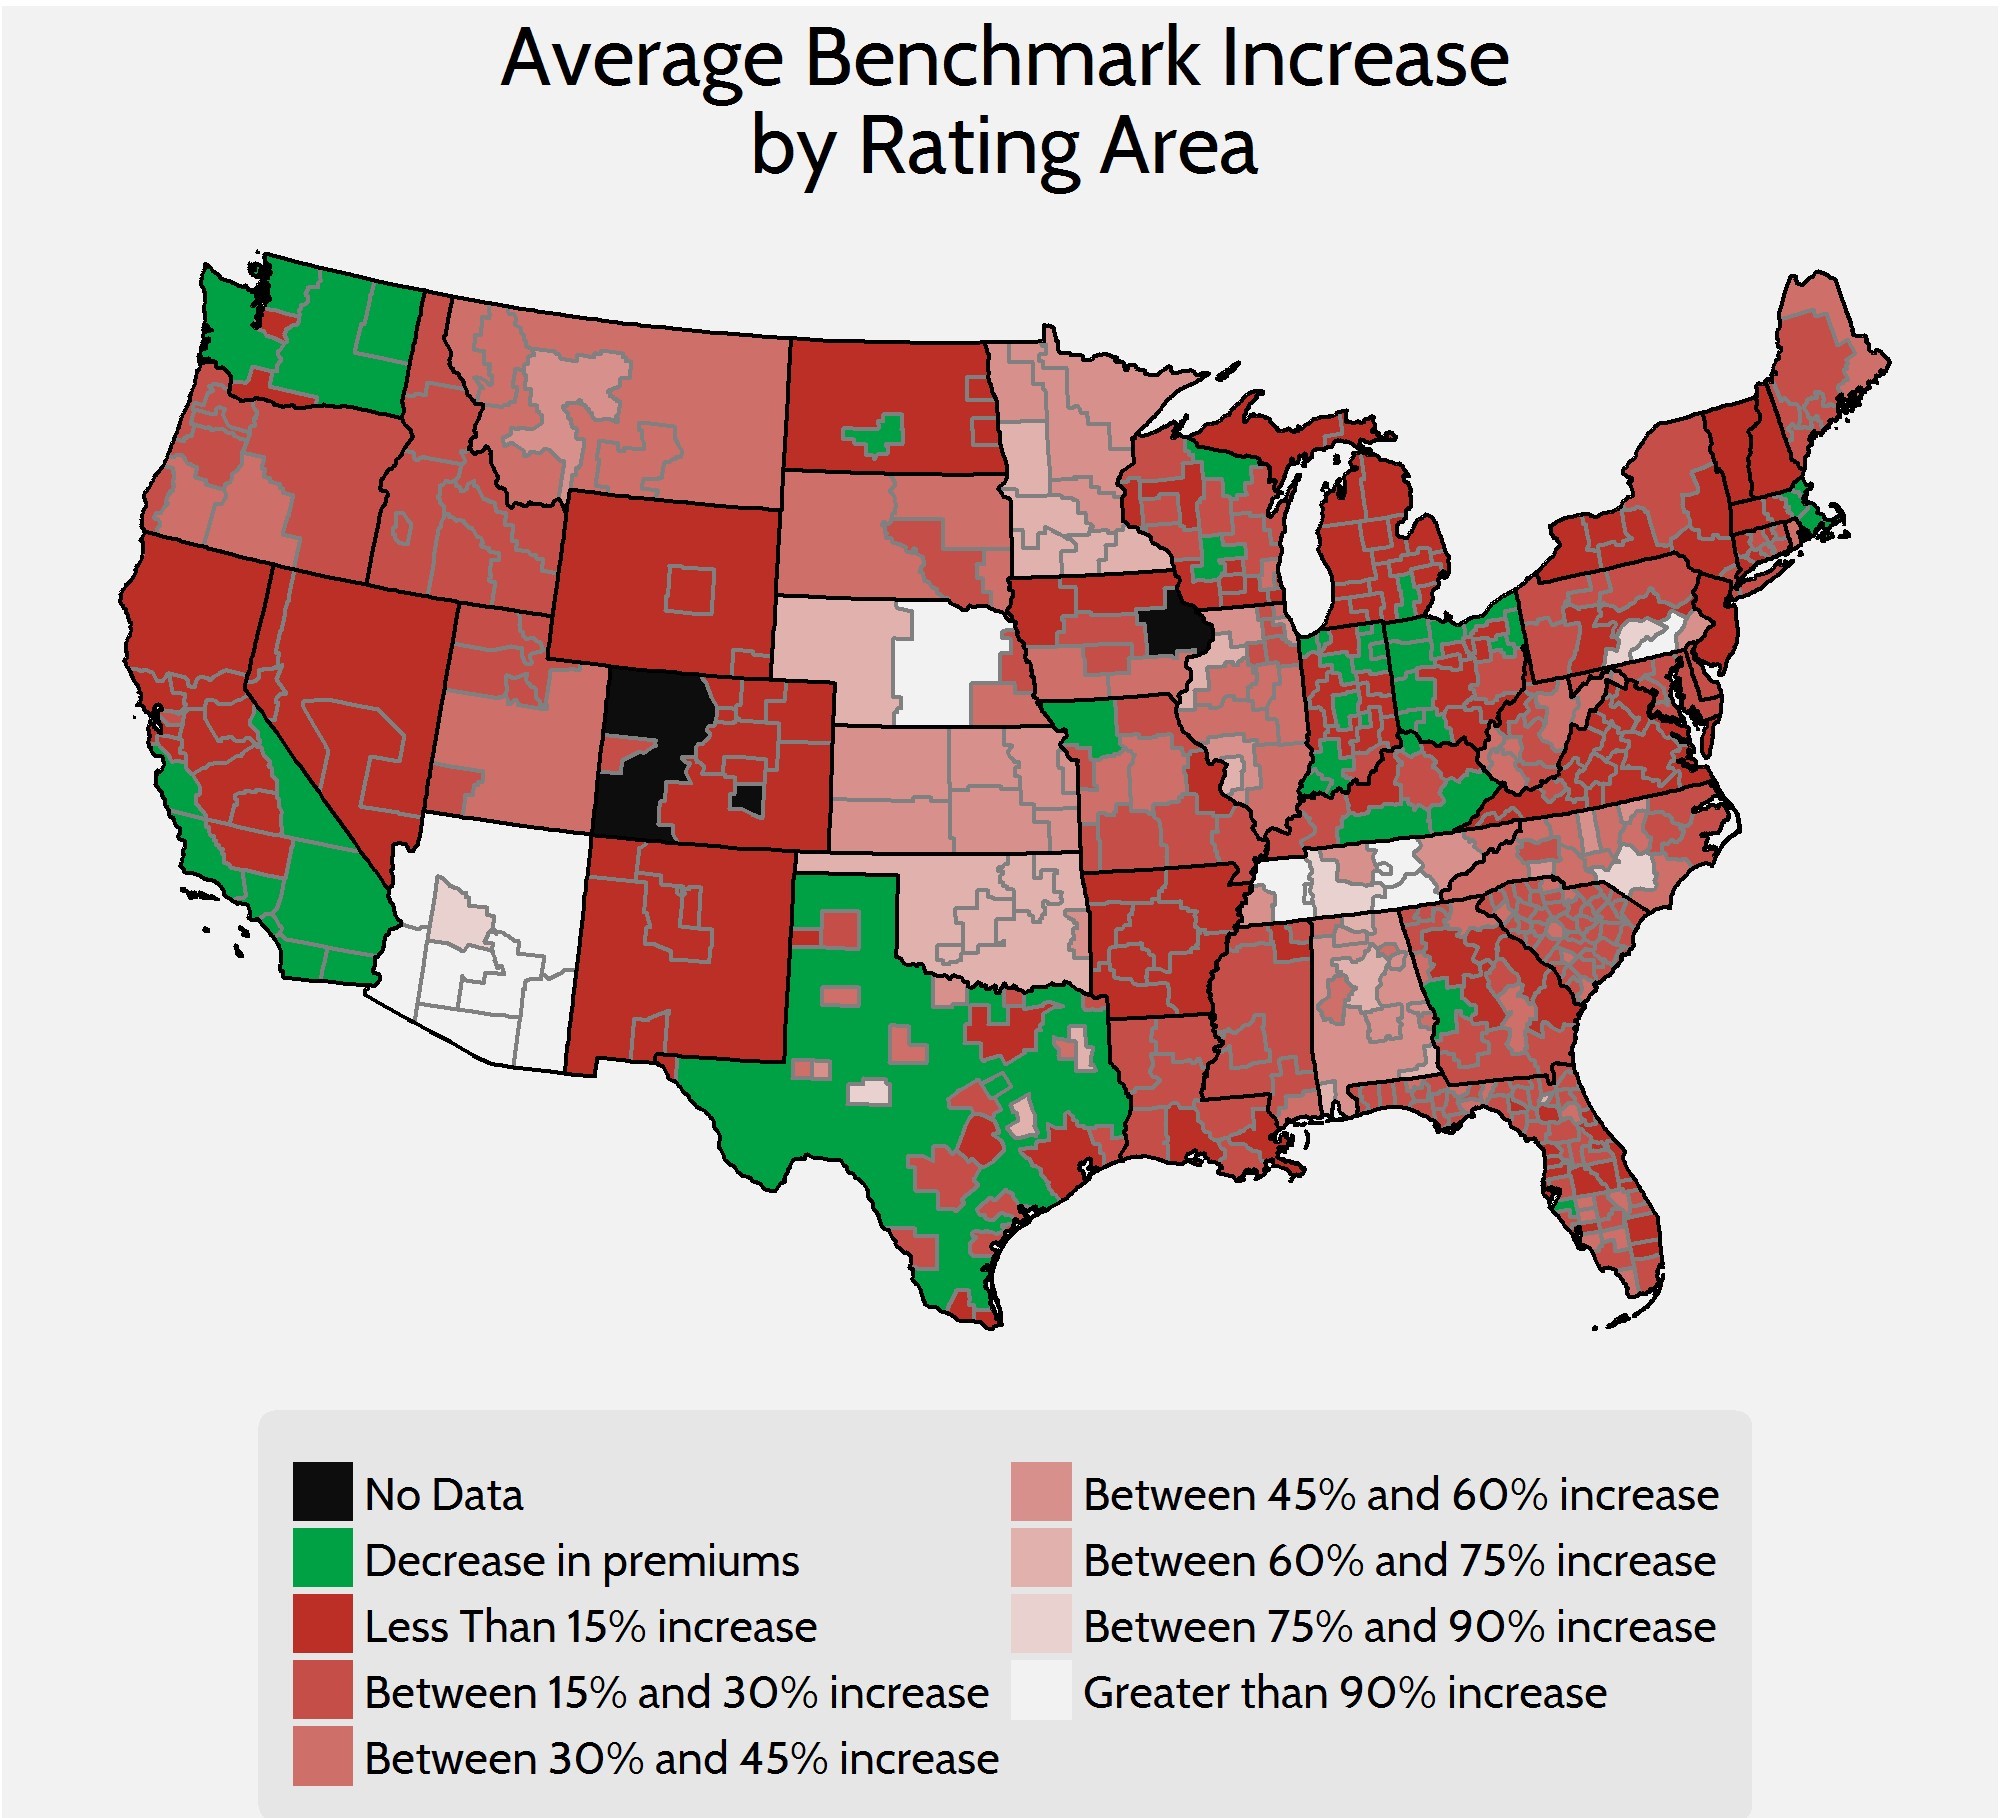
While the average cost of benchmark Silver plans serve as a quick way to gauge the cost of health insurance, those averages mask variation and may not be representative of the entire marketplace. To get a more complete picture of what is happening in the individual marketplace, it is also helpful to look at Bronze plans. Silver plans enrolled roughly 70 percent of the marketplace in 2016, while Bronze plans—the cheapest metal level on the market—enrolled about 22 percent.[vi] In this report, we will look at the lowest-cost Bronze plan in each rating area to get another frame of reference. Using these lower-cost plans as a judge will give us a better understanding of how people are affected throughout the market because lower cost plans are more likely to enroll those ineligible for subsidies and cost sharing. When weighted by population, premiums for the lowest cost Bronze plan have increased by 22 percent between 2016 and 2017.
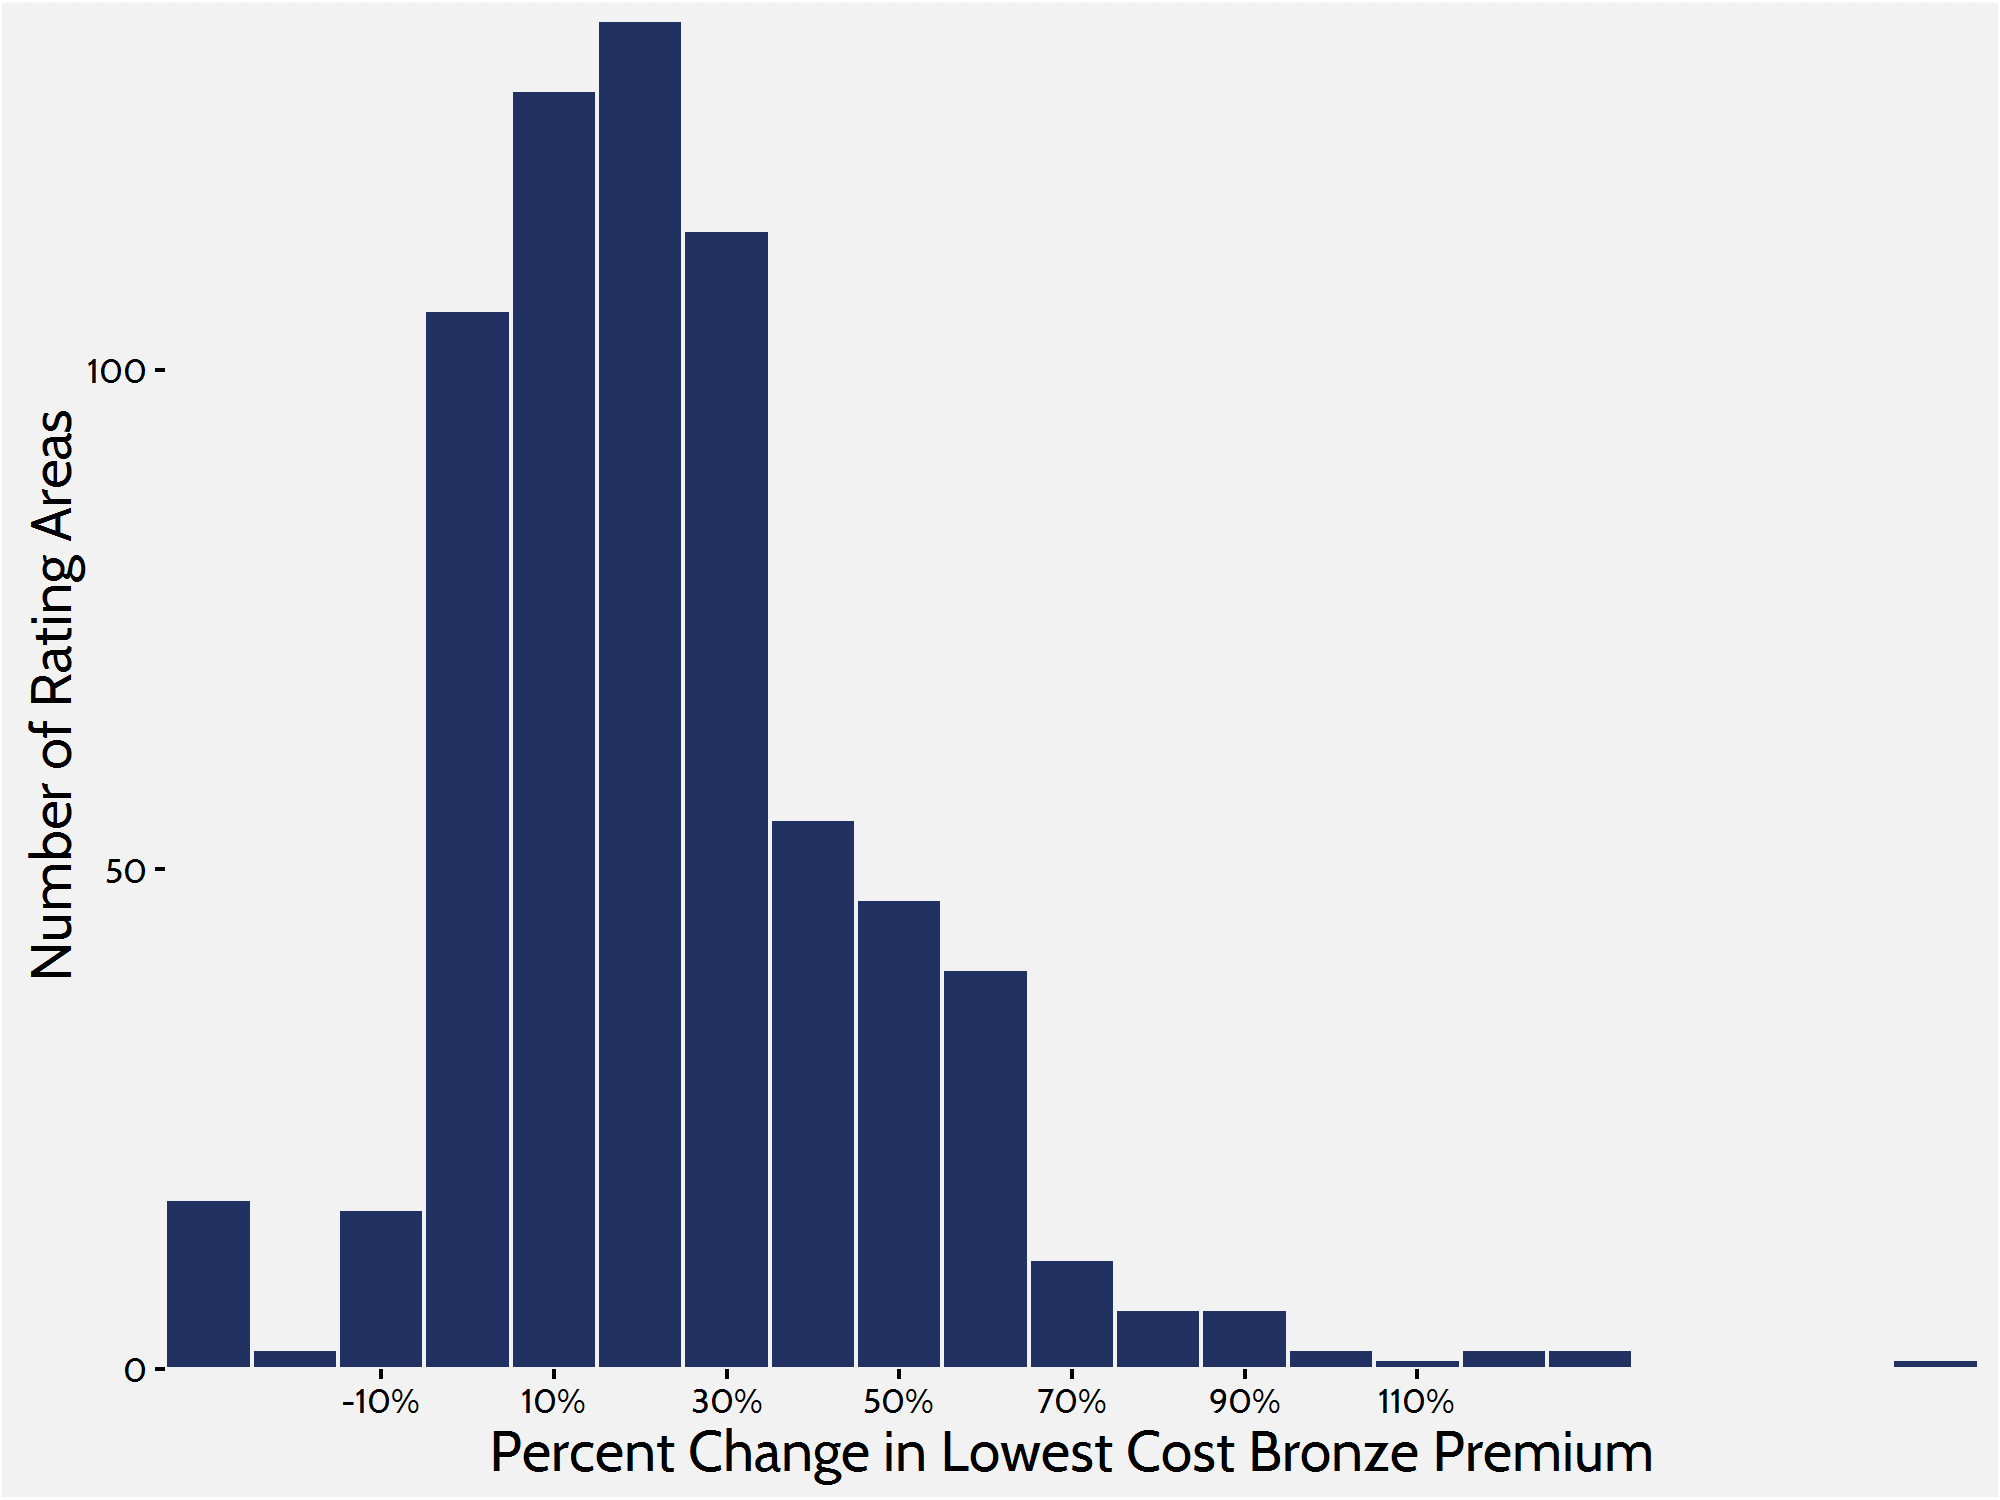
Average rate increases disguise substantial variation across the country which is divided into 501 different rating areas, but much of the variation in 2017 will be seen in the magnitude of premium increases. For example, 180 rating areas will see increases of 30 percent or more while certain rating areas in Arizona and Pennsylvania will see lowest-cost bronze plans more than double from 2016 to 2017. The overwhelming majority of the country will see double digit increases, however, there is a small segment of rating areas that are seeing double digit decreases in lowest-cost Bronze premiums. Five rating areas are seeing decreases greater than 10 percent.
Plan Turnover and its Impacts
In 2016, 61 percent of consumers enrolled in a 2015 plan shopped around for a different plan in 2016.[vii] As in previous years, the administration is encouraging people to do the same. Those people who do not shop around for a new plan will be auto-enrolled in the plan for which they are currently enrolled or a similar cost plan if their current plan is not available. For example, of those who are currently enrolled in a 2016 benchmark Silver plan many must enroll in a new plan in 2017. As mentioned earlier, in 276 of the 498 rating areas, the benchmark plan has changed, and many are no longer offered. The average increase in premiums of 2016 benchmark plans was 27 percent.
This turnover in benchmark plans—and all the other plans on the market—is problematic because it affects both premiums and overall cost of insurance as subsidies change accordingly. Because of this churn, insurers are dealing with different risk pools from year to year, and as premium rates are based off spending from previous years’ risk pools, it is more difficult for insurers to correctly set premiums to offset spending. Another unfortunate outcome of this turnover is the possibility of people being forced to switch health care providers as networks change with plans. And with each new plan comes different cost sharing for consumers, which makes planning for health care costs more difficult.
Insurer Competition
Other federal health care programs designed around subsidized private insurance—such as Medicare Advantage and Medicare Part D—show that competition among insurance companies is an important tool in controlling price. In its first year of open enrollment, research showed that a lack of competition was correlated with higher premiums and $1.7 billion in higher subsidy spending.[viii] Now in the fourth iteration, it is well known that insurers are struggling to make profits and insurers have dropped out of many rating areas. This increasing lack of competition continues to have an impact on premiums and plan offerings.
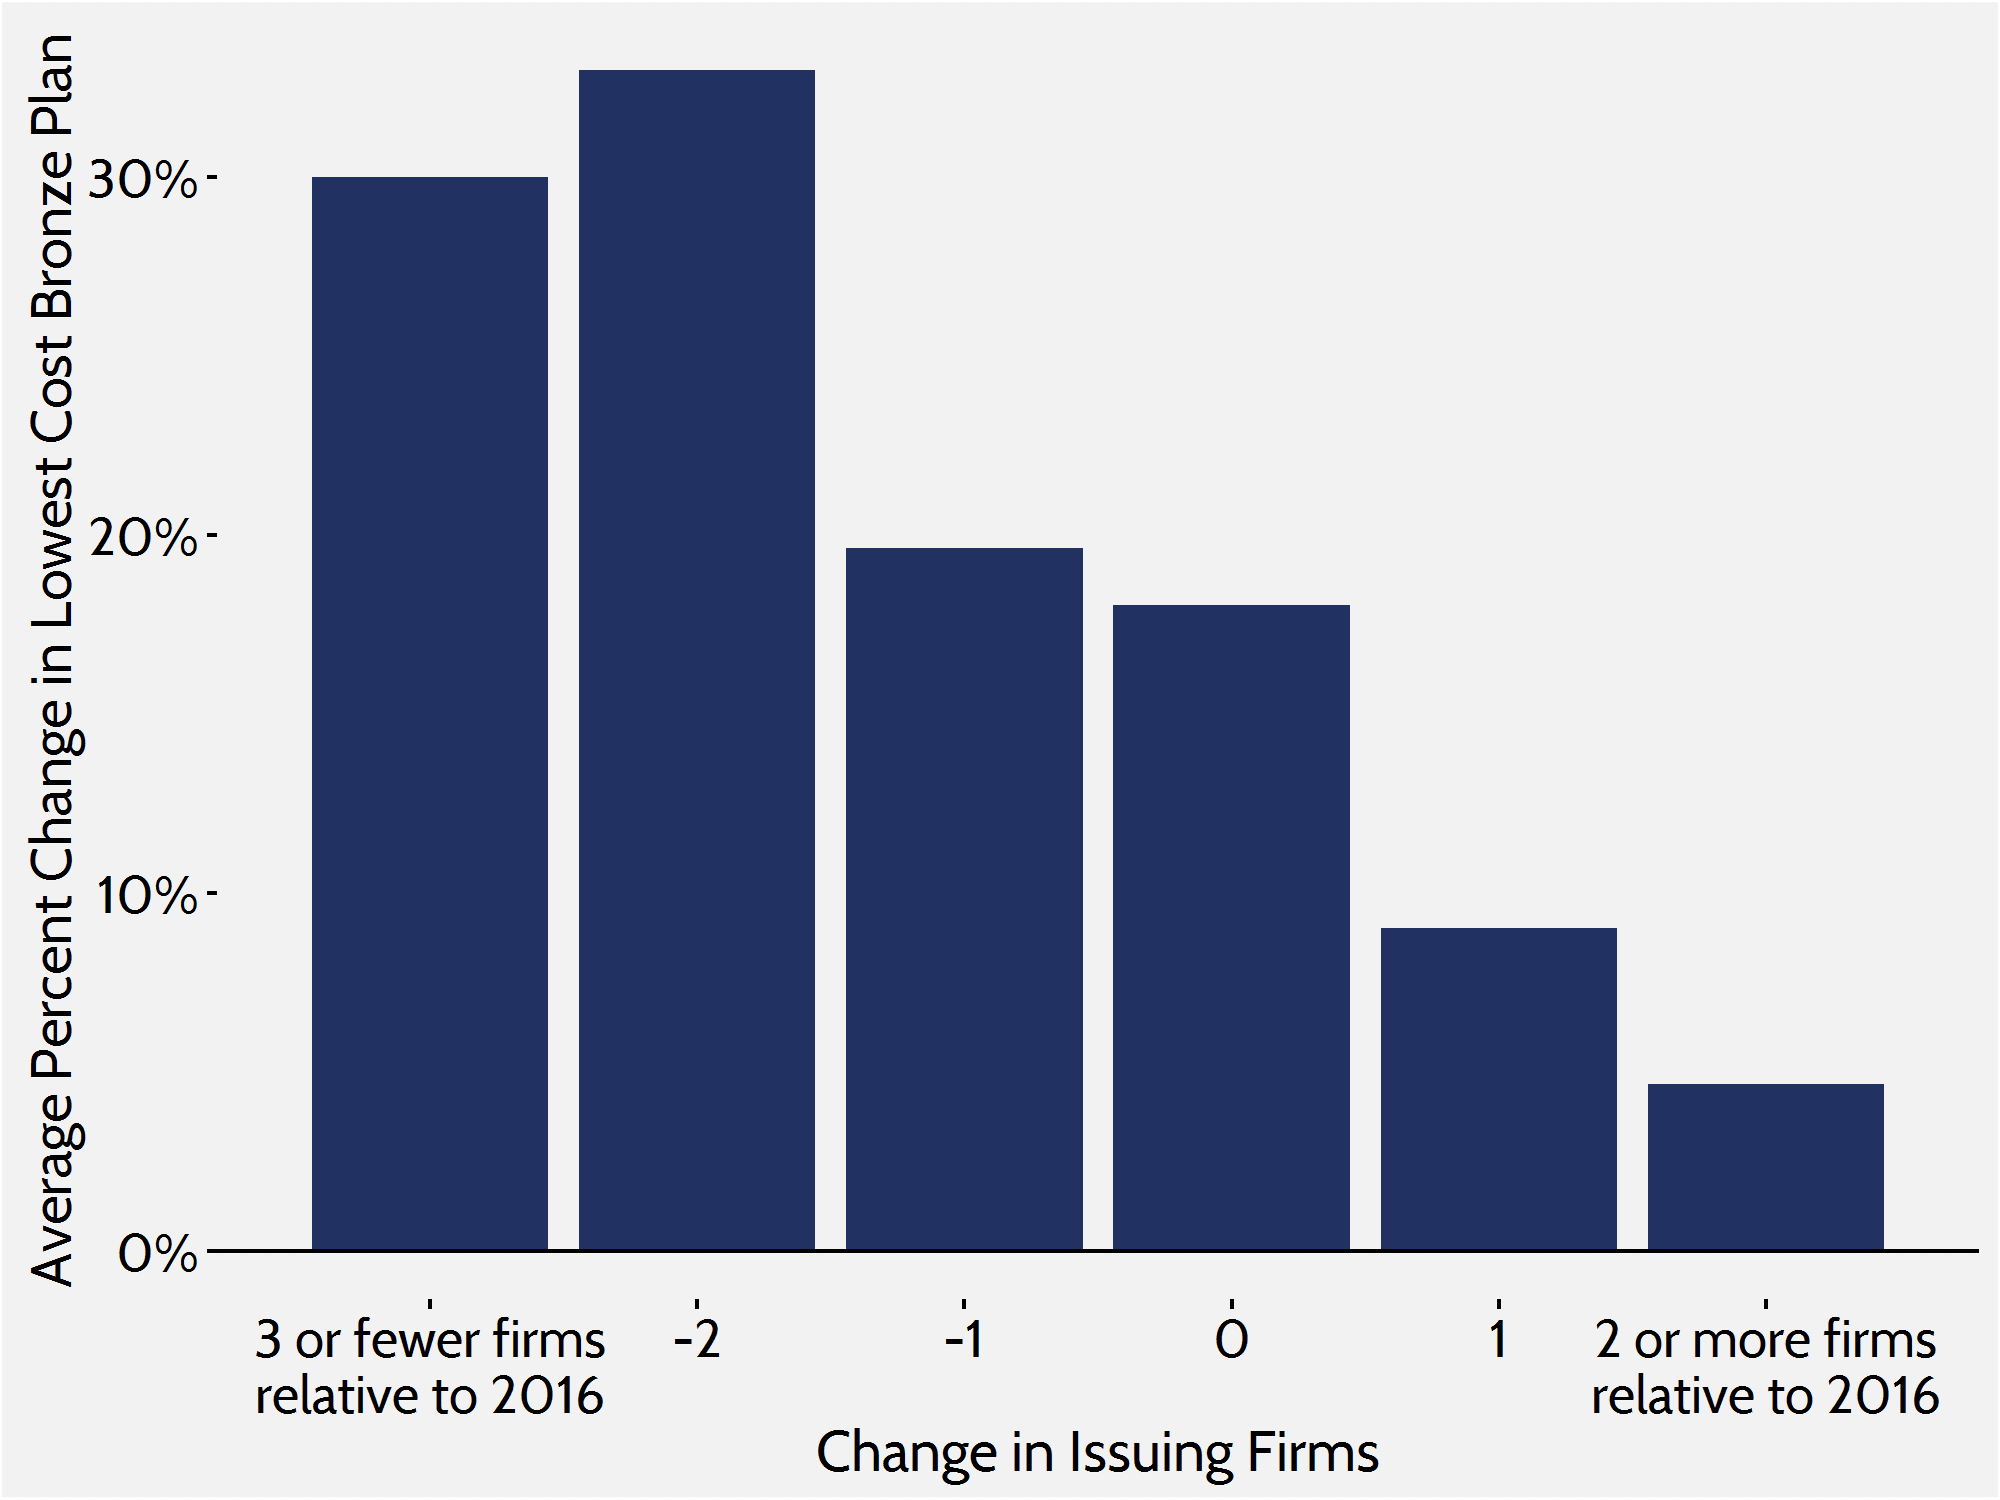
In 2017, only 36 out of 498 rating areas will see an increase in competition while 366 rating areas lost at least one insurer. Of the rating areas that lost insurers, 78 rating areas lost two or more and many regions in Illinois, Ohio, Texas, and Arizona, among others, saw five or more insurers exit their exchanges. This mass exodus of insurers in many rating areas paints the picture of a marketplace that is increasingly hostile to private insurance.
Just as in previous research, we find that increased competition in the marketplace leads to smaller increases in premiums. In rating areas where 2 or more insurers entered the marketplace, the average lowest-cost Bronze premium increased by roughly 5 percent. In areas where there was no growth or a decrease in competition, there was an average increase of 23 percent.
Conclusion
While it is important to remember that the current marketplace structure provided by the ACA is relatively new, the increasingly higher premium growth from year to year—along with decreasing competition—paints a rather bleak picture of the future. If insurers continue to lose money on the exchanges and leave the market, premiums will continue to increase by double digits across the country. While premiums in some areas may not be increasing at a high rate, insurers in those areas will begin to implement higher premium increases to make up for losses sustained elsewhere. Along with those premium increases, federal spending will be expected to grow as advanced premium tax credits and cost sharing reductions increase to make up the difference.
[i] Council of Economic Advisers, “Trends in Health Care Cost Growth and the Role of the Affordable Care Act,” November 2013
[ii] Chu R and Kronick R, “Health Insurance Premium Increases in the Individual Market Since the Passage of the Affordable Care Act,” ASPE Research Brief, February 22, 2013, available at: http://aspe.hhs.gov/health/reports/2013/rateincreaseindvmkt/rb.cfm
[iii] Individual market medical landscape files are available for download at data.healthcare.gov
[iv] Robert Wood Johnson Foundation, “HIX Compare 2015-2016,” available at: http://www.rwjf.org/en/library/research/2015/12/hix-compare-2015-2016-datasets.html
[v] https://www.cms.gov/Newsroom/MediaReleaseDatabase/Fact-sheets/2015-Fact-sheets-items/2015-10-26-2.html
[vi] https://www.cms.gov/Newsroom/MediaReleaseDatabase/Fact-sheets/2016-Fact-sheets-items/2016-06-30.html
[vii] https://aspe.hhs.gov/sites/default/files/pdf/187866/Finalenrollment2016.pdf
[viii] Gruber J, Dafny L, and Ody C, “More Insurers Lower Premiums: Evidence from Initial Pricing in the Health Insurance Marketplaces,” NBER Working Paper No. 20140, May 2014, available at: http://www.nber.org/papers/w20140