Research
June 2, 2016
Understanding Pharmaceutical Drug Costs
Executive Summary
With almost half of the U.S. population using prescription medications, expensive sticker prices on certain medications have led policymakers to address drug prices through proposed legislation and regulation. This paper examines the various factors that influence how drugs are priced–including regulatory burdens and health care payment models–in order to provide an understanding of these prices in the larger picture of American health care.
Introduction
Considerable public attention is focused on “rising drug costs.” However, there is very little precision around the notion of “rising drug costs,” which makes it difficult to determine if there is an actual policy problem, its size, and the scope for public policy to improve matters.
For example, rising drug costs could mean an increase in prescription drug expenditures as a percentage of National Health Expenditures (NHE). Or, it could be rising national reliance on prescription drugs, or broader access to them. It might be a narrow definition focused on the sales prices of drug developers and manufacturers. Alternatively, it might not be all drugs, but instead the high prices of specialty drugs. Finally, the problem may be the changing share of their prescription drug expenses that individuals must pay.
Before undertaking a governmental intervention in the pharmaceutical market, one first must establish what is driving drug costs and whether legislative solutions would be effective or appropriate.
This paper examines these various potential aspects of “rising drug costs” in an attempt to better understand the issue and illuminate opportunities to provide solutions. AAF finds that the rise in drug costs is a symptom, rather than the cause, of a technological and generational shift in the way we treat and live with disease. Future increases in out-of-pocket drug spending will be the result of regulatory pressure to maintain a certain actuarial value of insurance products by shifting costs from insurers to individuals.
Changes in National Health Expenditures
Since the 1960s, with the establishment of the modern health care systems and the creation of Medicare, the share of NHE attributable to prescription drug spending has changed very little. However, in the years between 1960 and 1980, advances in technology and expanded insurance coverage of hospital stays contributed to a shift of NHE towards hospital stays. In the 1980s, that trend began to reverse as new pharmaceuticals became widely available for the treatment of many of the most prevalent diseases in American society. The charts below demonstrate that the availability of advanced pharmacological treatments has likely contributed to the slowdown in other expenditures. As pharmaceutical growth began to level out to roughly the same levels as the 1960s, so did other NHE categories.[1]
Although pharmaceutical expenditures have stayed at or below 10 percent of health expenditures, at least for outpatient care, the decrease in spending on hospital stays and other health professionals is correlated with the increase in pharmaceutical spending. Viewed from this perspective, there appears to be little support for a radical rise in drug spending in the data.
Changes in the Way We Use Prescription Drugs
The advent of new, life-saving drugs, though rare, can be revolutionary. The early 20th Century discovery of penicillin and other antibiotics led to the removal of pneumonia, tuberculosis, and septicemia from the list of top causes of American deaths and made hospitals much safer.[2] Vaccinations contributed to the near eradication of many life-threatening infections and early childhood diseases.[3] In the second half of the last century, pharmaceutical developments in the treatment of cardiovascular diseases contributed to a dramatic reduction in circulatory-system related deaths.[4]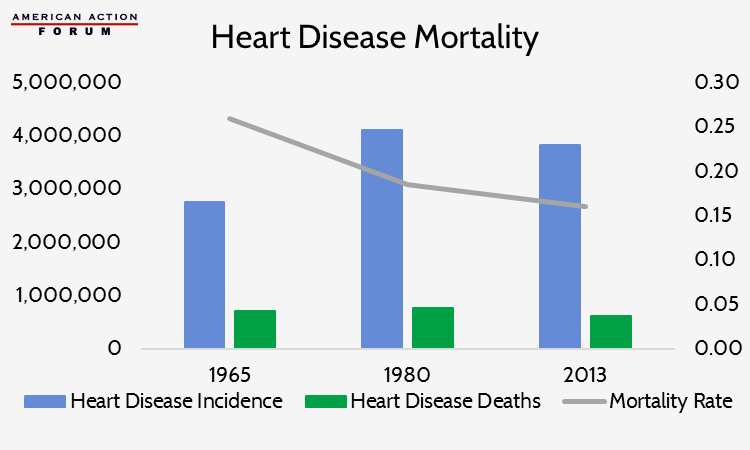
As treatments are developed to reduce the negative health impacts of the nation’s leading cause of death, new illnesses replace them.[5],[6]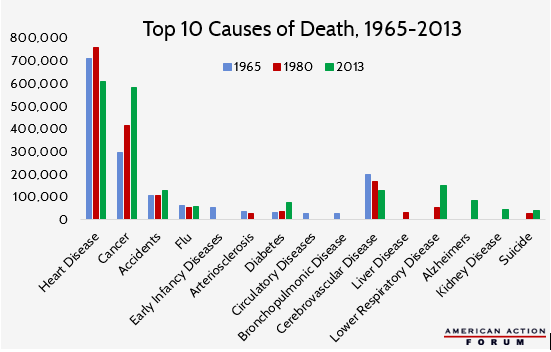
Lower respiratory disease and Alzheimer’s disease have become the fourth and fifth leading causes of natural deaths in America (after heart disease, cancer, and stroke), yet these late-life illnesses only entered the ten leading causes of death in the 1980s and later.[7] Late-life diagnoses also help explain the increase of cancer-related deaths. In recent years the median age of cancer diagnosis was 65 years old, but in 1965 the average life expectancy was only 69.7 years.[8]
Changing patterns of morbidity and mortality will generate a new pattern of pharmaceutical use and, in particular, the need for new drugs. These drugs and their prices may be perceived as a cost pressure in the health care system.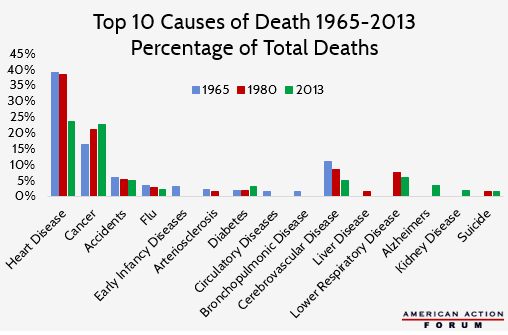
Treating Chronic Disease
The use of pharmaceuticals has done more than extend American life expectancy and reduce hospitalizations, it has also enabled health care providers and patients to better manage chronic illnesses. For example, heart disease and diabetes (both of which are becoming more prevalent in the U.S. as a result of dietary and lifestyle changes in the past century) once amounted to sentences of a short life with disabilities.[9] Today, both diagnoses are generally manageable thanks to pharmaceutical treatments. In fact, as of 2012, about half of the United States’ adult population had been diagnosed with at least one chronic health condition, and one in four had two or more chronic conditions.[10]
Managing these chronic conditions is an expensive proposition that relies primarily on the availability of medication. Over 75 percent of U.S. health care spending goes towards treatment of chronic disease; 98 percent of Medicare and 83 percent of Medicaid spending goes towards providing care for the chronically ill.[11] Eighty-six percent of all health care spending is for patients with one or more chronic disease.[12]
In 2012, 48.7 percent of the U.S. population reported using at least one prescription drug in the past 30 days, and over 10 percent reported using five or more prescription drugs in the past 30 days.[13] This report’s findings are similar to a 2010 report that over 75 percent of physician visits resulted in a prescription being written, and over 2.6 billion prescriptions were filled in the U.S. during that time period. Hospital visits also resulted in a prescription between 72 and 80 percent of the time, generating 615.4 million prescriptions in 2011.[14]
Increased Life Expectancy
The burden of disease has increased with the lengthened life expectancy we have experienced during the past 50 years and also by the unprecedented number of seniors in the American health care system. Baby boomers, those born between the end of WWII and 1964, represent 20 percent of the American population.[15] As they age, the financial burden of maintaining a high quality of life with chronic conditions will inevitably disproportionately increase the growth of pharmaceutical health care spending.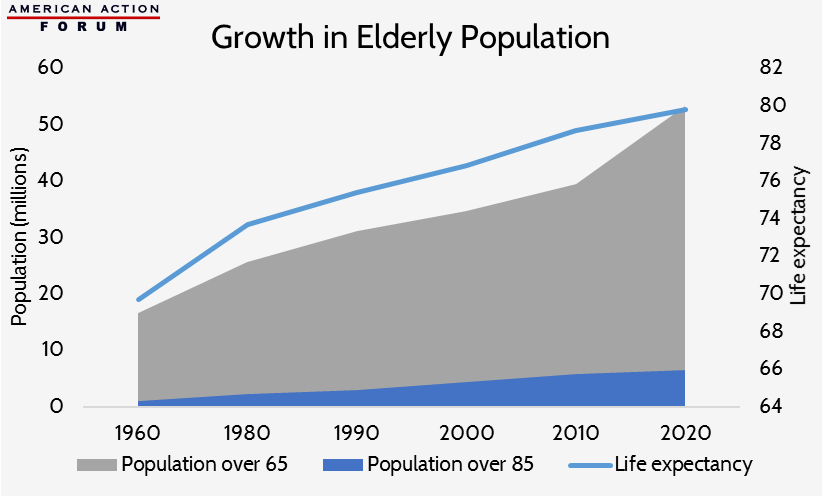
In sum, the data suggest that there have been, and likely will continue to be, shifts in the types of drugs and their usage. New and innovative drugs may appear to be an unceasing addition to the nation’s health care bill, but these are counterbalanced by savings in other areas of health care and extended life expectancy.
Changes in the Cost of Producing New Drugs
Producing new drugs is extraordinarily expensive and time consuming. A Tufts University study found that the average cost to bring just one drug to the market is about $2.6 billion.[16] It takes an average of 15 years from the time a drug developer first begins testing a new formula until it is approved by the FDA.[17] Only 1 in 1,000 drug formulas will ever enter pre-clinical testing, and of those, roughly 8 percent will ultimately receive FDA approval.[18]
Scientists and health professionals who develop pharmaceuticals that receive FDA approval are often faced with what has become known as the Red Queen Effect. Named after Lewis Caroll’s iconic scene in Through the Looking Glass where the Queen states “Now, here, you see, it takes all the running you can do, to keep in the same place,”[19] the term describes medicine’s constant need to progress in order to hold its position relative to rapidly evolving diseases.[20] Breakthrough drugs are very rare, and a huge amount of resources must constantly be invested in developing next generation drugs to treat infections that have developed immunities to treatments that are already on the market. These new drugs, however, are temporarily in competition with the older generations, and therefore may bring in limited revenue.
Manufacturers’ ability to recoup the cost of bringing a new drug to market is further inhibited by regulations in other countries. For example, many countries with single-payer health care systems impose price caps on pharmaceutical drugs; other countries with their own manufacturing interests may deny drug manufacturers exclusivity periods and allow immediate competition from generics. Even those nations that have competition in their health insurance sector have pricing schemes that place artificial downward pressure on manufacturers. These countries are essentially free riders benefitting from the positive incentives created by the United States’ relatively free market. This situation does create a legitimate policy problem for American consumers, but one that is difficult to address with our laws and regulations alone. As the chart below demonstrates however, as a percentage of NHE and GDP, the US is not actually an outlier when it comes to drug spending.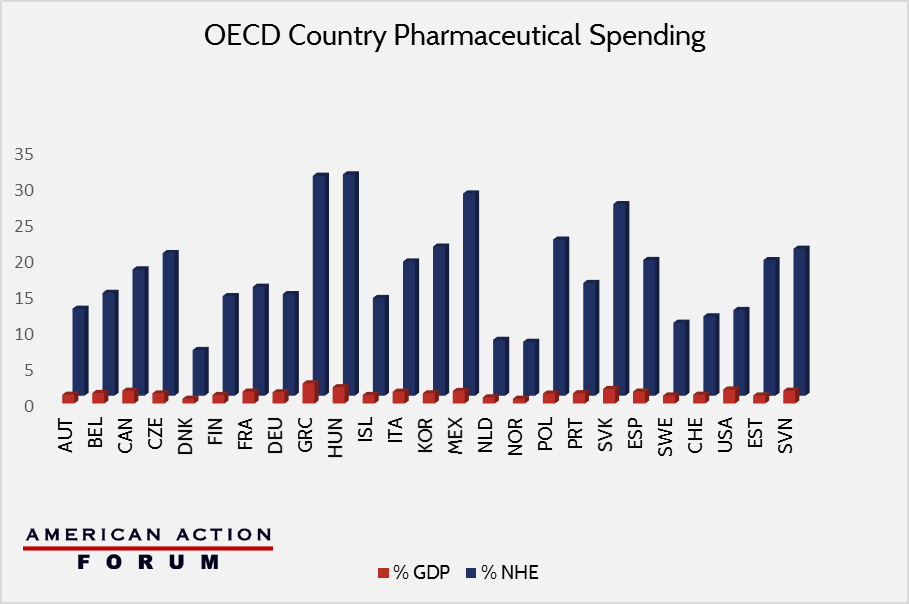
Though the U.S. market does create an environment where manufacturers are willing to invest in necessary research and development hoping for a return later, more and more government regulations are reducing that incentive. Programs such as Medicaid preferred provider status, the 340B program, and Medicaid rebates interfere with the market incentives and shift the high cost of drug development onto the minority of purchasers with private insurance–or none at all–or back onto the manufacturer who will then be less likely to reinvest in new products.
One solution is to eliminate government policies that tend to push prices up.
Changes in the Types of Drugs We Use
The 21st century has seen a significant shift towards the use of “specialty drugs”. There is no precise definition of a specialty drug. It sometimes refers to a drug that requires special handling and must be administered by a doctor. It can also mean patients using such a drug require monitoring or follow-up care. Alternatively, it is sometimes used to indicate that the drug is meant to treat a specific class of disease (such as cancer, autoimmune disease, HIV, Hepatitis C, or human growth deficiencies). However, when it comes to purchasing specialty drugs, the term is generally understood to refer to any drug that is priced above $600 per month, though that dollar amount will increase to $670 beginning in 2017.[21]
Since the definition is based on prices, it is hardly surprising that many specialty drugs find themselves listed among the most expensive in the nation. In fact, about half of the top 80 most expensive drugs nationally are specialty drugs, and that number is increasing annually.[22]
In 2010, the U.S. spent just over $11.5 billion on the top 25 specialty drugs. By 2014 that number had increased to about $19.5 billion.[23]
A Case Study
The new (and infamous) Hepatitis C (Hep C) treatment, Sovaldi, contributed over $3 billion to 2014 expenditures. Harvoni, a Sovaldi competitor released for the first time later in 2014, was responsible for an additional $700 million in spending. Olysio, an older treatment for Hep C, itself made up about one-quarter of specialty drug sales in 2010 and $2.7 billion in spending in 2014.[24] This rate of spending on only three drugs is eye-catching, but Sovalidi and Harvoni offer something no previous treatments could: up to 90 percent cure rates in just 12 weeks, and with no major side effects.[25] Previous treatments offered only a 30-60 percent cure rate (compared to the 25 percent natural survival rate), but required roughly a year of treatments that induced side effects so severe that many patients refused to adhere to the treatment, preferring the painful, life-threatening disease instead.
The unusually high cost of Sovaldi has been a political talking point recently: cited as proof that drug companies are concerned only about profits and that the free market is unable to control rising drug costs. But since Gilead’s launch of Sovaldi and Harvoni, AbbVie has released its own Hep C treatment that is over $10,000 cheaper than Sovaldi. In January 2016, Merk also entered the market with its Hep C drug that costs nearly $40,000 less than Sovaldi.[26] Within a year and a half, the market has been able to reduce the cost of state of the art Hep C treatments by two-thirds by encouraging innovation, rather than discouraging it through artificial price controls.
Specialty Drugs and the Rate of Pharmaceutical Spending Growth
Specialty drugs have changed the provision of health care in America, and have likewise increased pharmaceutical spending. But it is important to keep in mind that with the possible exception of Sovaldi, which the chart below demonstrates to be an extreme outlier, specialty drug prices do not substantially impact the rate of increase in national drug expenditures. Specialty drugs are subject to all of the same forces that drive traditional drug spending, and behave accordingly. [27]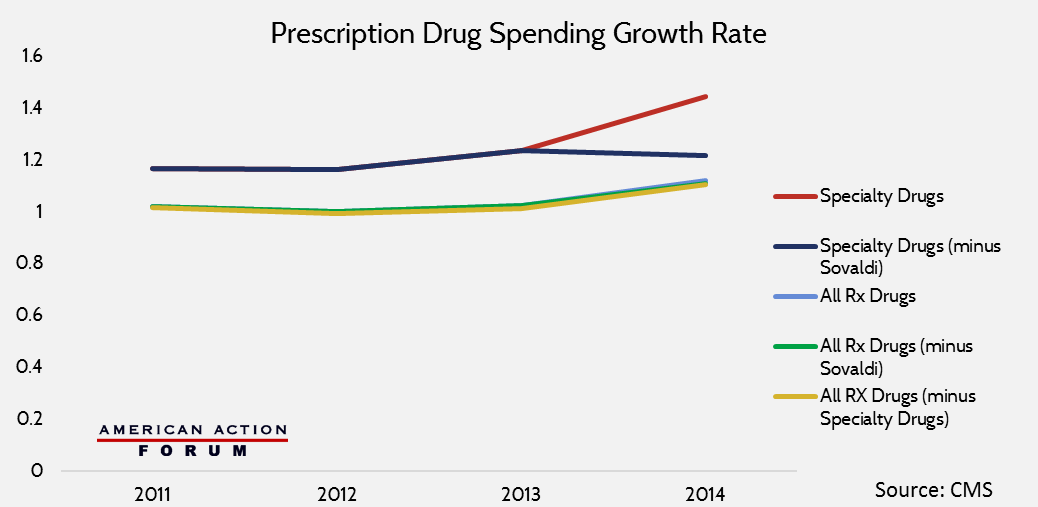
The reality is that specialty drugs are often prescribed to comparably few numbers of patients with very specific and otherwise untreatable diseases. The cumulative impact of these drugs on the rate of pharmaceutical growth is negligible, but their medical benefits, for many, are immeasurable.
Changes in How Much Individuals Pay for Drugs
All of the perspectives offered thus far have examined why drugs cost what they do, and why we as a nation continue to spend so much money on pharmacological interventions. The final, and perhaps most important consideration is how individuals experience purchasing prescription drugs.
When examined from a historical perspective, 21st Century Americans have enjoyed unparalleled decreases in their average out-of-pocket spending on prescription drugs, despite rising prices.
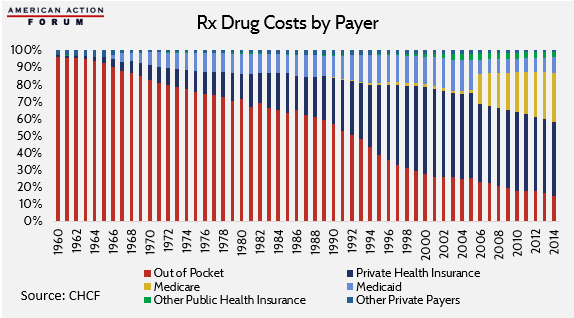
Individual out-of-pocket costs have been declining as a percentage of total spending on drugs for the past 50 years.[28] In 2014, these expenses reached an all-time average low of about 15 percent. This decrease in out-of-pocket spending on drugs as a portion of total expenditures, despite increasing sales prices, is a result of the growth in the scope of insurance coverage.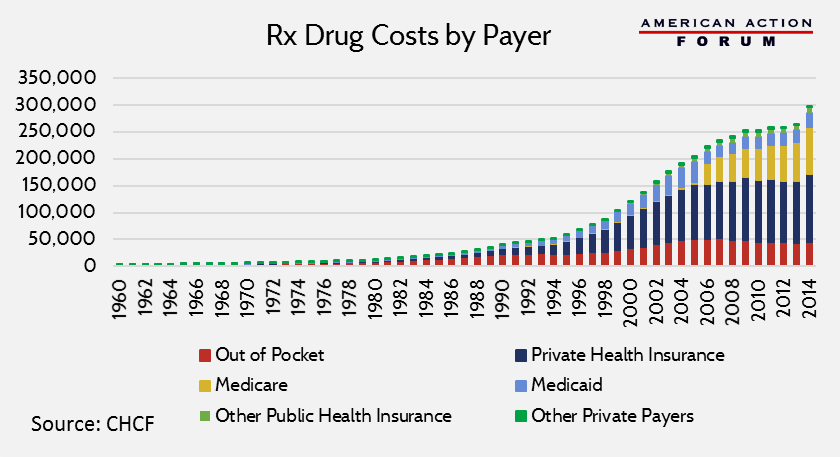
In fact, total out-of-pocket spending has been steadily decreasing since 2005. However, the American Action Forum anticipates that as a result of the Affordable Care Act’s actuarial value incentives in the health insurance exchanges, this trend will likely reverse itself based on forthcoming data from the 2014 plan year.
Conclusion
There has recently been much interest in reducing drug costs with little discussion of what that means. Understanding the many intertwined aspects of pharmaceutical development and pricing is necessary to finding any effective solution that reduces prices without stymieing innovation.
[1] https://www.cms.gov/Research-Statistics-Data-and-Systems/Statistics-Trends-and-Reports/NationalHealthExpendData/index.html.
[2] http://www.cdc.gov/nchs/data/dvs/lead1900_98.pdf; http://www.newworldencyclopedia.org/entry/Alexander_Fleming
[3] http://www.nejm.org/doi/full/10.1056/NEJMp1113569
[4] http://circ.ahajournals.org/content/103/20/2428.long; https://www.nhlbi.nih.gov/files/docs/research/2012_ChartBook_508.pdf
[5] http://www.cdc.gov/nchs/data/dvs/lead1900_98.pdf
[6] Charts estimating COD have been edited to approximate death rates before and after changes to the IMD diagnosis criteria for various diseases.
[7] http://www.cdc.gov/nchs/data/dvs/lead1900_98.pdf
[8] http://www.cancer.org/acs/groups/content/@editorial/documents/document/acspc-044552.pdf; http://www.cdc.gov/nchs/data/hus/hus14.pdf#103
[9] http://www.cdc.gov/nchs/data/hus/hus14.pdf#103; http://www.cdc.gov/nchs/data/dvs/lead1900_98.pdf; http://www.fightchronicdisease.org/sites/fightchronicdisease.org/files/docs/GrowingCrisisofChronicDiseaseintheUSfactsheet_81009.pdf
[10] http://www.partnershipforsolutions.org/DMS/files/chronicbook2004.pdf
[11] http://www.partnershipforsolutions.org/DMS/files/chronicbook2004.pdf
[12] http://www.ahrq.gov/sites/default/files/wysiwyg/professionals/prevention-chronic-care/decision/mcc/mccchartbook.pdf
[13] http://www.cdc.gov/nchs/fastats/drug-use-therapeutic.htm
[14] http://www.cdc.gov/nchs/fastats/drug-use-therapeutic.htm
[15] http://www.prb.org/pdf11/aging-in-america.pdf
[16] http://csdd.tufts.edu/news/complete_story/pr_tufts_csdd_2014_cost_study
[17] http://www.fdareview.org/approval_process.shtml
[18] http://www.fdareview.org/approval_process.shtml
[19] http://www.gutenberg.org/files/12/12-h/12-h.htm
[20] http://www.indiana.edu/~curtweb/Research/R.ed_Queen%20hyp.html
[21] http://www.specialtyrxtoolkit.com/specialty-pharmacy-101/no-single-definition-specialty-drugs, https://www.cms.gov/Medicare/Health-Plans/MedicareAdvtgSpecRateStats/Downloads/Announcement2017.pdf.
[22] https://www.cms.gov/Research-Statistics-Data-and-Systems/Statistics-Trends-and-Reports/Information-on-Prescription-Drugs/index.html.
[23] https://www.cms.gov/Research-Statistics-Data-and-Systems/Statistics-Trends-and-Reports/Information-on-Prescription-Drugs/index.html.
[24] https://www.cms.gov/Research-Statistics-Data-and-Systems/Statistics-Trends-and-Reports/Information-on-Prescription-Drugs/index.html.
[25] http://www.hoover.org/research/defense-expensive-drugs; http://www.hepatitisc.uw.edu/page/treatment/drugs/sofosbuvir-drug.
[26] http://www.mercknewsroom.com/news-release/prescription-medicine-news/merck-receives-fda-approval-zepatier-elbasvir-and-grazoprevi.
[27] https://www.cms.gov/Research-Statistics-Data-and-Systems/Statistics-Trends-and-Reports/Information-on-Prescription-Drugs/index.html; https://www.cms.gov/Research-Statistics-Data-and-Systems/Statistics-Trends-and-Reports/NationalHealthExpendData/index.html.
[28] http://www.chcf.org/publications/2015/12/data-viz-hcc-national.