


Testimony
October 16, 2019
Hearing to Discuss Controversy Over Measuring Economic Inequality
Testimony to the Joint Economic Committee, United States Congress
* The views expressed here are my own and do not represent the position of the American Action Forum. I am indebted to my colleague Gordon Gray for his invaluable assistance.
Introduction
Chairman Lee, Vice Chair Maloney, and members of the Committee, I am honored to have the opportunity to testify on the state of the science of measuring income inequality and its implications for public policy. Inequality has been famously described as the “defining issue of our time” and has been deployed as a rationale for significant federal policy changes, particularly with respect to taxation. But the casual adoption of policies on the basis of inequality belies the serious disagreement in the research community over the state of understanding of the level and changes in inequality.
In my testimony, I wish to make three simple points:
- There is no consensus in the research literature on the measurement of inequality, the level of inequality, or recent changes in inequality.
- Policies predicated on specific inequality goals therefore suffer from critical flaws: Advocates cannot accurately describe the starting point, the desired end point, or the benefits and costs of getting from here to there.
- Given these challenges to policies designed to reduce inequality, lawmakers could instead focus on the component of inequality-reduction that has uniform support: reducing poverty and raising the standard of living for working Americans.
Let me discuss these in turn.
Approaches to Measuring Income Inequality
In 2003, Drs. Thomas Piketty and Emmanuel Saez published “Income Inequality in the United States,” which found that income going to the top 1 percent nearly doubled over the period 1979-1998.[1] The authors have since updated these findings, which present still higher shares of income accruing to the “one percent.” In the words of Vox, “It’s hard to overstate the influence of this line of research.”[2]
President Obama observed that inequality was the “defining issue of our time” in a State of the Union address. Reducing inequality for its own sake is now regularly cited by advocates as a worthwhile policy, and sweeping generalizations about inequality pervade the public-policy debate. What has gotten lost is a critical evaluation of the science of measuring income and, by extension, income inequality. A serious examination of that research reveals that despite widespread and popular embrace of one strand of this literature – the recent New York Times piece on historical tax rates, for example – there is no expert consensus view on the level of, or recent changes in, income inequality in the United States.[3] That observation alone should instill some humility in policymakers in pursuing policies designed to address inequality for its own ends. Moreover, it is also the case that the estimates of inequality presented by the authors of the original 2003 study and its subsequent iterations are outliers in the literature.
Before examining the specifics on any one study, it is important to think about the definition of income. First, popular discussions on the topic of inequality frequently conflate wealth (the stock of resources owned) and income (the flow of resources over a specific period).
This testimony largely focuses on measures of income inequality. Even then, however, there are a wide range of variations in what is measured as income. Studies also differ with respect to whose income is measured. Should the basic unit of analysis be a household? A taxpayer? Something else? Finally, inflation changes the real value of income over time, and how it is accounted for affects measurements of income, yet there is divergence here as well over how to control for inflation. On top of these problems is the reality that the data are imperfect, and studies use different sources for determining individual and household income.
At the most basic level, income can be understood as cash that individuals earn or otherwise receive over the course of the year.[4] This income can include tips, wages, interest, and any number of other form of receipts. But even this simple definition of income becomes complicated. The Congressional Budget Office (CBO), for example, includes in labor income: “Cash wages and salaries, including those allocated by employees to 401(k) plans; employer-paid health insurance premiums (as measured by the Current Population Survey); the employer’s share of Social Security, Medicare, and federal unemployment insurance payroll taxes; and the share of corporate income taxes borne by workers.”[5] This definition of just once source of income involves several assumptions and assignments – and is inextricably linked to federal policy. Specifically, this definition contemplates payroll taxation, corporate taxation, and federal entitlement programs.
This basic measure is already quite complex, but hardly tells the whole story of the economic resources that can accrue to individuals and households over the course of the year. Here, researchers often diverge. Some researchers define income as pre-tax. Other researchers use post-tax measures. Some researchers include federal cash transfer programs such as Social Security and Unemployment Insurance. Still others include non-cash transfer programs such as Supplemental Nutrition Assistance Program benefits (SNAP) and major federal health programs. Each researcher has a rationale for the inclusion or exclusion of these additional income sources. I note them here to highlight that there are very real technical differences among income measures that should caution observers about the reliance on any one measure. As the Urban Institute’s Stephen Rose observes, “Simply, there is not methodological agreement between the studies’ income measures.”[6]
With each additional source of income, researchers must rely on additional sources of data, potentially with different basic units of analysis. Some studies use tax units as the unit of analysis, while others use households. In addition, some studies adjust for household size. These adjustments can have a significant effect on a household’s relative position on the income scale.[7]
To the extent these studies report on income trends over time, they must control for inflation. Here, researchers again diverge. Some researchers use standard consumer price index (CPI-U-RS), while others chose to use the personal consumption expenditure (PCE) deflator. The key distinction is that, essentially, the use of the PCE, all else equal, will tend to show higher income growth across over time, as opposed to inflation, than the CPI-U-RS.
Summary of Findings and Methodological Choices in Income-Inequality Studies[8]

The above table presents several leading income-inequality studies and describes the key assumptions made related to the chosen concept of income, unit of analysis, and price deflator. The table also summarizes the studies’ findings by presenting the change in median income found by these studies.
Perhaps the most remarkable observation about the original Piketty and Saez study is that its core finding is a conspicuous outlier. This observation remains true when comparing other measurements of inequality as well, such as share of income captured by higher income deciles and percentiles. It is remarkable that when the authors embarked on a new measurement of inequality, with Dr. Zucman in 2018, they found that median incomes over the period 1979-2014 was 41 percentage points higher than that of their original finding. This departure, stemming from significant methodological changes from their previous, oft-cited, work, should suggest some humility by practitioners regarding the policy-readiness of their findings.
Indeed, other recent work offers some contrast to this particular strand of the literature. Gerald Auten and David Splinter found that “since the early 1960s, increasing government transfers and tax progressivity resulted in little change in after-tax top income shares.” This finding stands in contrast to even the more recent Piketty, Saez, and Zucman (2018) finding. As Auten and Splinter note, in stark contrast with the Piketty, Saez, and Zucman finding “that average real pre-tax incomes of the bottom 50 percent remained virtually unchanged, we estimate that they increased by nearly one-third. For pre-tax/after-transfer income (which includes Social Security benefits) and after-tax income, we estimate a real increase for the bottom half of the distribution of nearly two-thirds.” [9]
What explains this distinction? As the authors put it, “Tax rules and incentives for reporting income have changed over time as the result of tax legislation. Declining marriage rates and changing household structures can lead to biased results when tax units are the unit of observation. While many adults do not file tax returns, many returns are filed by individuals under age 20, other dependents, and non-residents. Important sources of income are missing in tax data, including government transfer payments and non-taxable employer-provided benefits. The share of income missing in tax data has increased over time, such that market income on tax returns accounts for only about 60 percent of national income in recent years. In addition, there are many technical issues with respect to differences between what is reported on tax returns and what economists regard as current-year economic income. Prior studies may have been misleading as a result of failure to adequately account for these challenges.”
Implications for Public Policy
The state of inequality presented by Piketty and Saez, and Piketty, Saez, and Zucman has become conventional wisdom among some policymakers and animates a range of policy proposals. In general, these policies appear largely unchanged from many progressive policy priorities; they simply have a new rationale – to staunch the growth of inequality. But this line of reasoning suffers from three conceptual flaws. First, as noted above, the research literature has nothing like a consensus on income inequality. Accordingly, there will be no consensus method for evaluating policy changes that purport to “reduce inequality.” Indeed, the advocates cannot credibly state what the current level of inequality is. Perhaps more important, advocates for policies focusing on inequality cannot articulate what a “just” level of inequality would be. Surely it can’t be the case that everyone should have exactly the same income. Thus, for a given policy to reduce inequality, policy advocates cannot provide a credible framework for evaluating its merit.
As part of their respective bids for the presidency, Senators Warren and Sanders have both proposed new taxes on wealth. While there are some differences – Sanders’ proposal has a higher top rate – the basic approach is the same: a single-digit tax on the reported assets of households with net worth over certain threshold amounts. Setting aside administrative and constitutional challenges, the new taxes suffer from key design flaws if viewed through a conventional efficiency lens.
While the candidates couch their new taxes as being mere cents on the dollar, the effective rates under these plans are quite high. In essence, these annual wealth taxes amount to an annual tax on the return to capital. Senator Warren “would levy a 2 percent annual tax on all assets — including stocks, real estate and retirement funds, held either in the United States or abroad — owned by households with a net worth of $50 million or more.”[10] It would add an additional 1 percent “billionaire surtax” on households with net worth exceeding $1 billion.
If the rate of return to invested wealth is 5 percent, a 3 percent tax on the 2nd billion dollars (which raises $30 million) is the same as a 60 percent tax on the $50 million of earnings (which also raises $30 million). Put differently, it would be a sharply higher capital income tax on a very narrow base. Senator Sanders proposed still higher rates. The economic implications are far beyond simply making certain households worse off. The notion that a significant fraction of the economy’s capital is owned by these households means that a significant portion of the capital income will face highly distortionary, anti-growth tax rates. The implications for investment, innovation, productivity growth, and the future path of real wages should be well understood before contemplating such a policy.
An Alternative Approach to Inequality
The idea that the economy is not delivering, and has not delivered, adequate outcomes is not controversial. The CBO projects that real U.S. economic growth will average 1.8 percent over the next 10 years. This rate of growth is below that needed to improve the standard of living at the pace typically enjoyed in post-war America. During the early post-war period, from 1947 to 1969, trend economic growth rates were quite rapid. Gross domestic product (GDP) and GDP per capita grew at rates of 4.0 percent and 2.4 percent, respectively. Over the next 25 years, however, these fell to 2.9 percent and 1.9 percent, respectively. During the years 1986 to 2007, trend growth in GDP recovered to 3.2 percent, while trend GDP per capita growth rose to 2.0 percent.
These rates were quite close to the overall historic performance for the period. These distinct periods and trends should convey that the trend growth rate is far from a fixed, immutable economic law that dictates the pace of expansion, but rather subject to outside influences — including public policy.
More rapid growth is not an abstract goal; faster growth is essential to the well-being of American families.
Table 1
The Importance of Trend Growth to Advancing the Standard of Living
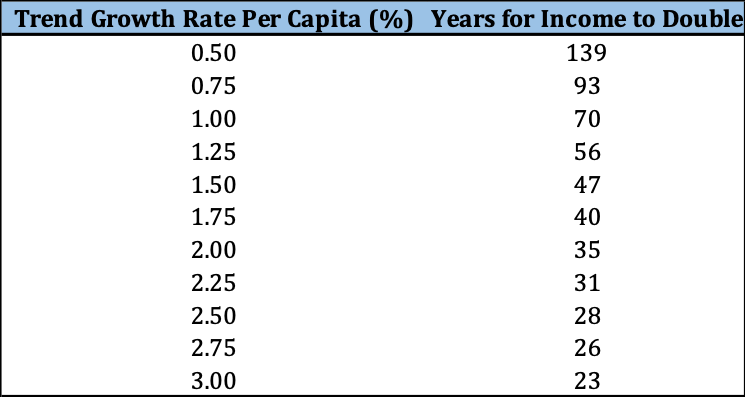
The trend growth rate of post-war GDP per capita (a rough measure of the standard of living) has been about 2.1 percent. As Table 1 indicates, at this pace of expansion an individual could expect the standard of living to double in 30 to 35 years. Put differently, during the course of one’s working career, the overall ability to support a family and pursue retirement would become twice as large.
In contrast, the long-term growth rate of GDP in the most recent CBO projection is 1.8 percent. When combined with population growth of 1.0 percent, this long-term growth rate implies the trend growth in GDP per capita will average 1.0 percent. At that pace of expansion, it will take 70 years to double income per person. The American Dream is disappearing over the horizon.
Rather than focusing on making the top end of the distribution worse off, policymakers should consider a robust growth agenda for raising the incomes of those at and near the bottom. After all, every dollar of successful poverty reduction reduces inequality and benefits the most deserving in the population. In this regard, it is worth noting that because the income-inequality measures developed by Piketty and Saez and Piketty, Saez, and Zucman do not include certain anti-poverty and income support transfers, no amount of income support programs would alter their estimates of inequality.
[1] Thomas Piketty, Emmanuel Saez, Income Inequality in the United States, 1913–1998, The Quarterly Journal of Economics, Volume 118, Issue 1, February 2003, Pages 1–41,
[2] https://www.vox.com/policy-and-politics/2018/1/10/16850050/inequality-tax-return-data-saez-piketty
[3] See: https://www.nytimes.com/interactive/2019/10/06/opinion/income-tax-rate-wealthy.html
[4] For definitions of various measures of income, the forgoing discussion draws upon https://www.cbo.gov/system/files/115th-congress-2017-2018/reports/53597-distribution-household-income-2014.pdf
[5] Ibid.
[6] https://www.urban.org/sites/default/files/publication/99455/how_different_studies_measure_income_inequality_0.pdf
[7] Ibid.
[8] Reproduced from: https://www.urban.org/sites/default/files/publication/99455/how_different_studies_measure_income_inequality_0.pdf
[9] http://davidsplinter.com/AutenSplinter-Tax_Data_and_Inequality.pdf
[10] https://www.nytimes.com/2019/01/24/us/politics/wealth-tax-democrats.html
