


Testimony
May 16, 2018
Tax Reform: Growing Our Economy and Creating Jobs
* The views expressed here are my own and not those of the American Action Forum. I thank Gordon Gray for his assistance.
Chairman Brady, Ranking Member Neal, and members of the Committee, thank you for convening this hearing and providing me with the opportunity to assess the economic implications of the Tax Cuts and Jobs Act (TCJA). This evaluation must begin by reflecting on the nation’s economic performance over the course of the recovery from the Great Recession. Gross domestic product (GDP) growth has disappointed, while wage growth has remained stubbornly intractable. The economic outlook, reiterated in successive Congressional Budge Office (CBO) projections, promised more of the same. Simply put, in the absence of fundamental policy changes, the American Dream was slipping out of reach for working Americans.
Tax reform is only one component of a necessary growth strategy to improve the promise of the American economy, but it is an essential one. The anti-growth elements of the old tax code have been examined extensively by this committee; they broadly included a corporation income tax rate out of line with competitive norms, poor investment incentives, and an international tax system that encouraged firms to invest and relocate abroad.
The TCJA addressed these fundamental flaws to a significant degree. While it remains too early to fully evaluate how these changes will improve the growth outlook, we have already seen some positive indicators of its contribution to growth. In evaluating the TCJA, I intend to make three points:
- The overriding rationale for the TCJA was the need for better incentives for long-term economic growth, improving disappointing wage growth and increasing the pace of growth of the standard of living for American families;
- The old tax code was widely acknowledged as flawed and antigrowth – the TCJA addressed the major failings of the old code; and
- While it remains too early to fully judge the economic effects of the TCJA, improved growth forecasts and other indicia augur favorably for the growth implications of the TCJA. It is also essential to measure this effect properly going forward.
Let me discuss these in turn.
Recent Economic Performance and the Growth Challenge
Supporting more rapid trend economic growth is the preeminent policy challenge. The nation has experienced a disappointing recovery from the most recent recession and confronts a projected future defined by weak long-term economic growth. Left unaddressed, this trajectory will consign to the next generation a less secure and less prosperous nation.
Figure 1: Disappointing Economic Growth
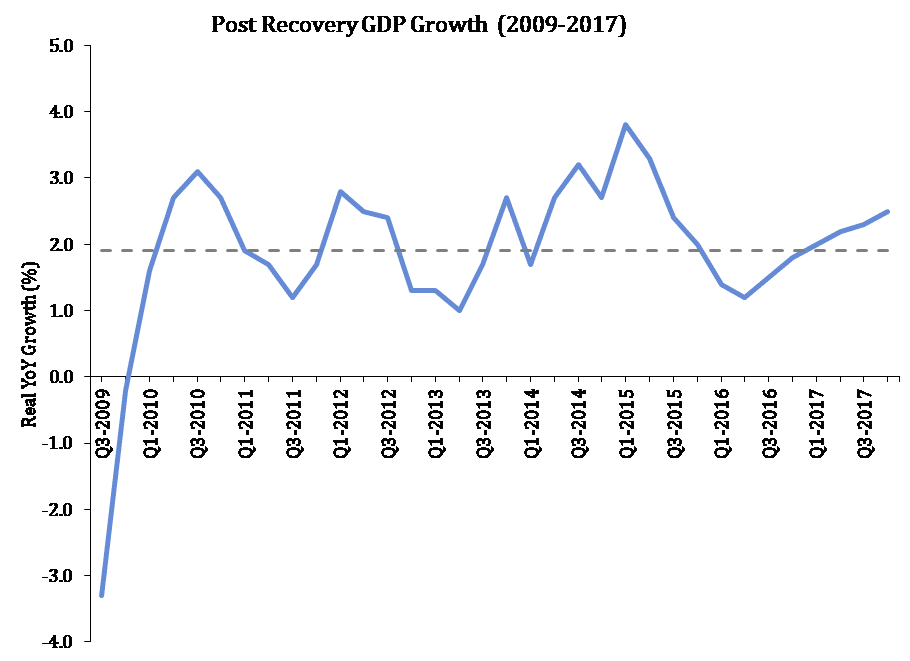
Figure 1 shows quarterly, year-over-year growth rates for real GDP since the official end of the Great Recession in June of 2009. As displayed, real GDP growth has been stubbornly weak, averaging 1.9 percent annually (the dotted line). While recoveries from recessions precipitated by financial crises tend to be weaker, the persistence of the nation’s weak economy should not be considered inevitable, but rather as an encouragement to implement better economic policy.
Figure 2: Productivity Growth is Lagging Past Performance
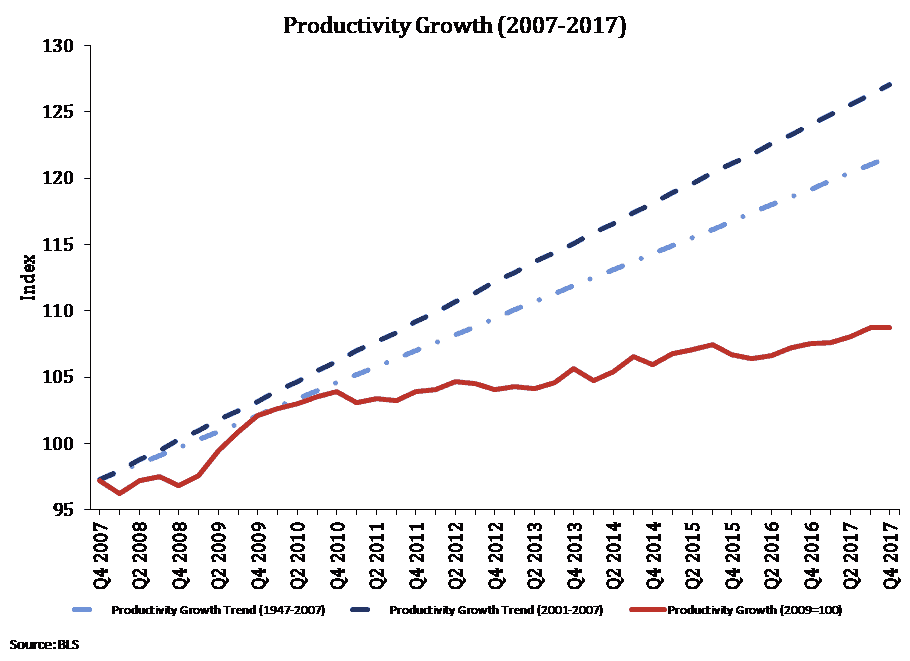
Household income, a metric that more working Americans can appreciate, underscores the tepid economic recovery. According to the most recent comprehensive income survey conducted by the U.S. Census Bureau, earnings growth of men and women who worked full-time and year-round was essentially zero in 2016.[i] Stagnant earnings growth reflects poor productivity growth that lags behind the rate seen in other recoveries or the prevailing historical trends (see Figure 2).[ii]
Figure 3: Labor Force Participation
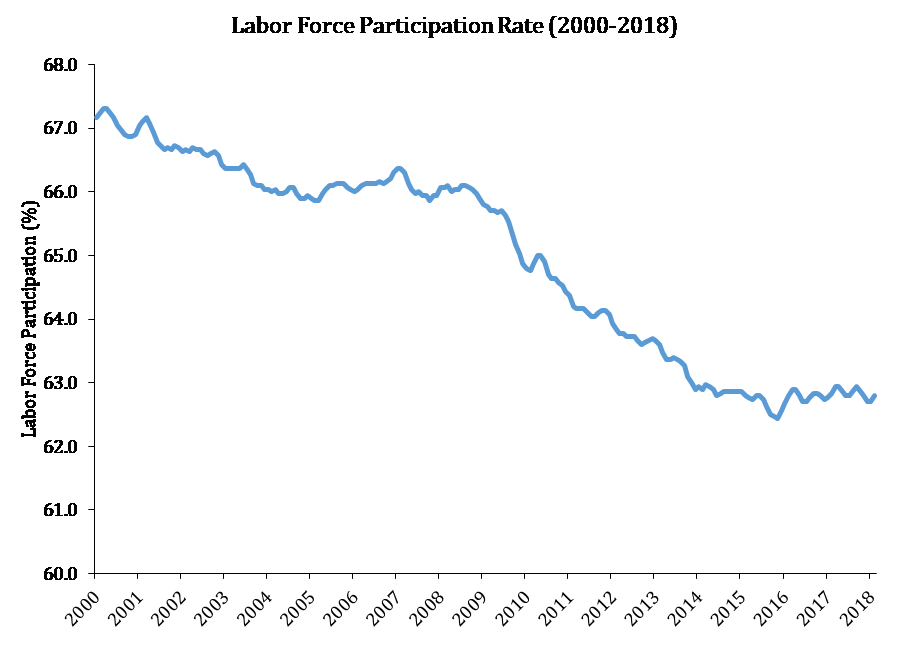
The other essential building block for stronger trend economic growth is growth in the labor force – the population willing and able to work. As a share of the population, the labor force has declined from historical highs in 2000, but this decline has accelerated since the Great Recession (Figure 3).
Figure 4: CBO April 2018 Baseline
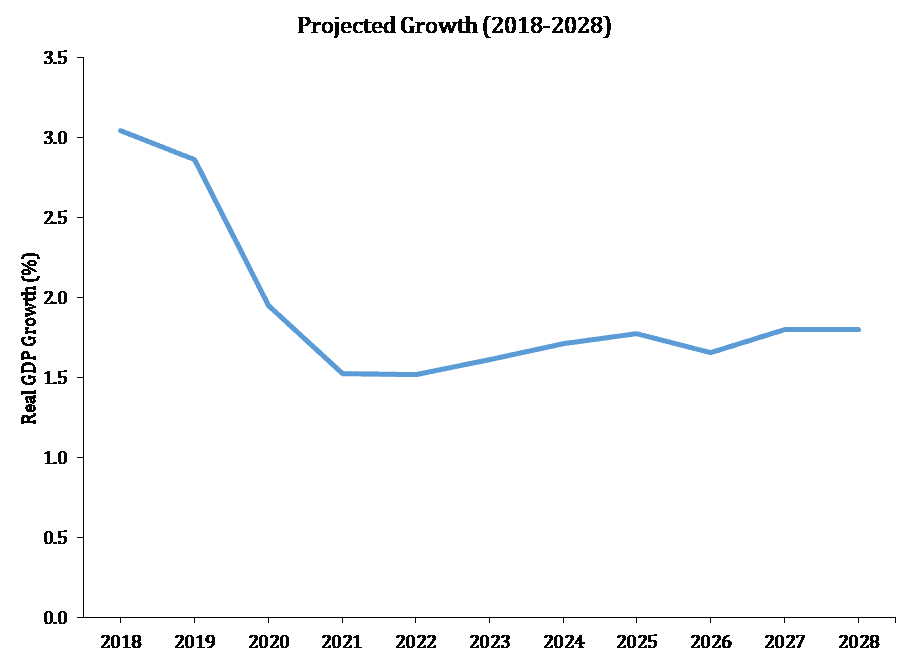
Even more troubling than the recent economic past is the economic outlook. The CBO projected in its April Budget and Economic Outlook that U.S. economic growth will average 1.9 percent over the period 2018-2028. While it reflects near-term improvement in the pace of growth, and credits the TCJA for improved incentives for work, saving, investment, and growth, CBO projects that these improvements will dissipate over the budget window.
The rate of growth projected in the current economic baseline is certainly below that needed to improve the standard of living at the pace typically enjoyed in post-war America. During the early postwar period, from 1947 to 1969, trend economic growth rates were quite rapid. GDP and GDP per capita grew at rates of 4.0 percent and 2.4 percent, respectively. Over the subsequent 25 years, however, these rates fell to 2.9 percent and 1.9 percent, respectively. During the years 1986 to 2007, trend growth in GDP recovered to 3.2 percent, while trend GDP per capita growth rose to 2.0 percent.
These rates were quite close to the overall historic performance for the period. The lesson of these distinct periods is that the trend growth rate is far from a fixed, immutable economic law that dictates the pace of expansion, but rather is subject to outside influences – including public policy.
Table 1: The Importance of Trend Growth to Advancing the Standard of Living
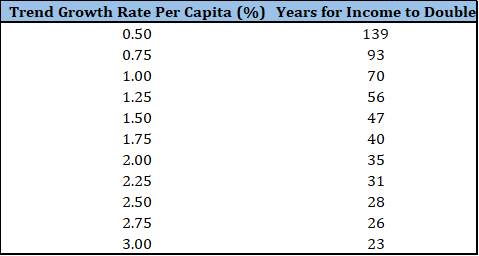
The trend growth rate of postwar GDP per capita (a rough measure of the standard of living) has been about 2.1 percent. As Table 1 indicates, at this pace of expansion an individual could expect the standard of living to double in 30 to 35 years. Put differently, during the course of one’s working career, the overall ability to support a family and pursue retirement would become twice as large.
In contrast, the long-term growth rate of GDP in the most recent CBO projection is 1.9 percent. When combined with population growth of 0.8 percent, this implies the trend growth in GDP per capita will average about 1.0 percent. At that pace of expansion, it will take 70 years to double income per person. The American Dream is disappearing over the horizon.
More rapid growth is not an abstract goal; faster growth is essential to the well-being of American families.
The Need for Tax Reform
Prior to the enactment of the TCJA, the U.S. tax code was broadly viewed as broken and in need of repair, and for good reason. Whereas the previous administration and past Congresses made the tax system worse – adding higher rates and new taxes, including on the middle class – the Trump Administration and Congress embarked on an effort to overhaul the fundamentals of the nation’s tax system. A sound reform of the U.S. tax code was an essential element of a pro-growth strategy, and this reform promises to support increased long-run economic growth.[iii]
The deficiencies in the tax system prior to the enactment of the TCJA have been well documented but are worth reviewing and will fix this discussion in the proper context – the counterfactual to the TCJA is of profound importance for evaluating its efficacy in improving the growth outlook.
International Competitiveness and Headquarter Decisions[iv]
Prior to the enactment of the TCJA, the U.S. corporate tax code remained largely unchanged for decades, with the last major rate reduction passed by Congress in 1986.[v] During the interim, competitor nations made significant changes to their business tax systems by reducing tax rates and moving away from the taxation of worldwide income. Relative to other major economies, the United States went from being roughly on par with major trading partners to imposing the highest statutory rate of tax on corporation income. While less stark than the U.S.’s high statutory rate, the United States also imposed large effective rates. According to a study by PricewaterhouseCoopers, “companies headquartered in the United States faced an average effective tax rate of 27.7 percent compared to a rate of 19.5 percent for their foreign-headquartered counterparts. By country, U.S.-headquartered companies faced a higher worldwide effective tax rate than their counterparts headquartered in 53 of the 58 foreign countries.”[vi]
The United States failed another competitiveness test in the design of its international tax system. The U.S. corporation income tax applied to the worldwide earnings of U.S. headquartered firms. U.S. companies paid U.S. income taxes on income earned both domestically and abroad, although the United States allowed a foreign tax credit up to the U.S. tax liability for taxes paid to foreign governments. Active income earned in foreign countries was generally only subject to U.S. income tax once it was repatriated, giving an incentive for companies to reinvest earnings anywhere but in the United States. This system distorted the international behavior of U.S. firms and essentially trapped foreign earnings that might otherwise be repatriated back to the United States.
While the United States maintained an international tax system that disadvantaged U.S. firms competing abroad, many U.S. trading partners shifted toward territorial systems that exempt entirely, or to a large degree, foreign-source income. Of the 34 economies in the Organisation for Economic Co-operation and Development (OECD), for example, 29 have adopted systems with some form of exemption or deduction for dividend income.[vii]
One manifestation of the competitive disadvantage faced by U.S. corporations was decisions on the location of headquarters. The issue of so-called “inversions” remained at the forefront of tax policy and politics. Originally, tax inversions involved a single company flipping the roles of U.S. headquarters and a foreign subsidiary — i.e. “inverting.” Tax changes in the early 2000s largely ended this practice. Next, whenever a U.S. firm sought to acquire or merge with a foreign firm, the tax advantages of being subjected to a lower rate and a territorial base made it inevitable that the combined firm would be headquartered outside the United States. In these cases, inversions took place in the context of these otherwise strategic and valued business opportunities. Most recently, foreign firms have recognized that freeing U.S. companies of their tax disadvantage allows foreign acquirers to use the same capital, technologies and workers more effectively. Inversions were occurring because foreign firms were acquiring U.S. firms.
A macroeconomic analysis of former House Ways and Means Chairman Camp’s tax reform proposal is instructive on the incentives inherent in the old tax code for capital flight. John Diamond and George Zodrow examined how reform similar to that proposed by former Chairman Camp would affect capital flows compared to pre-TCJA law.[viii] In the long-run, the authors estimated that a reform that lowered corporate rates and moved to an internationally competitive divided-exemption system would increase U.S. holdings of firm-specific capital by 23.5 percent, while the net change in domestic ordinary capital would be a 5 percent increase. It is important to note that these are relative measurements – they were relative to current law at the time. If the spate of announcements of inversions in the years leading up to the enactment of the TCJA is any indication, the old tax code was inducing capital flight. Accordingly, the 23.5 percent and 5 percent increases in firm-specific and ordinary stock, respectively, may be interpreted in part as the effect of precluding future tax inversions.
Placing a value of this potential equity flight is uncertain, but based on these estimates, roughly 15 percent, or $876 billion in U.S.-based capital was estimated to be at risk of moving overseas under the old code.[ix]
Finally, it is an important reminder that the burden of the corporate tax is borne by everyone. Corporations are not walled off from the broader economy, and neither are the taxes imposed on corporate income. Taxes on corporations fall on stockholders, employees, and consumers alike. The incidence of the corporate tax continues to be debated, but it is clear that the burden on labor must be acknowledged. A recent survey compiled by the President’s Council of Economic Advisers aptly summarizes the economics literature, and finds that while differing greatly, empirical estimates have been trending upwards over time, reflecting the dynamism of global capital flows that characterize the modern economy.[x] One study by economists at the American Enterprise Institute, for example, concluded that for every 1-percent increase in corporate tax rates, wages decrease by 1 percent.[xi]
Flaws in the Individual Tax Code
As taxpayers rediscover every April, the U.S. code has been complex, confusing, costly to operate and comply with, and leaves taxpayers distrustful that everyone is paying the share Congress intended. In 2016, over 150 million individual tax returns were filed, covering over $10.2 trillion in income.[xii] These returns also include millions of businesses that do not file as C corporations. As of 2012, there were 31.1 million non-farm businesses filing tax returns: 23.6 million sole-proprietors, 4.2 million S corporations, and 3.4 million partnerships (including limited liability companies). The Internal Revenue Service (IRS) also recognized 1.6 million C corporations.[xiii] The tax system is often the most direct interface between individuals and businesses and the federal government.
Unfortunately, that experience is often deeply unsatisfactory. The IRS has 1,186 forms with which taxpayers must contend and requires an average of 11.8 hours per paperwork submission. The overall burden on taxpayers is 8.1 billion hours in paperwork burden imposed by the tax collection system on taxpayers.[xiv]
As many Americans have experienced, the tax filing process is extremely time intensive and often requires the help of outside expertise. Tax compliance is so onerous for individual taxpayers, over 90 percent of individual taxpayers used a preparer or tax software to prepare their returns. The Taxpayer Advocate Service, the watchdog office within the IRS, has stated that complexity is the single most serious problem with the tax code. Fichtner and Feldman assessed the costs that the U.S. tax code extracts taxpayers through complexity and inefficiency. The study finds that, in addition to time and money expended in compliance, foregone economic growth, and lobbying expenditures amount to hidden costs are estimated to range from $215 billion to $987 billion.[xv]
Evaluating the TCJA
The TCJA addressed some of the most glaring flaws in the business tax code. It lowered the corporation income tax rate to a more globally competitive 21 percent, enhanced incentives to investment in equipment, addressed some of the disparate tax treatment between debt and equity, and refashioned the nation’s international tax regime. Primarily for these reasons, the TCJA will enhance the nation’s growth prospects. The long-run contribution to GDP from the TCJA could be as much as 3 percent, though there are a range of credible estimates and myriad factors that could alter the ultimate impact of the TCJA on the economy.[xvi]
The Growth Outlook
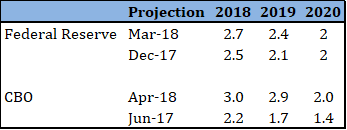
In the wake of the enactment of the TCJA, several macroeconomic forecasts have been revised upwards, projecting improved real GDP growth over the next several years. The Federal Reserve, which provides median forecasts of real GDP growth for the period 2018-2020, increased projected real growth in their most recent forecast, which was subsequent to the enactment of the TCJA (but prior to the enactment of the omnibus appropriations bill). CBO also improved its real GDP outlook over the same period in its most recent economic projections, reflecting CBO’s broader observation that “CBO projects that the act’s effects on the U.S. economy over the 2018–2028 period will include higher levels of investment, employment, and gross domestic product (GDP).”
Table 1: Projected Real GDP Growth
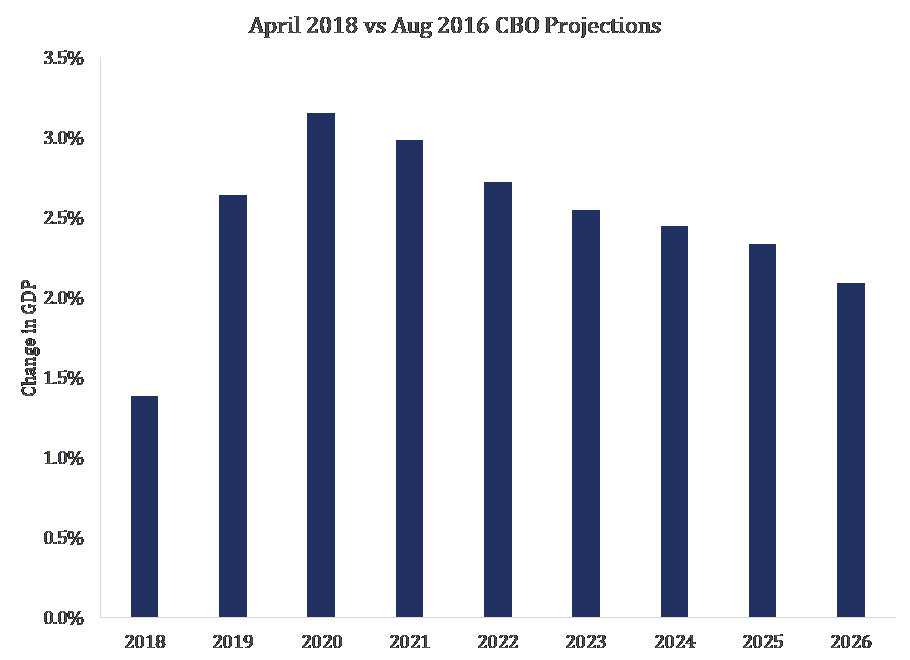
Also striking is the broader departure in the growth outlook from just 15 months ago. While the TCJA is certainly not the only contributor to this improvement, it is a significant element of the improved outlook.
Figure 1: Improved GDP
The primary channel by which the TCJA will contribute to more rapid economic growth will be through investment. Here too, the CBO has improved its outlook. Compared to its June 2017 Outlook, CBO has upwardly revised its projection for business fixed investment by over $1 trillion over the period 2018-2027 in its most recent baseline update.
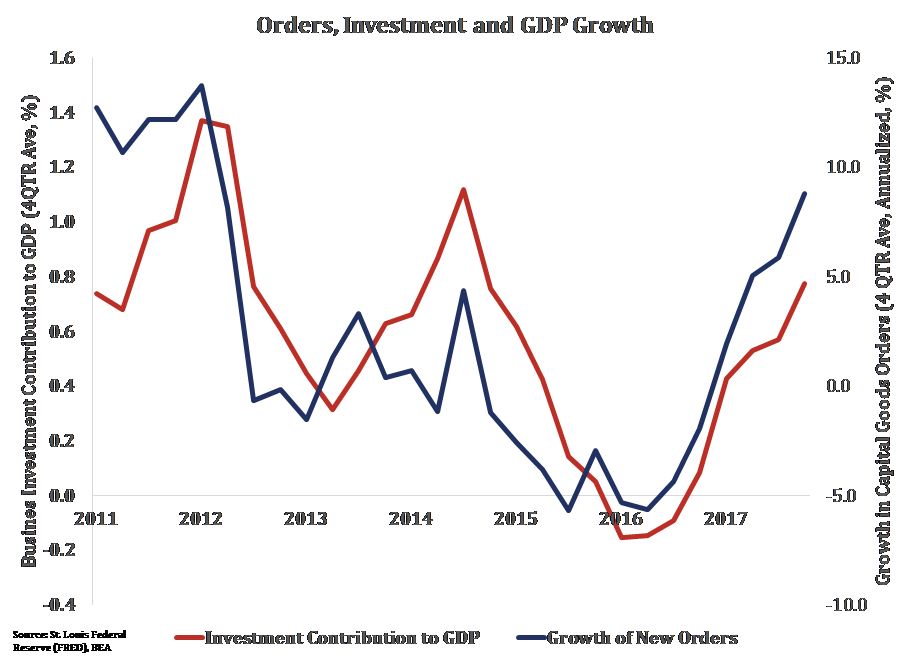
Observing this contribution going forward will be essential for assessing the economic effects the TCJA. A simple way to measure this effect is shown in the chart below. The red line shows the contribution (in percentage points) of business investment to growth in GDP, as measured by a 4-quarter moving average. The clear need is for investment to surge and push up both the growth rate of the economy and investment’s contribution to that growth.
How can we see if that is coming? The blue line shows a 4-quarter moving average of new orders for capital goods, which fairly closely tracks the investment. During 2018 it will be interesting to watch the growth rate of new orders for an upturn in response to the policy change.
Figure 2: Capital Goods, Investment and Economic Growth
It remains too early to evaluate the degree to which the TCJA is boosting investment, but there are some promising indicators.
According to analysis conducted by Bank of America Merrill Lynch, aggregate capex in the first quarter of 2018 grew 24 percent year over year, 5 percentage points above expectations at the start of the year and about three times the growth rate in the fourth quarter of last year.”[xvii]
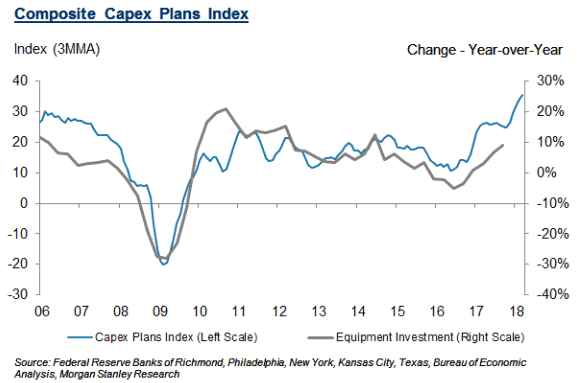
According to a research report compiled by Morgan Stanley and Co., plans for future capital expenditures reached “an all-time high” in March 2018.[xviii] This index was ticking up prior to the TCJA enactment, so its implications should not be overstated, but this is an indicator to monitor for trends in investment behavior subsequent to the TCJA’s enactment.
Figure 3: Investment Plans
Ultimately, the goal of this the TCJA is to enhance Americans’ standard of living by enhancing employment and wage growth. The CBO projected that the TCJA would add 900,000 new jobs to the economy over the next decade. Worker pay, which has been stubbornly slow to improve, recently saw its largest gain since 2008, according to one measure. The Employment Cost Index (ECI) measures changes in labor costs, and captures overall compensation and wages and salaries. The most recent data show that overall compensation for all civilian workers, as well as wages and salaries for private sector workers, grew over the last 12 months at the highest rate since 2008.[xix] While this certainly cannot be attributed entirely to the TCJA, it remains a meaningful signal of labor market improvement subsequent to the passage of the TCJA.
What is not a meaningful indicator for the TCJA’s effect on investment are stock buybacks. The news is filled with reports that the TCJA has spawned “share buybacks” – corporations purchasing their own stock – and opponents of the law have characterized this as evidence of failed policy. A little reflection, however, indicates that share buybacks tell you essentially nothing about the success of the TCJA.
To begin, stock buybacks do not enrich shareholders. The TCJA impacts the value of corporate equity investments in complicated ways. The rate cut increases the value of equity. The move to a territorial system with a tax on deemed repatriation modestly cuts this increase in value for those with large accumulated overseas earnings (other things being equal). The imposition of expensing increases the value of growing firms with new investments (again, other things equal). But stock buybacks do not make shareholders richer. A stock buyback is simply the exchange of valuable stock for the same value in cash. It has no impact per se on anyone’s wealth.
Second, relatively few shareholders are rich people. According to the Tax Policy Center, less than one quarter of corporate stocks are held by taxable accounts (and people are not the only taxable accounts, so the number of individuals is even smaller).[xx] The largest share (37 percent) is held by retirement plans, as well as insurance companies and non-profits. Stock buybacks do not create riches and are not targeted at the affluent.
Finally, the economic impact depends on the final transaction; the buyback is the first. When the shareholder receives the cash, he or she can plow it back into the financial system in the form of another stock, bond, or the like. Those funds become available to entrepreneurs, small businesses, and companies to make investments. As they do, the quality and quantity of tangible and intangible capital rises and new business models are formed. These are the foundation of higher productivity, which will translate to higher wages. I will be the first to acknowledge that it is too early to judge the ultimate success of the TCJA in this regard. But I am dead sure that one learns nothing about this success or failure from stock buybacks.
As an aside, it is probably a good thing when there are share buybacks. They suggest that the firm has little in the way of high-return investments to make. It is far better to avoid having the dollars trapped in a low-return firm and instead have them flow through financial markets to the best investment opportunities.
Conclusion
There has been broad agreement that the recovery from the Great Recession has disappointed. Past economic performance has been tepid, while the growth outlook was persistently middling. There was also wide agreement that the tax code needed structural reforms to contribute to better economic performance going forward. Major elements of the TCJA, particularly the lower corporate tax rate, expensing of qualified equipment, and the broad architecture of the international reforms, were designed to address the recognized flaws in the old code. These reforms have contributed to improved growth forecasts by the Federal Reserve as well as CBO, and certain indicators show promise for the TCJA’s growth implications. While it remains early, there is cause for optimism that the TCJA is having the desired effect: stronger growth, better investment, and an improved labor market for American workers.
[i] https://www.census.gov/library/publications/2017/demo/p60-259.html
[ii] https://www.americanactionforum.org/research/does-compensation-lag-behind-productivity/; Also see https://www.bls.gov/opub/btn/volume-6/below-trend-the-us-productivity-slowdown-since-the-great-recession.htm on which figure 2 is based
[iii] https://www.americanactionforum.org/research/economic-and-budgetary-consequences-of-pro-growth-tax-modernization
[iv] See: https://waysandmeans.house.gov/wp-content/uploads/2016/05/20160525TP-Testimony-Holtz-Eakin.pdf
[v] https://www.americanactionforum.org/research/economic-and-budgetary-consequences-of-pro-growth-tax-modernization
[vi] PricewaterhouseCoopers (2011). Global Effective Tax Rates. Washington, DC
[vii] https://taxfoundation.org/territorial-tax-system-oecd-review/
[viii] http://businessroundtable.org/sites/default/files/reports/Diamond-Zodrow%20Analysis%20for%20Business%20Roundtable_Final%20for%20Release.pdf
[ix] https://www.americanactionforum.org/research/economic-risks-proposed-anti-inversion-policy-update/
[x] https://www.whitehouse.gov/sites/whitehouse.gov/files/documents/Tax%20Reform%20and%20Wages.pdf
[xi] Kevin A. Hassett and Aparna Mathur, “Taxes and Wages,” American Enterprise Institute Working Paper No. 128, June 2006.
[xii] https://www.irs.gov/statistics/soi-tax-stats-individual-income-tax-returns-publication-1304-complete-report#_pt1
[xiii] https://www.jct.gov/publications.html?func=startdown&id=4903
[xiv] https://www.americanactionforum.org/research/tax-day-2018-compliance-costs-approach-200-billion/
[xv] Fichtner, Jason J. and Jacob M. Feldman, “The Hidden Costs Of Tax Compliance.” Mercatus Center 2015 Web. http://mercatus.org/sites/default/files/Fichtner-Hidden-Cost-ch1-web.pdf
[xvi] https://www.wsj.com/article_email/how-tax-reform-will-lift-the-economy-1511729894-lMyQjAxMTI3MjI1NzIyMTc4Wj/
[xvii] https://www.marketwatch.com/story/heres-why-capex-spending-creates-stock-market-winners-and-losers-2018-05-09
[xviii] http://www.taxanalysts.org/content/economic-report-gives-white-house-support-tax-cut-prediction
[xix] https://www.bloomberg.com/news/articles/2018-04-27/u-s-employment-costs-accelerate-in-sign-of-mounting-inflation
[xx] http://www.taxpolicycenter.org/sites/default/files/alfresco/publication-pdfs/2000790-The-Dwindling-Taxable-Share-of-U.S.-Corporate-Stock.pdf
