


Testimony
May 27, 2020
The Disproportionate Impact of Covid-19 on Communities of Color
United States House of Representatives Committee on Ways and Means
*The views expressed here are my own and not those of the American Action Forum. I thank Gordon Gray, Tara O’Neill Hayes, and Christopher Holt for their valuable contributions.
Chairman Neal, Ranking Member Brady, and members of the Committee, thank you for the opportunity to discuss the impact of COVID-19 on communities of color. I would like to make three points:
- The COVID-19 pandemic has taken lives, damaged health, and produced an historic economic decline.
- Racial and ethnic minorities in the United States are disproportionately feeling the health and economic impacts of the COVID-19 pandemic.
- Disparities in living environment, nutrition, and education at the peak of the cycle suggest that there will be even greater impacts from the COVID-19 pandemic.
Let me discuss these in turn.
COVID-19 and the Economy
The macroeconomic impact of the COVID-19 pandemic far exceeds any experience in our lifetimes. Essentially all the major leading economic indicators have seen historic declines, wiping out the hard-won gains from the longest recovery in U.S. history.
Recent Economic Trends
Prior to the pandemic, there had been a meaningful improvement in the persistence of healthy economic growth over the past three years. Gross domestic product (GDP) growth, measured as the growth from the same quarter in the previous year, accelerated steadily from a low of 1.3 percent in the 2nd quarter of 2106 to a recent peak of 3.2 percent in the 2nd quarter of 2018. Of note, throughout this period, GDP growth remained above the 1.8 percent growth rate that prevailed throughout the balance of the recovery.
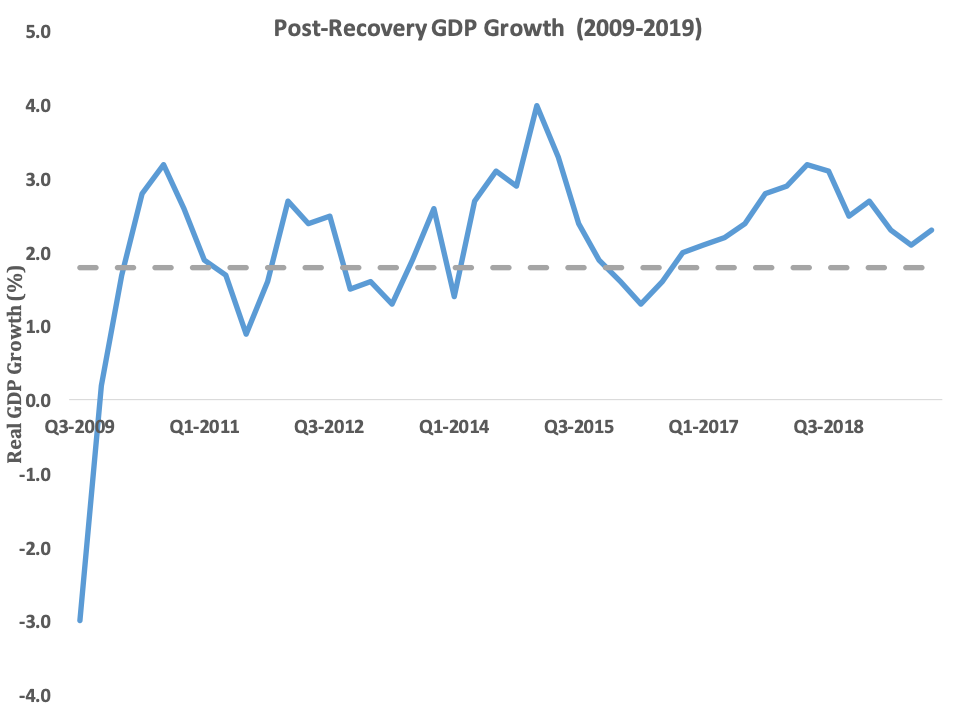
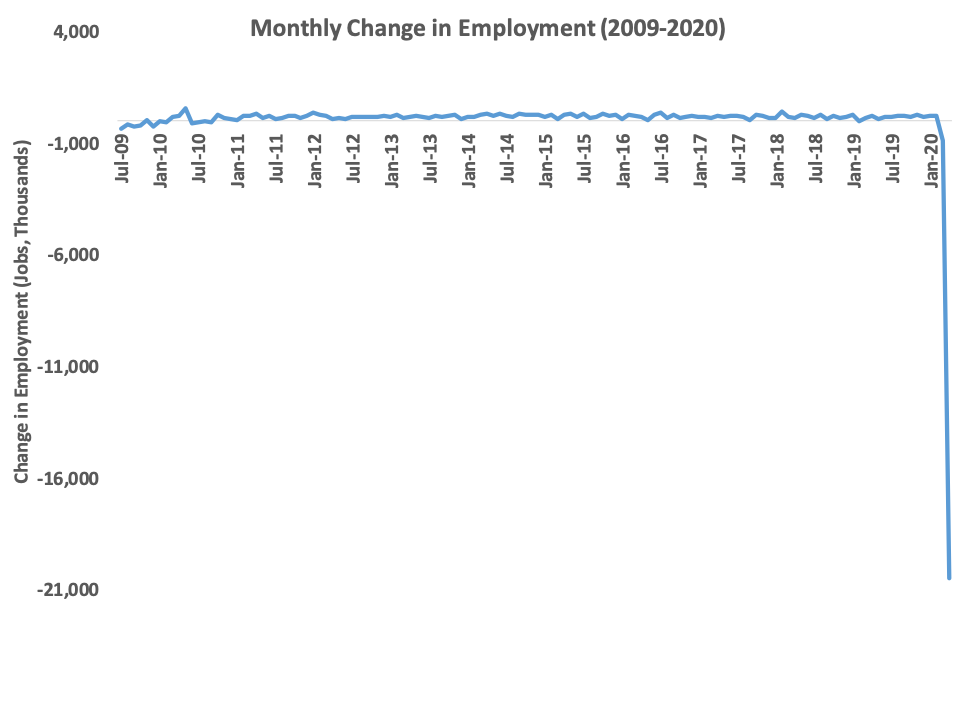
In June of 2009, the United States began the economic recovery from the Great Recession. What followed was nearly 11 years – the longest expansion in U.S. history – of steady if modest economic growth. Over that period, nearly 22 million jobs were created. Remarkably, the pace of job creation accelerated over the course of the recovery. Over the first half of the recovery, monthly job creation averaged 138,000; this increased to 198,000 new jobs created per month over the latter half of the recovery.
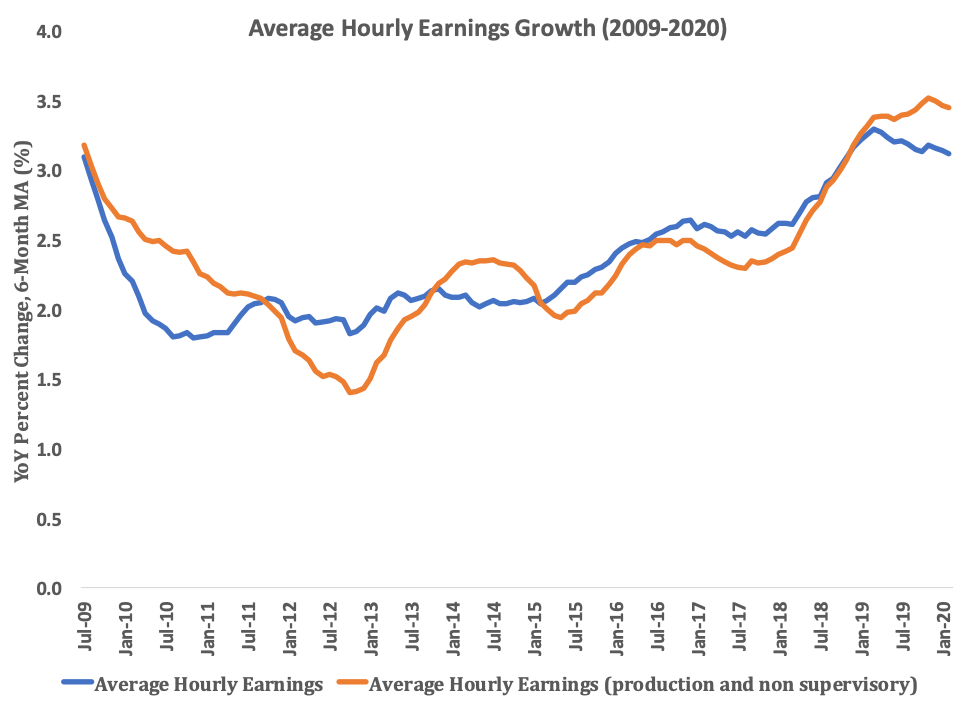
With higher growth and tighter labor markets, unemployment continued to fall as payroll and wage growth have accelerated. Wage growth has improved overall, including for non-supervisory workers. Indeed, from December 2018 onwards, growth in hourly earnings (on a yearly moving average) for production and nonsupervisory workers outpaced that of workers overall every month.
The economic story of the recent past is the realization of years of modest growth finally beginning to accrue to individuals and families, broadly raising the standard of living. Recent accelerations in that growth punctuated a return to prosperity. That all came apart in March of 2020.
The Economic Impact of COVID-19
The COVID-19 pandemic precipitated an historic shuttering of the economy in March, guaranteeing that the broadest measure of economic wellbeing – real quarterly GDP growth – would reflect some of the devastation in the first quarter. Indeed, the Bureau of Economic Analysis’s (BEA) estimate for the decline in first quarter GDP is 4.8 percent on an annualized basis. This is the single largest drop in real GDP since 2008. While any contraction, particularly one on the order of magnitude with those observed during the Great Recession, is troubling, in this instance the contraction reflects only the leading edge of the economic devastation.
Higher frequency data reveal an historically devasted economy. Payrolls in April fell by 20.5 million, with private sector payrolls shedding 19.5 million jobs. The service sector lost over 17 million jobs. The leisure and hospitality industry were particularly devastated, losing over 7.6 million jobs. Goods-producing industries saw a decline of over 2 million jobs. Government shed 980,000 jobs. No industry saw net positive hiring.
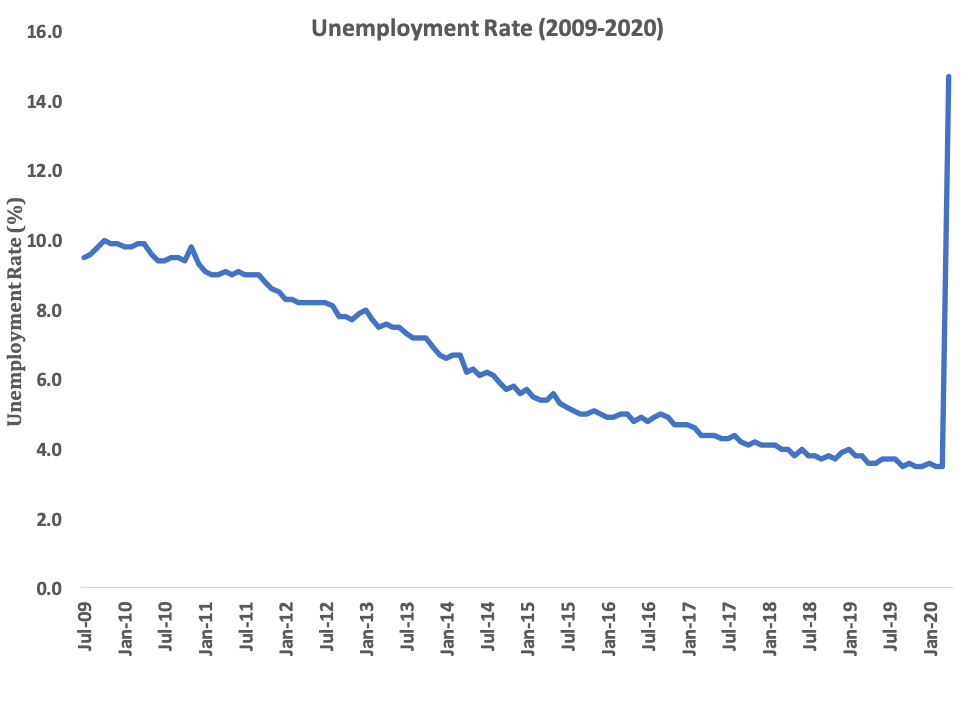
The unemployment rate jumped to 14.7 percent, which exceeds the highest level since the Great Depression. As BLS notes, were it not for the classification of some workers as employed but “Absent for other reasons,” this number would be on the order of 5 percentage points higher.
The income effects of this labor market devastation have not yet appeared in the data. Rather, and in a cruel statistical reality, in the most recent employment report average earnings jumped by a full percentage point on a yearly basis because lower-earning workers were essentially removed from the data because of such sweeping job losses.
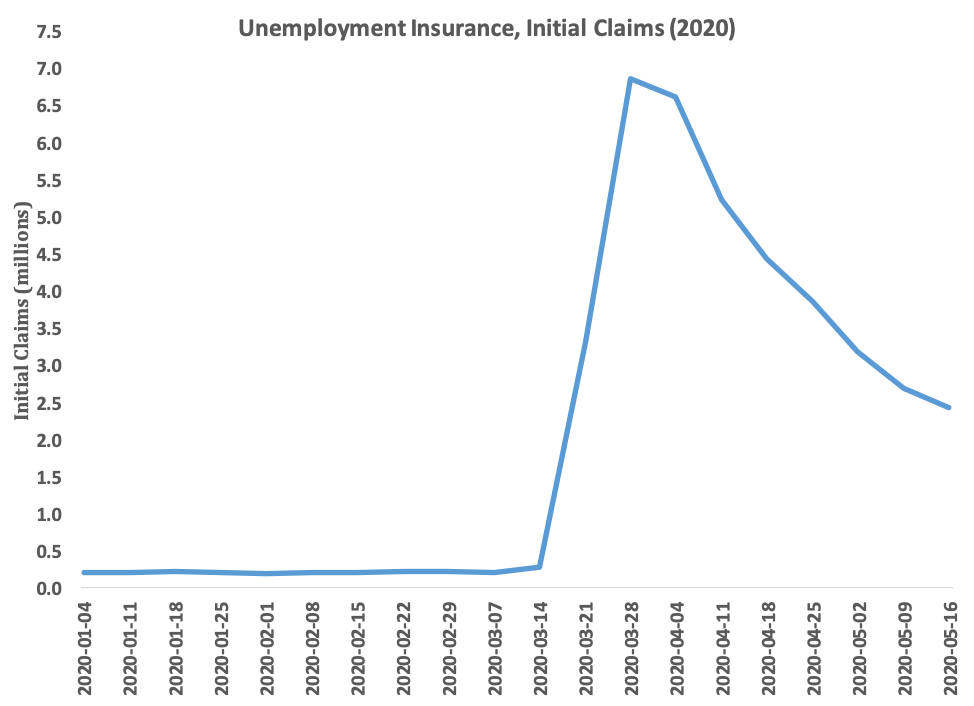
More frequent data still – weekly unemployment insurance (UI) claims – tell a similar story. Before March of this year, the single-highest weekly initial claims report was 695,000 in 1982. No week in recorded U.S. history saw millions of Americans claiming unemployment insurance benefits. In the present environment, new UI claimants can only be measured in the millions.
The upshot of these indicators, from the most deliberate and comprehensive down to the most noisy and imperfect, is economic devastation of a singularly historic nature.
The Outlook
The Congressional Budget Office (CBO) typically updates its economic forecast twice yearly – once in January and once in August. Before the pandemic, CBO’s baseline was keyed off of an economic forecast entirely abstracted from the effects of the pandemic, built on an assumption of real GDP growth in 2020 of 2.2 percent, an unemployment rate of 3.5 percent, and slowly rising interest rates. This was a fairly mainstream forecast for the year, but to perform accurate cost-estimating CBO had to essentially update its forecast on the fly, and it is to its credit that it did so.
The new economic forecast reflects a similar outlook to other major post-COVID analyses – a sharp uptick in economic activity in the 3rd quarter of 2020 that only partially restores the economic gains of the past several years. GDP is expected to fall 11 percent in the 2nd quarter, or 38 percent at an annual rate. (For perspective, in the worst year of the Great Depression, GDP fell 12 percent in 1932.)
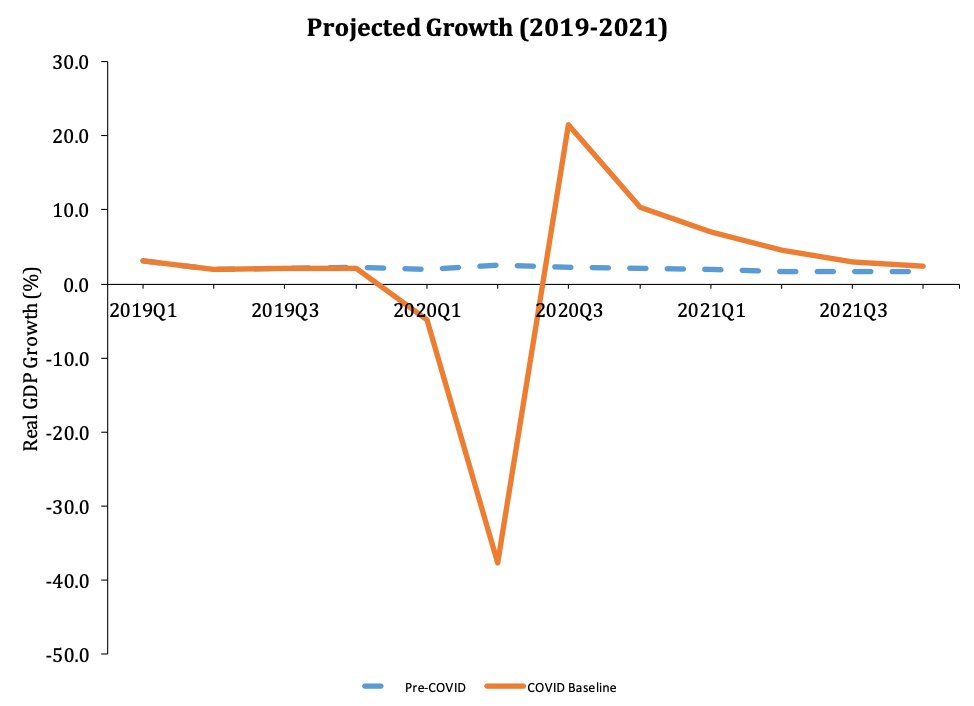
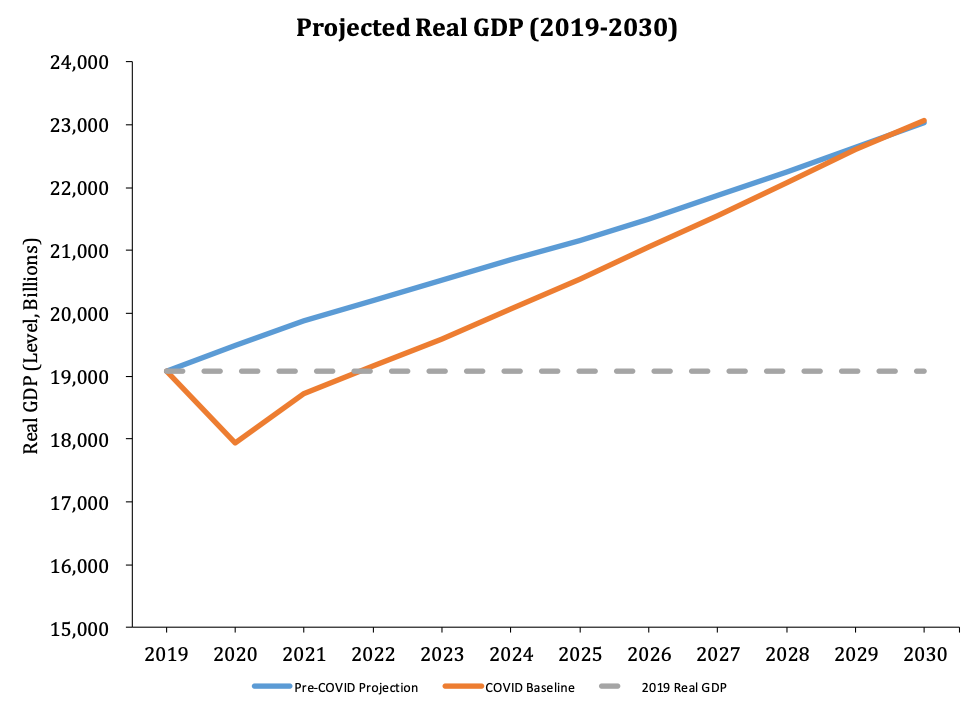
For the entire year 2020, GDP will be down 5.6 percent as every component of spending declined except federal government purchases. By contrast, in 2021 every component will rebound except for federal purchases. The CBO sees growth at a rate of 4.2 percent in 2021. What this means is that despite an expected sharp return to growth in Q3 of 2020, the scale of the prior contraction is such that CBO does not forecast the level of real GDP returning to pre-crisis levels until 2022.
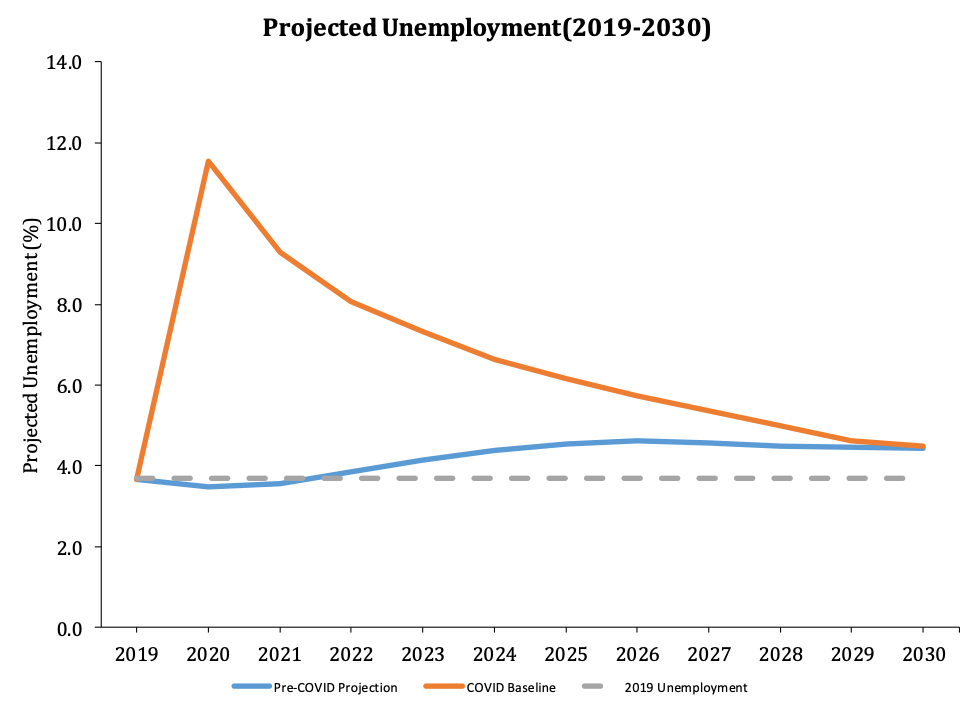
The unemployment rate will top out at 15.8 percent in 3rd quarter of 2020 but remain an elevated 8.6 percent as far out as the 4th quarter of 2021. Because CBO projected gradual increases in unemployment, under CBO’s forecast, unemployment never returns to the historic lows witnessed prior to the outbreak of the pandemic.
The implications of the current and projected losses associated with the COVID-19 pandemic are highly consequential for federal policy. The Coronavirus Aid, Relief, and Economic Security (CARES) Act stands as the single largest fiscal intervention in U.S. history, an appropriate response to an historic challenge. Continual monitoring of the economic indicators – weekly, monthly, quarterly, annually – will continue to inform Congress on the direction and tenor of the recovery, and policymakers should tailor policies accordingly.
Health and Economic Disparities Among Racial and Ethnic Minorities
The COVID-19 pandemic will have significantly disparate health and economic impacts on various populations. Those most at risk have underlying health conditions, jobs that are either essential and present workers with a greater risk of exposure or non-essential but unable to be performed from home, and live in highly dense areas where it is more difficult to isolate. In the United States, such individuals are more likely to be people of color than White. School closures will also disproportionately impact lower-income children, who are more often from racial and ethnic minority families. The pandemic is not creating these disparities but rather highlighting and exacerbating existing disparities.
Health
This pandemic is an enormous health crisis. According to the Centers for Disease Control and Prevention (CDC), the following health conditions put people of all ages at higher risk for severe illness from COVID-19: chronic lung disease or asthma, serious heart conditions, compromised immune systems, severe obesity, diabetes, chronic kidney disease requiring dialysis, and liver disease.[1] The latest data compiled by the CDC indicate that 90 percent of adults hospitalized from COVID-19 have an underlying medical condition, with the most common ones being hypertension, obesity, metabolic disease, and cardiovascular disease.
People of color are more likely to have one or more of these underlying health conditions that increase the risk of a more severe case of COVID-19. Hypertension is prevalent among 40 percent of non-Hispanic Blacks, compared with 28 percent of Whites and Hispanics.[2] Blacks and American Indians and Alaska Natives (AIANs) have higher rates of asthma and diabetes compared to Whites.[3] Nonelderly AIANs are twice as likely as Whites to report having had a heart attack or heart disease.[4] Blacks have a lower prevalence of heart disease compared with Whites, although they are significantly more likely to die from heart disease, suggesting that if they do have it, it is either not well managed or more severe.[5] Nonelderly adults who are Black, Hispanic, AIAN, and Native Hawaiians and Other Pacific Islanders (NHOPI) are more likely to be obese than those who are White.[6] Compared to Whites, Blacks have an HIV diagnosis rate that is over eight times higher and an AIDS diagnosis rate that is 10 times higher, while HIV/AIDS diagnosis rates for Hispanics are three times that of Whites.[7] Asians, conversely, tend to have lower prevalence rates for most of these conditions.[8]
Minorities are also more likely to be uninsured and thus less likely to be managing existing chronic conditions.[9] Being uninsured may also make such individuals less likely to seek care at the early onset of symptoms, which may lead to worse outcomes. Uninsured rates among nonelderly Blacks (11 percent), Hispanics (19 percent), AIANs (22 percent), and NHOPI (9 percent) are higher than for Whites (8 percent).[10]
These factors may be contributing to the results being seen across the country: racial and ethnic minorities constitute a disproportionate share of the people hospitalized and dying from COVID-19.[11] But even after accounting for clinical factors and socioeconomic conditions, including income, a recent study found African Americans who test positive are still significantly more likely to be admitted to the hospital than their non-Hispanic White counterparts.[12]
Responding to Health Disparities in the Context of COVID-19
While the reality and challenges of health disparities facing people of color in the United States are troubling, they need not be insurmountable. Steps can, and should, be taken to remedy these realities, particularly in the context of the COVID-19 pandemic.
The first step is to obtain a fuller picture of the disparities in the context of the pandemic, and the CDC is working with states to improve COVID-19 related reporting on race and ethnicity. The CDC is also providing information on mitigating risks associated with COVID-19 to at-risk individuals and communities, including racial and ethnic minority groups.[13] The Department of Health and Human Services (HHS) is also working through the Office of Minority Health to deliver critical COVID-19 related information to communities of racial and ethnic minorities. Earlier this month, HHS announced that $40 million would be made available through the Office of Minority Health to establish a strategic network of national, state, territorial, tribal, and local organizations that will work to link vulnerable populations with COVID-19 resources such as testing, treatment, and social services.[14]
As efforts to expand testing continue to ramp up, it will be important to ensure that testing is accessible and affordable for racial and ethnic minority populations. On May 7, 2020, HHS announced $583 million would be provided to Federally Qualified Health Centers to expand testing for COVID-19.[15] Further, through three rounds of pandemic-response legislation, Congress has provided – and HHS is distributing – over $11 billion in funding to states, territories, and tribal organizations for COVID-19 testing.[16] HHS has also launched the COVID-19 Uninsured Program with funding provided by the Families First Coronavirus Response Act, the Paycheck Protection Program and Health Care Enhancements Act, and the CARES Act to reimburse health care providers for COVID-19 testing and treatment provided to uninsured patients. Providers must agree not to balance bill patients as a condition of receiving reimbursement.[17]
Jobs
The second aspect of the pandemic is an economic crisis, which in turn has its own health implications. People of racial and ethnic minorities are more likely to be in jobs that increase exposure, if those jobs are still being performed, or more likely to be in a job that gets cut as a result of the economic downturn. Minority populations are more likely to be employed in the service sector or in production, transportation, and material moving and less likely to be in managerial or professional jobs, making it more likely their work requires close contact with others and less likely that they are able to work from the safety of their home.[18] Further, low-wage jobs are less likely to offer comprehensive benefits, such as paid leave or health insurance, lessening the chance that workers in these jobs will seek care at the early onset of symptoms, which current data suggest is when an individual with COVID-19 is most contagious.[19]
Individuals of racial and ethnic minorities were also more likely to be unemployed prior to the pandemic: In February 2020, just before states began to issue stay-at-home orders, 5.8 percent of Blacks and 4.4 percent Hispanics or Latinos were unemployed, compared to 3.1 percent of Whites.[20] The unemployment rate among Asians was lowest in February, at 2.5 percent, but in March it increase to 4.1 percent, just above the unemployment rate for Whites, which increased the least to 4.0 percent.[21]
A review of unemployment data released over the past few weeks shows that most of the more than 30 million jobs lost thus far are “Production and Non-supervisory” jobs in the Leisure and Hospitality (8.2 million), Education and Health Care Services sectors (2.6 million), Retail (2.2 million), Manufacturing (1.4 million), Construction (1.3 million), and Temporary Business Services (900,000). Analysis from the U.S. Private Sector Job Quality Index estimates that 93.4 percent of all jobs lost in March 2020 were low-quality jobs, although it also notes that as the economy continues to suffer, higher-wage jobs increasingly face a risk of loss as well.
A disproportionate share of these low-wage jobs are (or were) held by people of color, relative to their share of the population.[22] For example, 24 percent of Blacks and Hispanics are employed in the services industries, compared with only 16 percent of Whites.[23] Leisure and hospitality jobs, particularly in accommodation and food services, are disproportionately held by Hispanics, and to a lesser degree Blacks.[24] Lower-paying jobs in health care and social assistance, particularly home health care, nursing care facilities, and residential care services, are much more likely to be held by Black women.[25] Just over 30 percent of construction workers are Hispanic.[26]
While a majority of jobs in essential industries are higher-paying, a significant share of such workers earn below the median wage, primarily those in sectors more likely to employ minorities.[27] These individuals are less likely to be able to afford not to work (although the enhanced unemployment benefits may change that calculation), and low-wage jobs are less likely to offer paid sick leave, paid family leave, or other paid time off, despite the increased risk of getting sick that most essential workers are now facing. [28] As a result, these workers may have to keep working while they or a family member is sick, and they are more likely to be working alongside a sick individual, increasing the risk of exposure at work. The inclusion of the Emergency Family and Medical Leave Expansion and the Emergency Paid Sick Leave provisions in the Families First Act may increase the rates of workers with access to paid leave. The Act’s requirements, however, create new challenges for businesses and exempt firms with 50 or fewer and 500 or more employees, making it difficult to know how many workers are actually benefitting from this new law.
Essential jobs in food manufacturing, agriculture, and grocery stores are all more likely to be held by Black or Hispanic or Latino individuals.[29] Minorities make up an outsized proportion of transportation and warehousing workers, particularly in bus service and urban transit, warehousing, and the postal service.[30] Many gig economy transportation workers are likely out of work as more people stay home and are less reliant on such services, but those who are still working – like all the workers in these other industries – face increased exposure risk as they come in close contact with high numbers of people throughout the day.
The April jobs report confirms what was largely expected: Unemployment increased by 10, 10.4, and 12.9 percentage points for Blacks, Asians, and Hispanics, respectively, while increasing 10.2 percentage points for Whites. While Blacks have not seen as dramatic a worsening in their unemployment rate, this is not a point of good news: Black unemployment was higher before the pandemic and while fewer have lost their job since it began, those who are still working, as mentioned, are more likely in a low-wage job and are facing a heightened health risk.
Living Environment
People of color are more likely to live in highly dense areas and have more people living within the house. The majority of COVID-19 cases are in large metro areas, and people of color make up over half (56 percent) of the total population of urban counties. [31],[32] Further – partially as a result of the increased tendency to live in dense urban areas with high living costs and partially because of cultural differences – minority populations are much more likely to live in multigenerational households where it may be more difficult to isolate a sick or at-risk individual in the house and prevent others from becoming infected. In 2016, 29 percent of Asians (including Pacific Islanders), 27 percent of Hispanics, 26 percent of Blacks lived in multigenerational households, but only 16 percent of Whites did so.[33]
Nutrition
Minority populations may also face greater challenges accessing adequate and nutritious food supplies. Food insecurity among Black households (21.2 percent) and Hispanic households (16.2 percent) is higher than the national average (11 percent).[34] The 10 counties with the highest food-insecurity rates are all at least 60 percent African American.[35] People of color are more likely to depend on school meals, impacting millions of children now that schools are closed. The Families First Act provided funding to allow schools to continue meal services, but because many families must now travel to the school themselves to pick up those meals, many children may have trouble accessing that food.[36] As unemployment has skyrocketed over the past two months, food-insecure families are now competing with more people for limited resources at food banks. A survey of Feeding America-affiliated food banks reported that 92 percent saw increased need and 64 percent saw a decline in food donations.[37]
Education
Because school-aged children are now more likely to be non-White, educational impacts will primarily affect children of minorities.[38] These negative outcomes will likely have long-lasting impacts.[39]
“Summer slide” is starting sooner and will deepen the impact. According to preliminary estimates, the “COVID-19 slide” will lead to students returning to school in fall 2020 with roughly 30 percent lower reading gains and 50 percent lower math gains from the previous year, relative to a typical school year.[40] Because minority children are more likely to have both a greater number of other children and fewer adults in the home, they may be less likely to have their caregiver’s full attention while being more likely to have distractions and to need to assist in caring for others.[41]
Children in communities of color are less likely to attend a school well equipped to provide distance learning. In fall 2016, the percentage of students who attended high-poverty schools was highest for Hispanics (45 percent), followed by Blacks (44 percent), AIANs (38 percent), Pacific Islanders (24 percent), individuals of 2 or more races (17 percent), and Asians (14 percent), compared to 8 percent of White students.[42] Now that most schools are closed, high-poverty schools are only half as likely to offer live instruction during COVID-19 compared with low-poverty schools.[43]
Minority children are less likely to have a computer and high-speed internet at home. In 2018, 79 percent of Whites had broadband internet at home, compared with 66 percent of Blacks and 61 percent of Hispanics.[44] Minority students are also less likely to have a computer at home: 35 percent of AINAs, nearly 30 percent of Blacks, and more than a quarter of Hispanics do not have a computer at home.[45] For those with in-home broadband connection, 25 percent of Hispanics and 23 percent of Blacks are “smartphone only” internet users, compared to 12 percent of Whites.[46] These challenges have resulted in higher truancy rates (not logging in to online classroom/not making any contact with teacher) among students at high-poverty schools: 32 percent in high-poverty schools compared to 12 percent in low-poverty schools.[47]
Thank you and I look forward to answering your questions.
Notes:
[1] https://www.cdc.gov/coronavirus/2019-ncov/need-extra-precautions/people-at-higher-risk.html
[2] https://www.cdc.gov/nchs/products/databriefs/db289.htm
[3] https://www.kff.org/disparities-policy/issue-brief/communities-of-color-at-higher-risk-for-health-and-economic-challenges-due-to-covid-19/
[4] https://www.kff.org/disparities-policy/issue-brief/communities-of-color-at-higher-risk-for-health-and-economic-challenges-due-to-covid-19/
[5] https://www.cdc.gov/nchs/hus/spotlight/HeartDiseaseSpotlight_2019_0404.pdf
[6] https://www.kff.org/disparities-policy/issue-brief/communities-of-color-at-higher-risk-for-health-and-economic-challenges-due-to-covid-19/
[7] https://www.kff.org/disparities-policy/issue-brief/communities-of-color-at-higher-risk-for-health-and-economic-challenges-due-to-covid-19/
[8] https://www.kff.org/disparities-policy/issue-brief/communities-of-color-at-higher-risk-for-health-and-economic-challenges-due-to-covid-19/
[9] https://www.kff.org/uninsured/issue-brief/key-facts-about-the-uninsured-population/
[10] https://www.kff.org/disparities-policy/issue-brief/communities-of-color-at-higher-risk-for-health-and-economic-challenges-due-to-covid-19/
[11] https://www.cdc.gov/coronavirus/2019-ncov/covid-data/covidview/index.html
[12] https://www.healthaffairs.org/doi/full/10.1377/hlthaff.2020.00598
[13] https://www.cdc.gov/coronavirus/2019-ncov/need-extra-precautions/racial-ethnic-minorities.html
[14] https://www.hhs.gov/about/news/2020/05/01/covid-19-funding-available-to-minority-rural-and-socially-vulnerable-communities-for-linkages-to-services-information-and-education.html
[15] https://www.hhs.gov/about/news/2020/05/07/hhs-awards-more-than-half-billion-across-the-nation-to-expand-covid19-testing.html
[16] https://www.cdc.gov/coronavirus/2019-ncov/downloads/php/funding-update.pdf
[17] https://www.hrsa.gov/coviduninsuredclaim
[18] https://www.bls.gov/opub/reports/race-and-ethnicity/2018/home.htm
[19] https://jamanetwork.com/journals/jamainternalmedicine/fullarticle/2765641
[20] https://www.bls.gov/opub/reports/race-and-ethnicity/2018/home.htm
[21] https://www.bls.gov/news.release/pdf/empsit.pdf
[22] https://www.brookings.edu/interactives/low-wage-workforce/, https://www.census.gov/quickfacts/fact/table/US/RHI825218#RHI825218
[23] https://www.bls.gov/opub/reports/race-and-ethnicity/2018/home.htm
[24] https://www.bls.gov/cps/cpsaat18.htm
[25] https://www.bls.gov/cps/cpsaat18.htm
[26] https://www.bls.gov/cps/cpsaat18.htm
[27] https://www.brookings.edu/blog/brookings-now/2020/04/03/charts-of-the-week-covid-19-and-workers/
[28] https://www.bls.gov/ncs/ebs/benefits/2019/employee-benefits-in-the-united-states-march-2019.pdf#page=119
[29] https://www.bls.gov/cps/cpsaat18.htm
[30] https://www.bls.gov/cps/cpsaat18.htm
[31] https://www.brookings.edu/blog/brookings-now/2020/04/03/charts-of-the-week-covid-19-and-workers/
[32] https://www.pewsocialtrends.org/2018/05/22/demographic-and-economic-trends-in-urban-suburban-and-rural-communities/
[33] https://www.pewresearch.org/fact-tank/2018/04/05/a-record-64-million-americans-live-in-multigenerational-households/
[34] https://www.ers.usda.gov/topics/food-nutrition-assistance/food-security-in-the-us/key-statistics-graphics.aspx#foodsecure
[35] https://www.feedingamerica.org/hunger-in-america/african-american
[36] https://www.cnbc.com/2020/03/14/widespread-school-closures-mean-30-million-kids-might-go-without-meals.html
[37] https://www.nbcnews.com/news/us-news/covid-19-crisis-heaps-pressure-nation-s-food-banks-n1178731
[38] https://www.pewresearch.org/fact-tank/2019/07/30/most-common-age-among-us-racial-ethnic-groups/
[39] https://www.tandfonline.com/doi/full/10.1080/02568543.2016.1273285
[40] https://www.nwea.org/content/uploads/2020/04/Collaborative-Brief_Covid19-Slide-APR20.pdf
[41] https://www.census.gov/population/socdemo/hh-fam/cps2002/tabAVG2.pdf
[42] https://nces.ed.gov/fastfacts/display.asp?id=898
[43] https://www.edweek.org/ew/articles/2020/04/10/the-disparities-in-remote-learning-under-coronavirus.html
[44] https://www.pewresearch.org/internet/fact-sheet/internet-broadband/#home-broadband-use-over-time
[45] https://usafacts.org/articles/internet-access-students-at-home/
[46] https://www.pewresearch.org/fact-tank/2019/08/20/smartphones-help-blacks-hispanics-bridge-some-but-not-all-digital-gaps-with-whites/
[47] https://www.edweek.org/ew/articles/2020/04/10/the-disparities-in-remote-learning-under-coronavirus.html
