Insight
May 20, 2020
U.S. Dependence on Chinese Pharmaceuticals is Overstated
Executive Summary
- The COVID-19 pandemic has resulted in shortages of medical supplies that are leading some to question the United States’ reliance on China for medicine and medical goods.
- In reality, U.S. supply chains are well diversified, with China supplying only 18 percent of total active pharmaceutical ingredient imports, 9 percent of total antibiotic imports, and less than 1 percent of total vaccine imports.
- Moreover, U.S. production of pharmaceutical goods is often understated: 70 percent of essential medical equipment is manufactured in the United States, and 70 percent of total antibiotic spending and 50 percent of total vaccine spending is on U.S.-made products.
- The best way to fight current and future pandemics is not to reduce the supply of medical goods with tariffs and Buy American laws, but instead to continue the United States’ deregulatory efforts and diversify U.S. supply chains even further.
Introduction
Shortages of medical goods during the COVID-19 pandemic have inspired widespread efforts to reduce U.S. dependence on Chinese pharmaceuticals. The president, members of his administration, and members of Congress have all argued that the United States must reduce its trade with China and instead manufacture more medicines and medical supplies within our borders. Proposals have ranged from subsidizing domestic production to instituting Buy American laws for government procurement, and even completely withdrawing from the global trading system.
While these arguments may be appealing during a time of crisis, they are based on a fallacy. The truth is that U.S. dependence on Chinese pharmaceuticals is significantly overstated.
What Percentage of Pharmaceuticals Are Made in the United States?
The United States is the largest pharmaceutical market in the world. After rebates, Americans spent $344 billion on medicines in 2018. Unfortunately, it is difficult to determine how much of that spending was on medicines produced in the United States and how much was on medicines produced abroad. A 2011 report from the Food and Drug Administration, however, suggests that 40 percent of U.S. spending was on imported medicine. The remaining 60 percent was spent on medicine produced in the United States. The drug market has certainly changed since then, but this is the most recent estimate available.
Which Countries Does the United States Rely on for Pharmaceuticals?
In 2019, the United States imported $127 billion of pharmaceutical goods.[1] These goods encompass more than just medicines; they also include medical bandages, testing kits, dental cements, and other pharmaceutical products. Ireland was the top provider of these goods, supplying 23 percent of pharmaceutical imports. The next two largest providers were Germany (13 percent) and Switzerland (12 percent. India was the fifth largest source country and China was the 17th largest, supplying 6 percent and 1 percent of pharmaceutical imports, respectively.
While examining data on imports of pharmaceutical goods can be instructive, it is not a good way to determine how many medicines are imported by the United States. Not only does the pharmaceutical goods category include a broad array of non-medicines, but not all imported medicines are included in the pharmaceutical goods category.[2] Therefore, while it is difficult to determine exactly how many medicines the United States imports, data exist for three important categories of medicine: active pharmaceutical ingredients, antibiotics, and vaccines.
Active Pharmaceutical Ingredients
Active pharmaceutical ingredients (APIs) are the biologically active components of medicine that make it effective as a treatment, i.e. the primary ingredient. Reporting suggests that 80 percent of APIs are manufactured in China, but that statistic is based on faulty information and the exact number is unknown. What is known is that, in 2011, 80 percent of APIs were manufactured abroad, in as many as 150 countries.[3] A more recent report from 2019 found that that the United States has twice as many API manufacturing facilities as China and more than any other nation.
To help determine the full extent of U.S. dependence on China for APIs, the following chart details the United States’ largest source countries for API imports using the latest available data.[4]
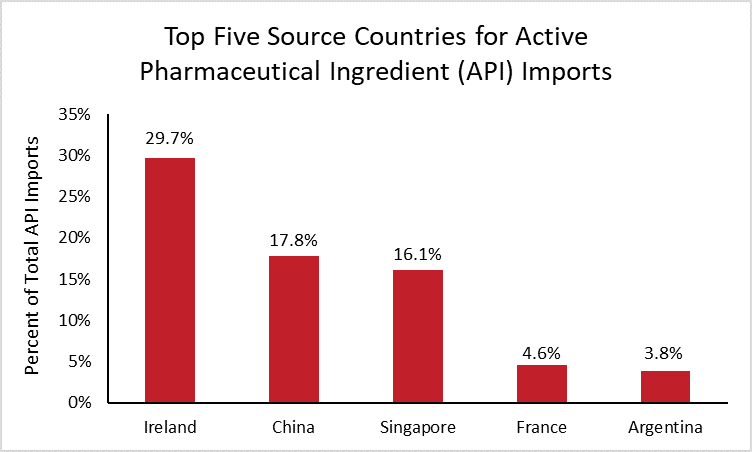
In 2019, the United States imported $132 billion of APIs. Ireland is by far the largest source country, supplying 30 percent of total U.S. API imports, followed by China (18 percent) and Singapore (16 percent). These source countries have changed significantly over the last decade, as supply chains have shifted and U.S. dependence on China has decreased. In 2010, China was the top supplier of API imports, and Ireland supplied less than 1 percent.
While it is unknown what percentage of APIs are imported and what percentage are manufactured by companies in the United States, the data show that the United States is not solely dependent on China.
Antibiotics
The United States’ dependence on China for antibiotics is similarly exaggerated. Reports suggest that 97 percent of all antibiotics in the United States come from China. The data simply do not support that claim.
There are no data on U.S. production of antibiotics. In 2015, however, roughly 30 percent of U.S. antibiotic spending was on imports, meaning the remaining 70 percent was spent on antibiotics manufactured in the United States.[5]
In 2019, the United States spent roughly $4.4 billion importing antibiotics manufactured abroad. The following chart breaks down the largest source countries for those antibiotic imports.[6]
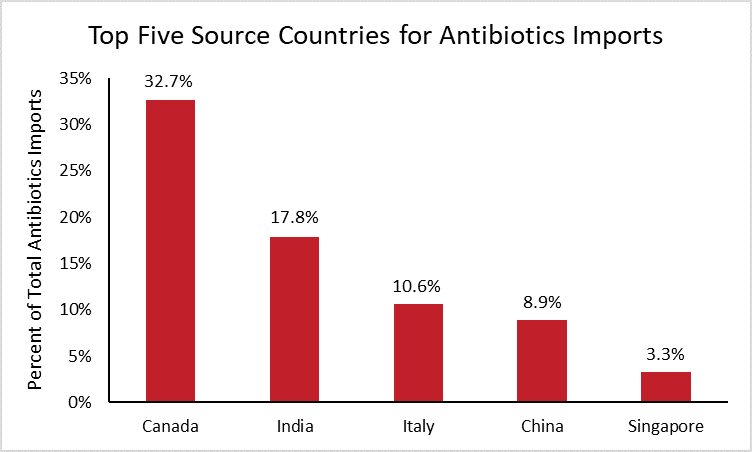
The chart reveals that Canada supplied one third of U.S. antibiotic imports in 2019, followed by India (18 percent) and Italy (11 percent). These nations have remained the top three sources for antibiotic imports over the past decade. Chinese antibiotics accounted for roughly 9 percent of total antibiotic imports in 2019, two percentage points higher than in 2010 when China was the seventh largest supplier.
While China is only the fourth largest supplier of total antibiotic imports today, it is important to note that the above data do not reflect the supply of individual antibiotics. For instance, nearly all penicillin G, a medicine used to treat bacterial infections such as meningitis, is produced in China. In such cases where a single drug may be used to treat a particular condition, exclusive sourcing may prove problematic despite the otherwise diversified supply chain.
Vaccines
A vaccine has not yet been developed for COVID-19, although the research is well underway. Dozens of companies in the United States are either in preclinical stages or conducting clinical trials for COVID-19 vaccines and treatments. Additionally, the European Union has invested $8 billion in vaccine research.
As for APIs and antibiotics, no data exist on overall vaccine production in the United States. What is known, however, is that the United States spent $11.4 billion on vaccines in 2018 and $5.8 billion on vaccine imports, meaning that half of all spending was on vaccines manufactured abroad.[7]
To determine which countries the United States depends on most for imported vaccines, the following chart shows the top five source countries for vaccine imports.[8]
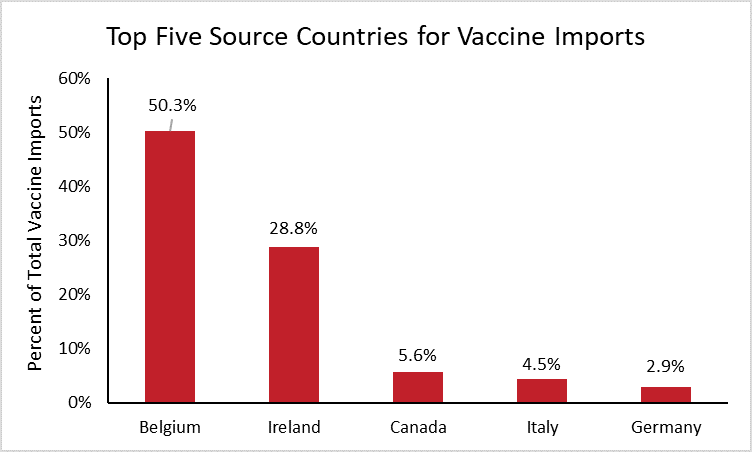
Half of all vaccine imports in the United States are from Belgium. This should come as no surprise, as Belgium is the top exporter of vaccines worldwide, supplying nearly one quarter of worldwide vaccine imports. Ireland is the second highest source of vaccine imports for the United States and the world, supplying 29 percent of U.S. imports and 21 percent of worldwide imports. Neither China nor India are large manufacturers of vaccines, each supplying less than 0.1 percent of U.S. vaccine imports.
What are the Implications?
The United States’ supply of medicine is very well diversified. China does not supply anywhere close to a majority of APIs, antibiotics, or vaccines in the United States, with the exception of particular antibiotics for which China has a comparative advantage in manufacturing. This diversification helps to explain how the United States has avoided drug shortages during the COVID-19 pandemic.
There is, however, an important distinction to be made between medicines and medical supplies such as ventilators and personal protective equipment (PPE). It is no secret that the United States has struggled to meet the demand for medical equipment, but that shortage is a product of poor government planning more than anything else. The total U.S supply of essential medical equipment is fairly diversified, with China supplying 28 percent of total imports and the European Union supplying 18 percent. Further, 70 percent of essential medical equipment is manufactured in the United States.
Despite the fact that the United States is not extremely reliant on China for medicine, there may be valid national security reasons to further diversify medical supply chains outside of China. The best way to accomplish this goal is through international cooperation. The United States is reportedly working to establish an alliance with our trading partner allies called an “Economic Prosperity Network.” Forming this network would be a similar strategy to the United States joining the Trans-Pacific Partnership and would be a great way to reduce overall dependence on China.
The United States is also considering increasing its tariffs on China as a punitive measure in response to COVID-19, which would restrict the global supply of goods and increase the prices of food, raw materials, and other imports during the crisis. The Trump Administration is additionally preparing Buy American mandates to onshore medical supply chains. Like tariffs, requiring medical goods be produced in the United States will increase prices and restrict options for U.S. consumers, exacerbating current shortages.
The best way to prepare for future pandemics is not to increase costs and reduce the supply of goods with tariffs and Buy American mandates. Instead, the administration should continue its deregulatory efforts – making it easier for U.S. companies to manufacture essential medical goods at home – and diversify U.S. supply chains even more.
[1] Data was retrieved from the U.S. International Trade Commission using HS code 30
[2] For example, active pharmaceutical ingredients and some antibiotics are classified as organic materials, not pharmaceutical goods.
[3] According to a report from the Food and Drug Administration
[4] Data was retrieved from the U.S. International Trade Commission by defining APIs as the following HS codes: 2936, 2937, 2939, 2941, 2942
[5] Based on 2015 U.S. antibiotic spending data from the National Center for Biotechnology Information and 2015 import data from the U.S. International Trade Commission
[6] Data was retrieved from the U.S. International Trade Commission by defining antibiotics as the following HS codes: 2941, 300310, 300320, 300410, 300420
[7] Based on 2018 U.S. vaccine spending data from the IQVIA Institute for Human Data Science and 2018 import data from the U.S. International Trade Commission. Data on vaccine spending does not account for discounts or rebates.
[8] Data was retrieved from the U.S. International Trade Commission by defining vaccines as the following HS codes: 300220