Insight
August 22, 2016
The 20th Anniversary of Welfare Reform
Twenty years ago today, President Bill Clinton signed into law the Personal Responsibility and Work Reconciliation Opportunity Act (PRWORA), instituting a major overhaul of the United States’ welfare system by replacing Aid to Families with Dependent Children (AFDC) with Temporary Assistance for Needy Families (TANF). In the early 1990s, enrollment in AFDC grew to record levels and it became clear to policymakers that the program was not particularly effective in leading families out of poverty, especially when it came to women and children. The welfare reforms, a cornerstone of the Republican congressional majority’s Contract with America, aimed to reduce poverty by making families less reliant on government assistance and incorporating work requirements to increase self-sufficiency. Lawmakers particularly wanted to improve the well-being of single mothers, who had low labor force participation and high rates of poverty. After two decades, let’s review the critical reforms under PRWORA and take a look at the trends in welfare recipients, single mother poverty and labor force participation, and child poverty.
AFDC vs TANF
AFDC was originally established by the Social Security Act of 1935 as Aid to Dependent Children (renamed AFDC in 1962) and was an entitlement program jointly funded by federal and state governments, as anyone who met both the federal and state requirements were entitled to benefits.[1] In the 1970s, however, AFDC enrollment grew very rapidly and over the course of the following two decades the program did not make any measurable impact on reducing poverty. This was particularly true among children, who remained in poverty at a high rate, and for single mothers, who remained in poverty at an even higher rate than children and infrequently participated in the labor force. Many policymakers were concerned that the long-term rise in welfare recipients was causing the high child poverty rates, fearing that some parents had become too reliant on the program and were not self-sufficient enough to climb out of poverty. As a result, the government may have been spending more and more money on low-income families, only to make matters worse.
In the early 1990s, the number of AFDC recipients spiked even further and in response to these trends policymakers reformed the welfare system by enacting PRWORA, which replaced AFDC with TANF. This changed welfare from an entitlement program to cash assistance for low-income families with children. With the overall goal of reducing reliance on welfare and increasing self-sufficiency among low-income families and particularly single mother-headed households, there were two major reforms associated with TANF. First, funding for welfare changed from a state-federal matching system to federal block grants, giving states flexibility in deciding how to administer TANF.[2] Second, PRWORA introduced work requirements for families who receive welfare payments. These work requirements were to be enforced at both the state and individual level. For instance, each state had to meet federally-set work participation requirements among its TANF recipients. In addition, TANF requires able-bodied recipients to participate in a work-related activity within 24 months of receiving the initial benefit. In another effort to encourage work, PRWORA introduced a time-limit for how long individuals can receive welfare benefits. In particular, individuals can only receive TANF benefits for up to 5 years over a lifetime, while states have the option of setting the limit to less than 5 years or to make payments beyond 5 years using their own funds.[3]
Trends in Welfare and Poverty
With all of these reforms in mind, let’s examine trends in official statistics on welfare enrollment, single-mother poverty and labor force participation, and child poverty before and after PRWORA became law.
Welfare Enrollment
Graph 1 illustrates the number of welfare recipients in the United States from 1960 to 2016.[4]
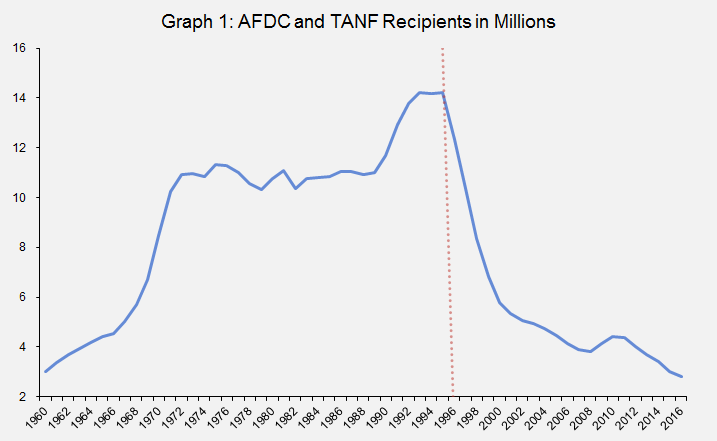
Prior to TANF, in the late 1960s and early 1970s there was a dramatic rise in welfare enrollment, where it remained elevated over the next two decades. In particular, enrollment in AFDC increased from 4.6 million in 1966 to 10.9 million in 1972. This means that in just six years, AFDC enrollment increased by 6.3 million recipients. In the 1970s and 1980s, enrollment in AFDC then hovered around 10 million to 11 million recipients, until it spiked again in the 1990s. In particular, between 1989 and 1995, the number of AFDC recipients increased from 11 million to 14.2 million.
Then the introduction of TANF in 1996 reduced welfare enrollment substantially. The most precipitous drop in enrollment occurred between 1995 and 2000, when enrollment declined from 14.2 million to 5.8 million. The number of TANF recipients continued to steadily decline and in 2016 stands at about 2.8 million.
Single Mothers
Single mothers face a much higher poverty rate than the national average. Graph 2 details the poverty rate among single mothers from 1959 to 2014.[5]
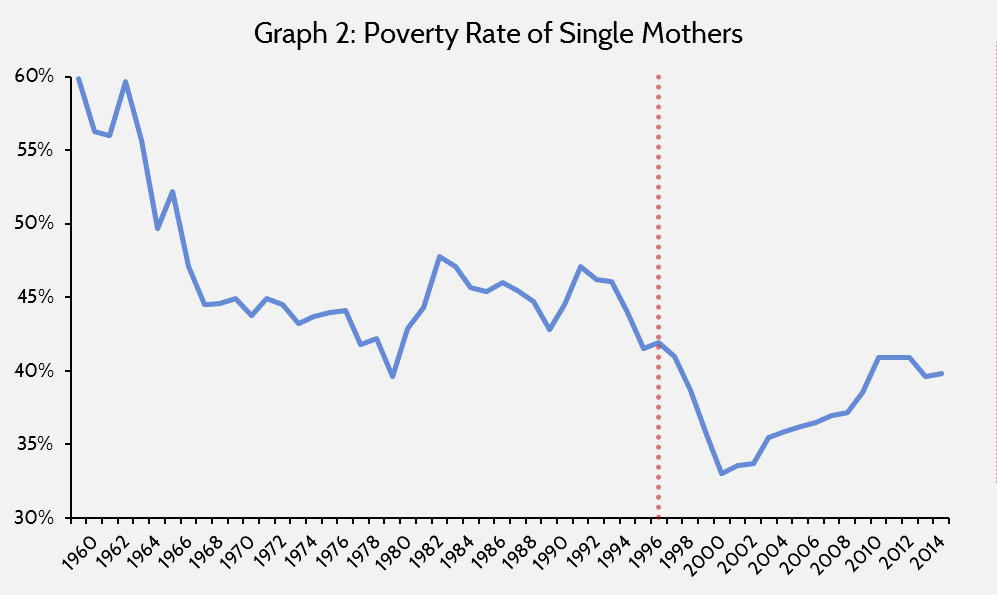
The graph illustrates that single mothers began the 1960s with an extremely high poverty rate, which declined substantially in the first part of the decade. In particular the single mother poverty rate declined from 60 percent in 1962 to 45 percent in 1967. Coinciding with the rise in AFDC enrollment, however, the single mother poverty rate did not continue to fall. Instead single mother poverty leveled out and hovered around the still high rates of 40 to 48 percent until the 1990s.
Beginning in the early 1990s and continuing after welfare reform, the poverty rate among single mothers began to decline again and reached an all-time low of 33 percent in 2000. Since then, the single mother poverty rate has begun to steadily rise again, perhaps in part due to the Great Recession, and as of 2014 was 40 percent.
Perhaps the 1990s decline in the poverty rate among single mothers was related to the rise in their labor force participation, another goal of welfare reform. For single mothers to get and stay out of poverty, it is particularly important for them to be involved in the labor force because they frequently are their families’ only source of income. Graph 3 contains the labor force participation rate of single mothers from 1975 to 2015.[6]
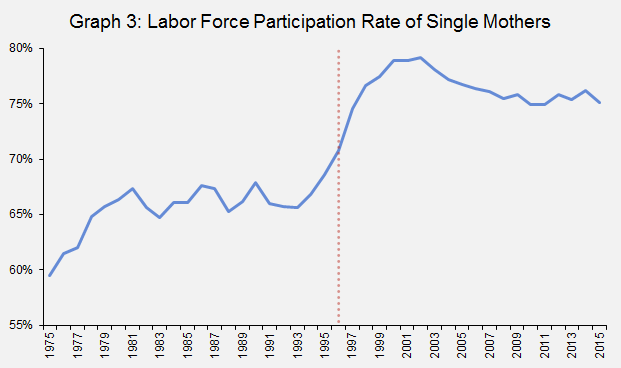
Although the labor force participation rate of single mothers rose rapidly in the 1970s from 60 percent in 1975 to 66 percent to 1979, the high level of AFDC enrollment persisted and may have contributed to the participation rate among single mothers flattening out at around 66 percent until the early 1990s. Coinciding with welfare reform, however, the United States experienced another dramatic increase in single mother labor force participation. In particular, the labor force participation rate for single mothers rose from 66 percent in 1993 to 79 percent in 2000. Since the early 2000s, however, there has been a slight downward trend in the labor force participation rate of single mothers, which was 75 percent in 2015.
Child Poverty
According to the official data, it appears that welfare reform may have temporarily reduced child poverty, which has since increased back to pre-TANF levels. Graph 4 contains the poverty rate among children under 18 years old from 1959 to 2014.[7]
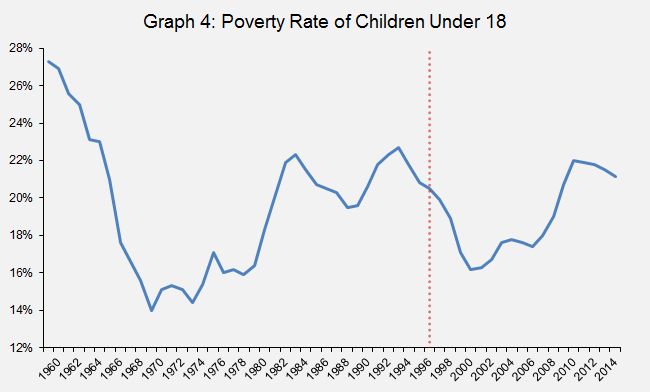
As was the case for single mothers, child poverty declined substantially in the 1960s from 27.3 percent in 1959 to 14 percent in 1969. However, as AFDC enrollment swelled and remained elevated, child poverty began to rise again in the 1970s and particularly in the 1980s. By 1993, the child poverty rate reached 22.7 percent.
In the initial years following welfare reform, child poverty declined again. By 2000, the child poverty rate was 16.2 percent. Unfortunately, this lower rate did not last long as the child poverty rate began to rise, particularly with the onset of the Great Recession. By 2014, the child poverty rate was back to 21.1 percent.
A similar trend appears when examining young children in poverty. Graph 5 illustrates the poverty rate of related children under 6 years old from 1969 to 2013.[8]
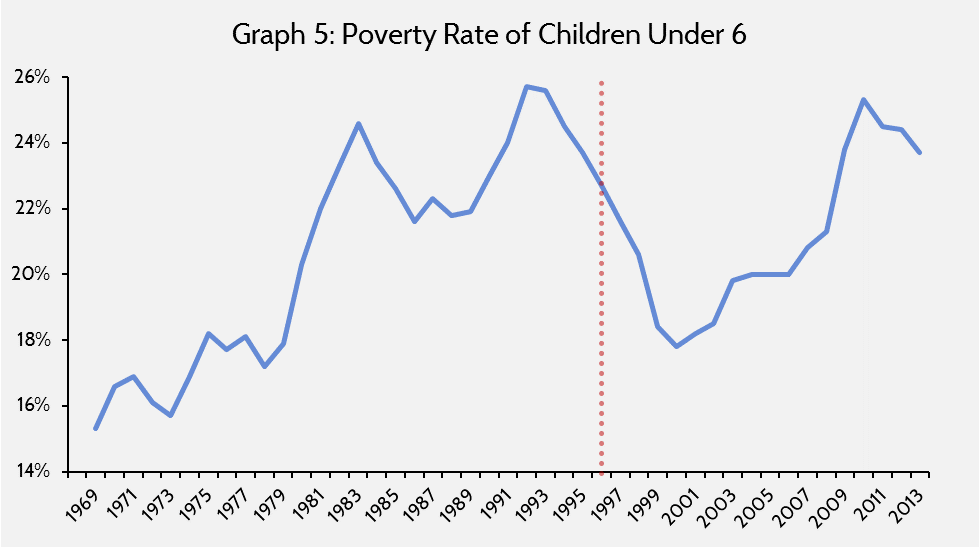
Like the overall child poverty rate, the poverty rate for children under 6 rose dramatically in the 1980s and early 1990s. By 1993, the poverty rate for young children was 25.6 percent. In the initial years after welfare reform, poverty among children under 6 fell dramatically, reaching a rate of 17.8 percent in 2000. Like the poverty rate for all children, after 2000 the poverty rate for children under 6 began to rise again, particularly since the Great Recession. In 2013, 23.7 percent of children under the age of 6 were in poverty.
Conclusion
The major welfare reform bill enacted 20 years ago today dramatically reduced the number of welfare recipients in the country. It seems that the bill’s focus on work requirements may have successfully increased work and self-sufficiency among single mothers, who continue to participate in the labor force at much higher rates than before the 1990s. Despite initial positive signals, however, many indicators have begun to move back towards pre-welfare reform levels. There has been a slow, yet steady increase in the single mother poverty rate since 2000 and the child poverty rate has already risen back to pre-welfare reform levels. These are important indicators for policymakers to keep in mind as they assess the next steps to continue improving the United States’ anti-poverty programs.
[1] Pamela Loprest, Stefanie Schmidt, & Ann Dryden Witte, “Welfare Reform under PRWORA: Aid to Children with Working Families?”, Chapter in NBER book Tax Policy and the Economy, Volume 14, 2000, p. 106, http://www.nber.org/chapters/c10850
[2] Ibid., pp. 162-167
[3] Ibid., pp. 184-189
[4] Office of Family Assistance TANF & AFDC Caseload data, http://www.acf.hhs.gov/ofa
[5] Census Official Poverty Measure, http://www.census.gov/data/tables/time-series/demo/income-poverty/historical-poverty-people.html
[6] Annual Social and Economic Supplement (ASEC) to the Current Population Survey, https://www.census.gov/did/www/saipe/data/model/info/cpsasec.html
[7] Census Official Poverty Measure, http://www.census.gov/data/tables/time-series/demo/income-poverty/historical-poverty-people.html
[8] Ibid.