Insight
June 20, 2018
Understanding the Policies that Influence the Cost of Drugs
Executive Summary
A recent report from the U.S. Department of Health and Human Services (HHS) found that prices for brand-name prescription drugs in Medicare Part D increased significantly between 2011 and 2015. During that period, several policies included in the Affordable Care Act (ACA) were implemented and either reduced drug manufacturer revenues or increased the cost of selling drugs. These policy shifts may explain much of the observed price increases.
- The ACA both expanded the Medicaid program and increased by 53 percent the mandatory rebate that drug manufacturers must provide for all Medicaid beneficiaries; consequently, drug manufacturers paid an estimated $80 billion in rebates between 2011 and 2015.
- The ACA required drug manufacturers to begin rebating 50 percent of the price of all brand-name drugs provided in the Medicare Part D coverage gap; these rebates cost the industry $19 billion during that period.
- The ACA expanded the 340B prescription drug discount program dramatically and the value of drugs subject to the program’s mandatory discount nearly doubled from $6.4 billion in 2011 to $12 billion in 2015.
- A new tax that the ACA imposed on all manufacturers and importers of brand-name prescription drugs cost the industry $14.1 billion over those five years.
Nevertheless, data from recent years indicate that drug prices may be leveling off.
Introduction
A majority of Americans are concerned about the cost of medicines in the United States, and understandably so, as a number of reports have come out over the last few years documenting sustained price growth.[1] The HHS Office of the Inspector General (OIG) published one such report recently detailing increases in costs for brand-name Part D drugs between 2011 and 2015.[2] The report highlights several notable points: 1) Total reimbursement for these drugs increased 77 percent, despite a 17 percent decrease in utilization; 2) After accounting for manufacturer rebates, reimbursement for these drugs increased 62 percent; and 3) The percentage of Part D beneficiaries with annual out-of-pocket (OOP) costs of at least $2,000 for brand-name drugs nearly doubled.
These findings on their own, however, do not tell the whole story of the price increases. Several ACA policies implemented during this period either caused or influenced these price increases. For policymakers to avoid exacerbating the problem, they must understand the policy environment driving these increases and analyze proposed remedies in light of it.
Recently Implemented Policies Impacting the Price of Drugs
The ACA included many provisions that either directly or indirectly impacted the cost of medicines. Most significantly, the ACA provided states the option to expand their Medicaid programs to childless adults earning up to 133 percent of the federal poverty level (FPL). Thirty states expanded their Medicaid programs by the end of 2015, resulting in 14.5 million new enrollees.[3] Drug manufacturers, as a condition of having their drug covered by Medicaid, are required by law to offer Medicaid the “best price” available to any other payer or provide a fixed rebate, determined as a percentage of the drug’s price, whichever is greater. The ACA also extended this requirement to Medicaid managed care organizations (MCOs) and increased the rebate amount for brand-name drugs by 53 percent up to 23.1 percent.[4] Thus, drug manufacturers became obligated to provide their drugs for roughly three-quarters of the price to nearly a quarter of the U.S. population.
The result was predictable: a sharp increase in the value of manufacturers’ rebates. In FY2010, Medicaid drug rebates equaled 42 percent of gross Medicaid drug costs. [5] Following the ACA’s changes, rebates grew each year as a percentage of expenditures, and by FY2013, Medicaid rebates equaled nearly 63 percent of the program’s gross drug costs.[6] From 2011 to 2013, Medicaid drug rebates totaled $40 billion, according to the Congressional Research Service (CRS)—yet even this sum might have been an underestimate.[7] An OIG report estimated that Medicaid drug rebates totaled $16.7 billion in 2012, $3.3 billion more than reported by CRS that.[8] Data for rebates paid in 2014 and 2015 were unable to be found, but in FY2016, Medicaid spent $30 billion on drugs after collecting more than $31 billion in rebates for prescription drugs, showing that the dollar value of rebates roughly doubled in a just a few years.[9] In sum, based on the trends in the available rebate data as well as net Medicaid spending on drugs reported in the National Health Expenditure data, it is estimated that from 2011 to 2015 drug manufacturers provided rebates to the Medicaid program of approximately $80 billion.[10]
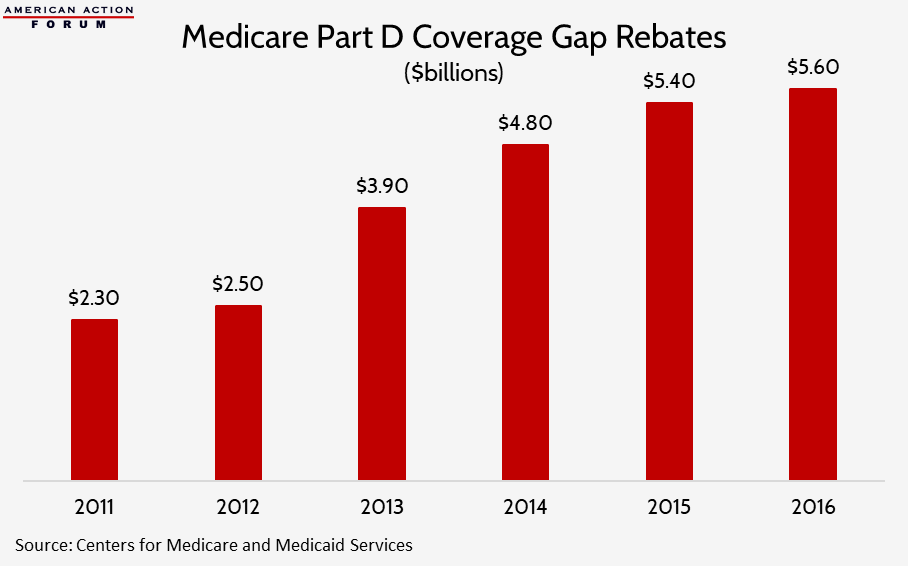
Next, the ACA mandated, in its effort to “close the coverage gap,” that drug manufacturers pay rebates of 50 percent for all brand-name drugs provided to Medicare Part D beneficiaries in the coverage gap phase of their prescription drug benefit. Between 2011 and 2015, these mandatory rebates cost drug manufacturers $19 billion, and another $5.6 billion in 2016, as the chart below shows.[11] The Bipartisan Budget Act increases the rebate percentage to 70 percent beginning in 2019 and also extends its application to biosimilar medicines, which will increase the cost of these rebates even further.
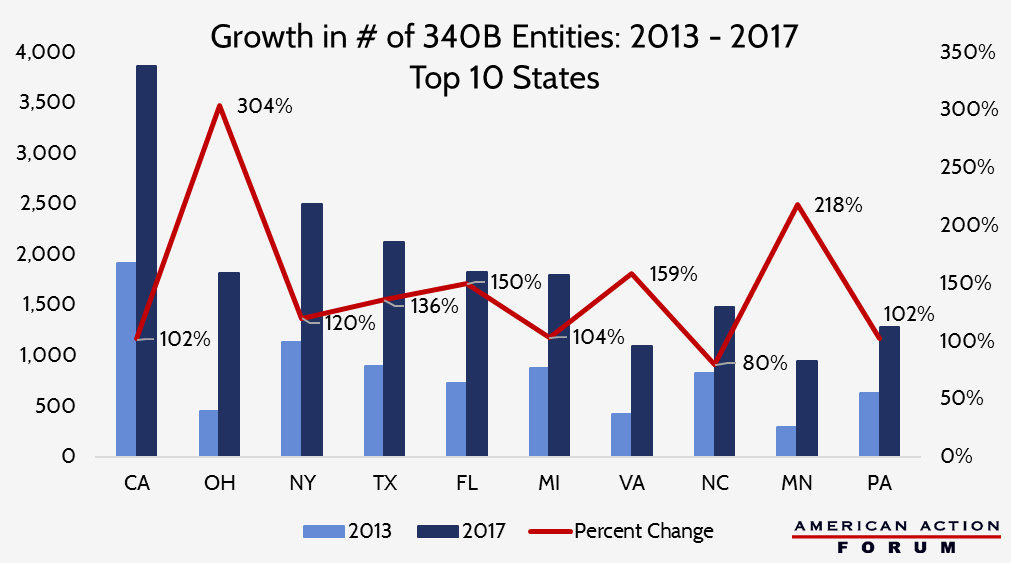
Third, the ACA expanded the eligibility requirements of the 340B drug discount program (explained in detail here). Between January 1, 2005, and the day the ACA was signed into law, less than 4,000 entities participated in the 340B program; between January 1, 2011, and December 31, 2015, more than 19,200 health care facilities registered as new 340B sites.[12] Similar to the Medicaid Drug Rebate Program, pharmaceutical companies are required by law, as a condition of participation in other federal programs, to provide medicines to eligible patients at 340B sites at or below a statutorily determined ceiling price. As a result of the program’s enormous expansion, the dollar value of sales under the 340B program nearly doubled between 2011 and 2015, from $6.4 billion to $12 billion, and climbed another 35 percent to $16.2 billion in 2016.[13]
Each of these policies either expanded the number of individuals for whom drug manufacturers were required to provide substantial discounts or increased the amount of the discount which must be provided, or both. To make up for the lost revenue, manufacturers likely raised their prices.
Another provision in the ACA directly increased drug manufacturers’ costs. The ACA imposed a new tax on pharmaceutical companies based on the sales revenue of a company’s brand-name drugs.[14] This tax on brand-name drug sales cost the industry $14.1 billion between 2011 and 2015 and has cost another $11.1 billion since.[15] This tax likely also contributed to rising prices, as it is not uncommon for companies to pass the cost of a tax on to their customers.

The timing of the study is also noteworthy when considering the OIG’s findings on the impact to beneficiaries’ out-of-pocket expenditures. The second half of the ACA’s provision to close the coverage gap involved increasing insurer liability while simultaneously decreasing patient cost-sharing for drugs in the coverage gap. This change was implemented gradually, beginning in 2011, and will be fully phased-in by 2020. By 2015, the end of the OIG’s analysis, this policy had not yet reached the 50 percent implementation point. Patient cost-sharing for brand-name drugs in the coverage gap in 2015 was 45 percent; by next year, it will be only 25 percent. High-cost Medicare beneficiaries’ total OOP expenditures are expected to be less than 4 percent higher next year than what they were in 2015.
Data from Past Two Years Veers from Trend Found in OIG Report
Data from the two years since the OIG report was conducted indicate the trend from 2011-2015 of ever-higher prices may be leveling off. Net prices for brand-name drugs still under patent protection increased roughly 9 percent in both 2011 and 2012, but only 3.5 percent in 2016[16] and 1.9 percent on average in 2017, below the rate of inflation.[17]
Further, most patients continue to face very little cost-sharing. Data published by the Centers for Medicare and Medicaid Services (CMS) in 2016 found that high-cost drugs are taken by an incredibly small number of patients; only one percent of all Medicare beneficiaries took a drug with total annual costs over $10,000 in 2014. In fact, average patient OOP costs were lower in 2016 than in 2013 for both brand-name drugs and generics.[18] Of all the prescription drugs taken by patients in the United States last year, 80 percent were provided for less than $10 in OOP costs to the patient; 98 percent had cost-sharing of less than $50.[19]
Conclusion
An analysis from PricewaterhouseCoopers estimated that, as a result of changes that the ACA made to the prescription drug market, brand-name pharmaceutical manufacturers would suffer a net loss of $140 billion from 2012 to 2021.[20] The above findings indicate that these provisions have already cost the industry roughly that much, if not more. It should not be surprising that the price of a good increased following multiple, significant government-imposed cost increases on the manufacture and sale of that good. That said, these cost increases certainly do not justify every price increase. Some drugs have experienced astronomical price increases and have appropriately been targeted for criticism.
Nevertheless, any discussion of policy remedies to decrease drug prices must take into account how the ACA’s policy changes increase costs. If policies aimed at bringing down drug prices fail to take the impact of these existing policies into consideration, they will likely fail to bring costs down meaningfully.
[1] https://www.kff.org/slideshow/public-opinion-on-prescription-drugs-and-their-prices/
[2] https://oig.hhs.gov/oei/reports/oei-03-15-00080.pdf
[3] https://www.medicaid.gov/medicaid/program-information/downloads/december-2015-enrollment-report.pdf
[4] https://www.medicaid.gov/medicaid/prescription-drugs/medicaid-drug-rebate-program/index.html
[5] https://www.everycrsreport.com/reports/R43778.html#_Ref395612812
[6] https://www.everycrsreport.com/reports/R43778.html#_Toc420920118
[7] https://www.everycrsreport.com/reports/R43778.html#_Toc420920118
[8] https://oig.hhs.gov/oei/reports/oei-03-13-00650.pdf
[9] https://www.macpac.gov/wp-content/uploads/2015/11/EXHIBIT-28.-Medicaid-Gross-Spending-and-Rebates-for-Drugs-by-Delivery-System-FY-2016-millions.pdf
[10] https://www.cms.gov/research-statistics-data-and-systems/statistics-trends-and-reports/nationalhealthexpenddata/nationalhealthaccountshistorical.html
[11] https://www.cms.gov/Newsroom/MediaReleaseDatabase/Press-releases/2017-Press-releases-items/2017-01-13.html
[12] https://340bopais.hrsa.gov/coveredentitysearch
[13] https://www.drugchannels.net/2017/05/exclusive-340b-program-hits-162-billion.html
[14] Section 9008 of the Patient Protection and Affordable Care Act http://housedocs.house.gov/energycommerce/ppacacon.pdf
[15] https://www.irs.gov/affordable-care-act/annual-fee-on-branded-prescription-drug-manufacturers-and-importers
[16] https://www.iqvia.com/institute/reports/medicines-use-and-spending-in-the-us-a-review-of-2016
[17] Download full report at: https://www.iqvia.com/institute/reports/medicine-use-and-spending-in-the-us-review-of-2017-outlook-to-2022
[18] https://www.iqvia.com/institute/reports/medicines-use-and-spending-in-the-us-a-review-of-2016
[19] https://www.iqvia.com/institute/reports/medicine-use-and-spending-in-the-us-review-of-2017-outlook-to-2022
[20] https://www.pwc.com/us/en/health-industries/health-research-institute/publications/pdf/implications-of-the-US-Supreme-Court-ruling-on-healthcare.pdf