Research
September 17, 2019
An Analysis of Federal Training Programs
Executive Summary
- The federal government operates a range of worker training programs, with some targeting specific populations and others aimed more generally; this study analyzes the costs and effectiveness of two general worker-training programs along with federal apprenticeship programs.
- Those who receive only career counseling are slightly less likely to be employed and ultimately earn less than those who participate in skills training, although four out of five participants in these programs participate in career counseling only.
- Participants in both federal worker training programs and apprenticeships are concentrated in industry sectors that are not projected to have the bulk of job growth over the next 5 years.
Introduction
In the Bureau of Labor Statistics’ (BLS) May 2019 release of Job Openings and Labor Turnover, employers reported about 7.3 million job openings but only about 5.7 million hires—a gap that has persisted since January 2015.[1] One reason for this gap is a lack of skilled workers, and employers in affected industries are noticing this skilled-worker shortage. A recent survey by the National Association of Manufacturers found that 69 percent of its members cite the lack of skilled workers as their main concern for the future.[2]
This gap will likely persist: With continuing advances in automation and technology, the economy will demand different skills from future workers than it does from current ones. Prior AAF research found the United States may face a significant skills gap in the coming decade, especially in terms of skills associated with post-secondary education.
While two-year and four-year degrees are essential for filling the gap, more concrete forms of career and skills training—whether by the private sector, states, or the federal government—can be valuable tools. The private sector spent about $87.6 billion on worker training in 2018.[3] In contrast, the federal government spent about $18 billion on employment programs in 2018, the majority of which went to welfare-based programs.[4] Current federal training programs focus on equipping dislocated, disadvantaged, and low-income workers with the necessary skills for today’s labor market. These programs can help close the skills gap and, ultimately, keep unemployment low.
This study focuses on the impact and effectiveness of federal programs. This analysis finds that, while generally effective in placing participants in employment now, federal programs are not aligned with the future demands for skills that the economy will place on workers.
Federal Career and Training Programs
By the end of fiscal year 2019, the federal government will have spent $18.9 billion on worker training across 47 programs.[5] Most federal worker career and training programs are administered by the Employment and Training Administration (ETA). A number of these programs are bundled into the Workforce Innovation and Opportunity Act (WIOA) of 2014, which Congress periodically has to reauthorize to allow the programs to continue.[6] WIOA authorizes federal funding to provide career services and training for adults and youths through both dedicated training programs and apprenticeships.
In addition to its WIOA programs, which are more general in focus, ETA also administers training programs aimed at specific populations, including the Trade Adjustment Assistance Program (TAAP), Job Corps, National Farmer Jobs Program (NFJP), Veterans’ Employment and Training Services (VETS), and the Wagner Peyser program. These various programs focus on specific sections of the labor market. Temporary Assistance for Needy Families (TANF) and State Vocational Rehabilitation Services are more general services and make up the bulk of federal spending on employment programs.[7]
This analysis focuses only on federal apprenticeships and WIOA Adult and Dislocated Worker Programs, which are the primary federal means of training and skilling the typical adult worker. The Adult and Dislocated Worker Programs emphasize finding employment for disadvantaged and recently laid-off workers, including low-income, disabled, and ex-felon workers. Within both Adult and Dislocated Worker Programs there are career services and training programs. If participants are judged unlikely to find employment even after receiving career services, they can apply for training services.
Workers interested in participating in WIOA Adult and Dislocated Workers Programs first visit their local State Workforce Agency (SWA) or One Stop Career Center. Agency and center staff administer assessments, perform interviews, and seek to verify the workers to determine which programs and what type of service workers can participate in. Career services consist broadly of skill assessments, eligibility determinations, and informational referrals. The goal of these services is to inform workers about different opportunities, helping to connect them with the labor market. Career services are divided into three tiers: basic, individualized, and follow-ups. Basic services provide counseling and referrals so that participants are more informed about local job opportunities. Individualized services provide skill assessments and career planning in addition to the basic tier. Participants that find unsubsidized employment are eligible to receive follow-up services 12 months after their initial employment.
As noted, certain eligible workers can also apply for training services. If SWAs and One Stop Career Center staff determine workers are unlikely to find employment even after receiving career services, they will be enrolled in WIOA training services. WIOA authorizes vouchers through Individual Training Accounts (ITA) so that workers can apply and pay for training programs provided by state governments and local community organizations.
Federal apprenticeships—employer-based programs funded by federal dollars—are another avenue for workers to receive training. Businesses are awarded tax credits if they meet federal goals and standards. While WIOA funds some apprenticeships, not all federal apprenticeships are funded through WIOA; this study looks at all federal apprenticeships, not just those funded through WIOA.
Assessing the WIOA Adult Programs
To be eligible for WIOA Adult Services, participants must be at least 18 years old. Participants must also fall below the poverty line or be deficient in basic skills. Those that receive a form of public assistance, including Temporary Assistance for Needy Families (TANF), Supplemental Nutritional Assistance Program (SNAP), and Supplemental Security Income (SSI), or are homeless, are automatically considered to be below the poverty line. “Basic skills deficient” is loosely defined as an individual unable to “compute,” i.e solve, work-related problems or read and write in English at a level that is necessary to complete basic work-related tasks.[8]
Table 1 provides a summary of WIOA adult program participants. This table is based on program year 2017 data, specifically April 2017 to March 2018, the last period of complete data available from the Department of Labor.[9]
Table 1: WIOA Adult Program Summary
| Service | Participants Entered | Participants Exited | Funds Expended | Funds per Participant |
| Career Services | 616,422 | 544,308 | $347,078,427 | $563 |
| Training Services | 164,752 | 85,705 | $290,836,432 | $1,765 |
| Total | 781,174 | 630,013 | $637,914,859 | NA |
Of the total 781,174 participants in WIOA Adult services, 78.9 percent received solely career services while only 21.1 percent received training services. The cost of a worker receiving training is about three times higher than the cost of a worker receiving career services. While about 88 percent of career services participants completed their program, only 52 percent of training services participants completed their program. The average duration of participants in the adult program is 15.6 weeks.
Table 2 provides a summary of WIOA Adult Program participant outcomes. Outcomes are quantified as performance indicators, namely employment rates after program exit and the median quarterly wage of participants. Table 2 demonstrates training services are more effective in finding employment for workers than career services and provide wage premiums.
Table 2: WIOA Adult Services Performance Indicators
| Performance Indicator | Career Services | Training Services |
| Employment 2nd Quarter after exit | 69.4% (377,750) | 81.3% (69,678) |
| Employment 4th Quarter after exit | 61.7% (335,838) | 76.2% (65,307) |
| Median Earning 2nd Quarter after exit (Quarterly) | $5,299 | $6,921 |
| Measurable Skills Gains | 7.70% | 39.70% |
Workers that received training services were 11.9 percentage points more likely to find employment two quarters after their exit than those that only received career services. Workers who completed training services also saw a quarterly wage premium of $1,622 compared to those that only received career services.
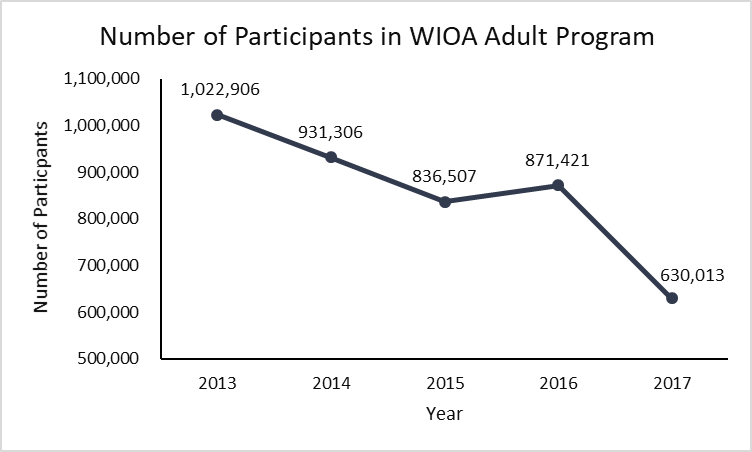
Despite these apparent successes, the number of participants per year in the Adult Program has decreased 38 percent from 2013 to 2017, as shown in the graph below.
Funding for both the Adult and Dislocated Programs sharply decreased from 2010 to 2013 before increasing through 2017. Funding for 2017, however, was still 5.4 percent below 2010 levels.

Table 3 below demonstrates a mismatch between the specific area in which workers are training and the future labor demands that employers will have. It compares occupational training data with projected job growth by industry. Of the 85,705 exiters of Adult Training Services, almost a third completed training in installation, repair, production, transportation, and material moving. These occupations, however, only represent about 6 percent of future job growth. Managerial, professional, and technical positions will represent about 44 percent of jobs created in the future, yet only about 13 percent of participants received training in those areas.
Table 3: Adult Training vs. Projected Job Creation
| Occupational Group | Percent Training in Particular Occupation | Percent of Total Projected Job Creation |
| Managerial, Professional, and Technical | 12.9 | 44.0 |
| Service Occupations | 38.0 | 31.5 |
| Sales and Clerical | 8.4 | 12.7 |
| Farming, Fishing, Forestry, Construction and Extraction | 9.6 | 6.1 |
| Installation, Repair, Production, Transportation, and Material Moving | 31.1 | 5.6 |
| Total | 100.0 | 100.0 |
Assessing the WIOA Dislocated Worker Programs
The eligibility requirements for the Dislocated Worker Program are also broad. Local and state workforce development boards (WDBs) have the independence to set the definition of a dislocated worker. WDBs commonly define dislocated workers as recently unemployed due to economic conditions and natural disasters in their surrounding community.[10] They also make the further distinction of workers that are unlikely to return to their prior occupation or industry, suggesting dislocated workers need services to find employment in other industries.
Table 4 provides a summary of the WIOA Dislocated Worker Program. It is based on program year 2017 data.[11]
Table 4: WIOA Dislocated Services Summary
| Service | Participants Entered | Participants Exited | Funds Expended | Funds per Participant |
| Career Services | 382,535 | 311,634 | $375,400,371 | $981 |
| Training Services | 87,066 | 44,127 | $210,433,303 | $2,417 |
| Total | 469,601 | 355,761 | $585,833,674 | NA |
As in the Adult Program, most participants in the dislocated worker program receive only career services, while a smaller fraction receive training services. Participants receiving training services also require much higher funding than those receiving career services. The average duration of participants in the Dislocated Worker Program is 17.1 weeks.
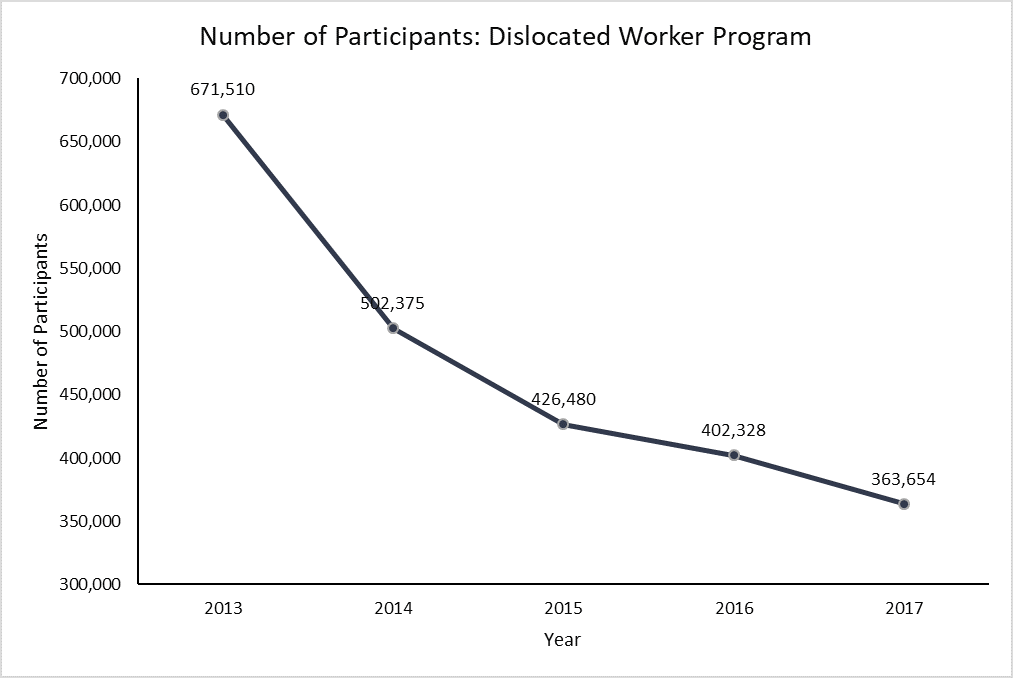
The number of participants in the Dislocated Worker Program has also steadily decreased from 2013 to 2017, seeing a 54.2 percent drop.
Funding, however, remained relatively steady from 2010 to 2017.
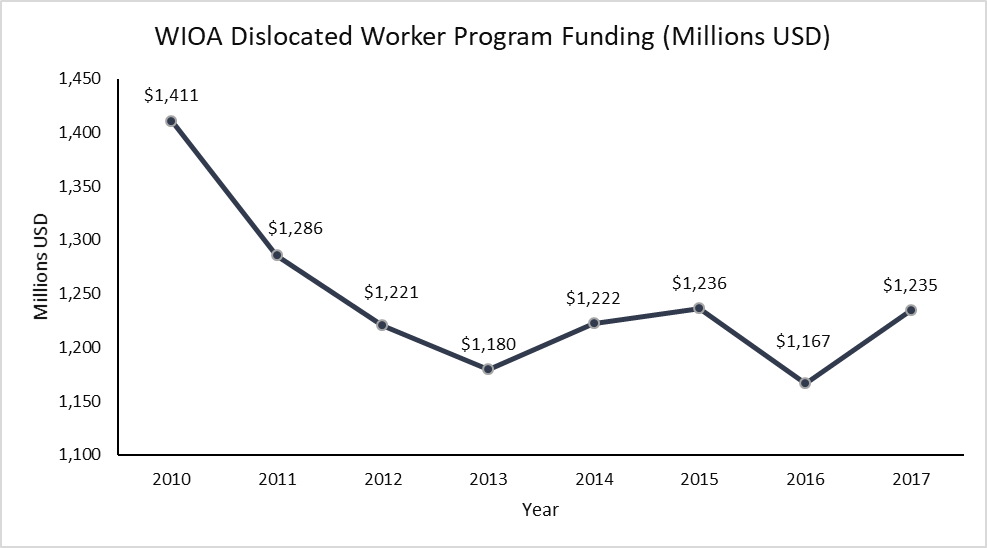
Table 5: WIOA Dislocated Worker Program Performance Indicators
| Performance Indicator | Career Services | Training Services |
| Employment 2nd Quarter after exit | 69.6% (216,897) | 81.0% (35,743) |
| Employment 4th Quarter after exit | 60.2% (187,604) | 75.9% (33,492) |
| Median Earning 2nd Quarter after exit | $6,693 | $8,356 |
| Measurable Skills Gains | 9.10% | 32.20% |
About 81 percent of training services participants found employment within two quarters of their exit, while almost 70 percent found employment from career services. This difference again suggests training services are more effective for workers in finding employment.
Further, just as in the Adult Program, the Dislocated Worker Program data suggest a mismatch between the training participants receive and the jobs that will be most available in the future. Table 6 reveals that only 29 percent of training participants received training for managerial, professional, or technical occupations, despite those occupations seeing the highest projected growth. About 33 percent received training in installation, repair, production, transportation, or material moving, despite those occupations seeing the lowest projected growth.
Table 6: Dislocated Worker Training vs. Projected Job Creation
| Occupational Group | Percent Training in Particular Occupation | Percent of Total Projected Job Creation |
| Managerial, Professional, and Technical | 28.4 | 44.0 |
| Service Occupations | 19.2 | 31.5 |
| Sales and Clerical | 15.0 | 12.7 |
| Farming, Fishing, Forestry, Construction and Extraction | 4.6 | 6.1 |
| Installation, Repair, Production, Transportation, and Material Moving | 32.8 | 5.6 |
| Total | 100.0 | 100.0 |
Assessing Federal Apprenticeships
In June 2017, the White House specifically directed the expansion of registered apprenticeships across the country.[12] Apprenticeships are traditionally an effective way of providing workers with on-the-job training and experience to develop skills and advance in their profession.
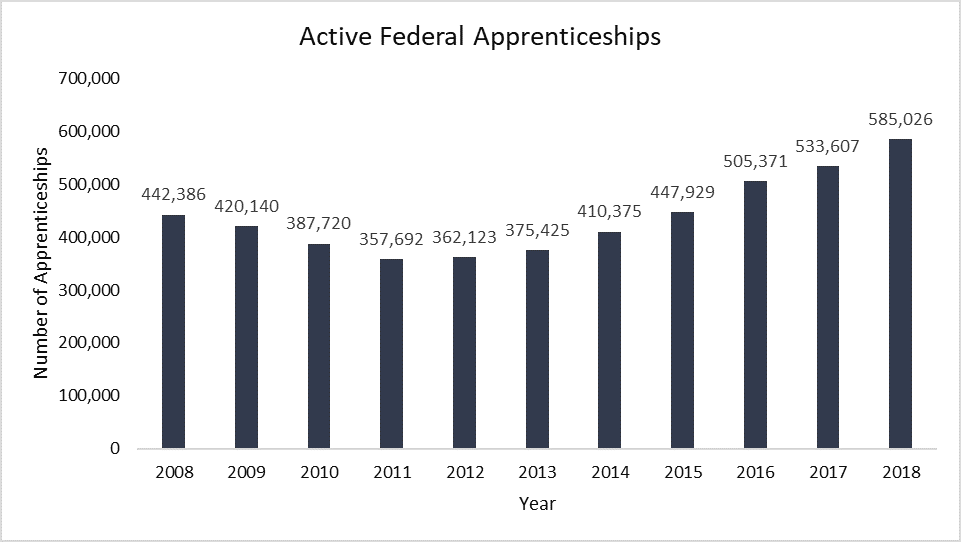
In contrast to WIOA Adult and Displaced Worker Program participation, which has declined since 2013, the number of people in registered apprenticeships has steadily increased since 2013, with 583,026 active in fiscal year 2018.[13]
Nevertheless, a disconnect similar to that seen in Adult and Dislocated Worker Programs exists in federal apprenticeships. Table 7 reveals that 75 percent of federal apprenticeships train workers in the goods-producing sector. This sector includes construction, extraction, mining, and manufacturing, yet these industries will only create 0.6 percent of total jobs through 2024. In contrast, the service industries will provide almost the entirety of occupational growth, while only 25 percent of apprenticeships are in service-providing occupations.
Table 7: Active Federal Apprenticeships vs. Job Creation by Industry
| Industry | Active Number of Apprenticeships | Percent of Apprenticeships | Percent of Total Projected Job Creation |
| Goods-Producing | 182684 | 74.7 | 0.6% |
| Service Providing | 61164 | 25.0 | 94.6% |
| Agriculture, Forestry, Fishing, and Hunting | 761 | 0.3 | -1.1% |
| Non-agriculture Self-Employed | 0 | 0.0 | 5.9% |
| Total | 244609 | 100.0 | 100.0% |
Implications and Conclusions
While there is much focus on short-term labor market developments, understanding the long-term trends is much more vital to sustained and stable economic growth. With an aging population and a technology-based economy, the government has a large stake in promoting skills growth in the workforce. While traditional education is a vital part of providing the skills of the labor force, alternative training programs and apprenticeships are also key tools in closing the future skills gap.
Effective training programs can help workers find occupations despite short-term labor market shifts. They can also equip workers with skills to find rewarding careers. Federal training programs can be an effective tool in connecting workers with economic growth.
This analysis indicates that current federal career and training programs do effectively place participants into employment. It also reveals potential challenges. One, providing skills training results in higher employment rates and greater earnings than just providing career counseling. Policymakers will need to weigh the potential benefits of expanding the training program against the costs of such an expansion. And two, the training programs are not training workers proportionately in the fields where there will be overall job growth in the economy. As the economy shifts, federal job training programs could increasingly become less effective and obsolete. Policymakers would do well to take both trends into consideration during future reauthorizations of federal apprenticeship and WIOA programs.
[1] https://www.bls.gov/jlt/#news
[2] https://www.washingtonpost.com/news/powerpost/paloma/daily-202/2019/07/09/daily-202-nam-launches-a-10-million-campaign-ahead-of-2020-to-make-manufacturing-jobs-more-appealing/5d2376c61ad2e552a21d52f2/
[3] https://trainingmag.com/trgmag-article/2018-training-industry-report/
[4] https://www.whitehouse.gov/wp-content/uploads/2019/06/Government-Employment-and-Training-Programs.pdf
[5] https://www.whitehouse.gov/wp-content/uploads/2019/06/Government-Employment-and-Training-Programs.pdf
[6] https://wdr.doleta.gov/directives/attach/TEGL/TEGL_19-16_acc.pdf
[7] https://www.whitehouse.gov/wp-content/uploads/2019/06/Government-Employment-and-Training-Programs.pdf
[8] https://dlr.sd.gov/workforce_services/wioa/wioa_manual/4.8_basicskillsdeficient.pdf
[9] https://www.doleta.gov/performance/results/WIASRD/PY2017/PY_2017_WIOA_and_Wagner-Peyser_Data_Book.pdf
[10] https://wdr.doleta.gov/directives/attach/TEGL/TEGL_19-16_acc.pdf
[11] https://www.doleta.gov/performance/results/WIASRD/PY2017/PY_2017_WIOA_and_Wagner-Peyser_Data_Book.pdf
[12] https://www.whitehouse.gov/presidential-actions/3245/
[13] https://www.doleta.gov/oa/data_statistics.cfm