Research
May 19, 2021
Measuring Poverty in the United States: Comparing Measurement Methods
Executive Summary
- The Official Poverty Measure (OPM) estimates roughly how many people are unable to afford basic needs without any (or with very little) government assistance based on income and an average national cost of food in the 1960s, adjusted annually for inflation.
- The Supplemental Poverty Measure (SPM) uses more of a net income approach to estimate how many people are unable to afford anything besides basic needs after they have received government assistance and paid certain expenses, based on average costs of food, clothing, utilities, and localized housing costs.
- A consumption-based poverty measure, as opposed to income-based measures, may better gauge material deprivation by assessing what people actually buy or are provided, but the government does not use this type of metric.
Introduction
In 2019, 10.5 percent of Americans (34 million) were classified as poor, the lowest rate since the federal government began publishing such data in 1959.[1] How was this classification determined? The basic goal of a poverty measure is to identify whether an individual faces material hardship. A useful starting point is a person’s material wellbeing in the absence of any available assistance, i.e., the degree to which they are self-sufficient. The Official Poverty Measure (OPM) essentially describes the inability to meet a self-sufficiency threshold, although it does include some public transfer payments in a household’s resources.
A related question is the material well-being of the individual in the presence of government assistance and net of necessary expenses. The Supplemental Poverty Measure (SPM), which accounts for all federal government transfers and benefits as well as typical expenses, provides the best proxy for potential material deprivation.
Note, however, that the SPM simply estimates the potential for deprivation based on total net income. A true measure of material hardship would directly measure what specific needs people are lacking. In this regard, a consumption-based poverty measure could more accurately gauge material deprivation by identifying what people consume and, in turn, what they don’t.
This paper does not attempt to answer questions around what a person needs and at what point they should be considered poor, but rather describes these different methods typically employed to make such assessments. It also describes the implications and potential flaws of those methods.
Methods of Measuring Poverty
The federal government uses two metrics to measure poverty: the Official Poverty Measure (OPM) and the Supplemental Poverty Measure (SPM), each with two components: an income threshold below which an individual is considered impoverished, as well as a count of such individuals. The OPM has been in place since 1963, while the SPM—a more comprehensive measure of the ability to purchase goods—was not introduced until 2011. Using the OPM threshold, a simplified official poverty guideline is established by the Department of Health and Human Services each year for purposes of determining eligibility for a variety of welfare programs.
The Official Poverty Measure
The Official Poverty Measure, calculated by the U.S. Census Bureau, is used for official statistics regarding the number of people in poverty. The OPM threshold, since its inception, has been based on the cost of a minimum food diet in 1963, adjusted annually for inflation using the Consumer Price Index for All Urban Consumers (CPI-U) and assuming food accounts for one-third of a household’s basic costs, as explained here. There is no geographic adjustment, simply a national threshold.
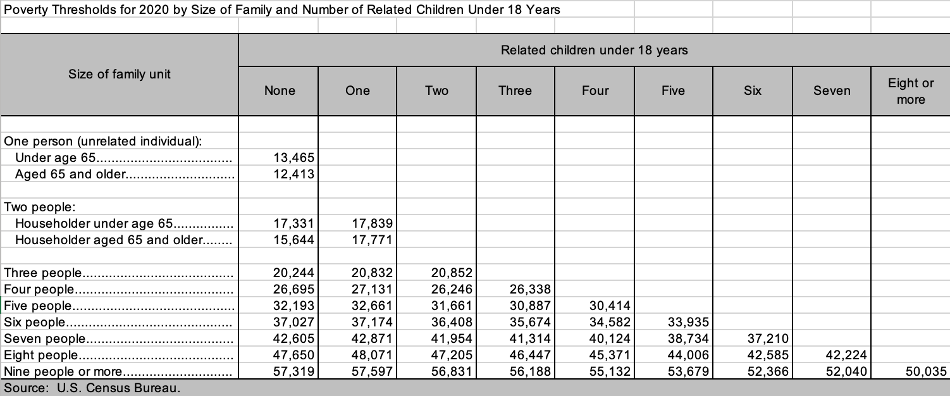
Determining whether someone is above or below the OPM threshold is based on money income before taxes (including cash-like benefits, such as Social Security payments, unemployment benefits, and child support payments) but not including capital gains, non-cash benefits (such as food or housing subsidies), or the value of tax credits received. OPM status is measured at a household level and varies by household size as well as the ages of household members (with members categorized as children (under age 18), elderly (age 65 and older), or non-elderly adults (18-64 years of age)). This estimate is made using data from the Annual Social and Economic Supplement to the Current Population Survey (CPS ASEC), which the Census Bureau conducts in February, March, and April each year, asking roughly 100,000 households about 50 different potential sources of income, including non-cash benefits.[2]
Poverty thresholds—shown in the table below—are lower for elderly adults and higher for households with children up to a household size of three, meaning that a household of the same size with children can have higher income than a household without children and still be considered poor; similarly, a household with non-elderly adults may have higher income than an elderly household and stay below the threshold while the other would not. If there are four or more adults in the house, the threshold grows faster for each additional adult than child. Under the OPM, people are considered part of the same household—and thus able to share resources—if they are related to one another; thus, everyone in a household is equally considered to be poor or not.
Official Poverty Guidelines
Based on the OPM, the Department of Health and Human Services publishes annually the official poverty guidelines (referred to as the Federal Poverty Level), which are a simplified version of the poverty threshold used for determining eligibility in various government programs (many of which use a multiple of the guideline, for example, 150 percent or 250 percent). The guidelines are published in January of each year, based on the thresholds and accounting for inflation during the year prior. Geographical considerations are made only for Hawaii and Alaska.
The Supplemental Poverty Measure (SPM)
Following congressional concerns regarding the adequacy of the OPM, the Census Bureau has also published the Supplemental Poverty Measure (SPM) since 2011, which uses a more comprehensive assessment of income and expenses than the OPM and includes the value of federal non-cash benefits, as well as the cost of taxes and other expenses paid (such as childcare, medical, and commuting costs) to convey a more accurate picture of an individual’s net income. Relative to the OPM, the SPM assumes more people within a household share resources (including unrelated children and foster children in the home and unmarried partners and their relatives).
Also unlike the OPM, the SPM considers a more comprehensive assessment of needs, including food (based on today’s cost), clothing, shelter, and utilities (FCSU) in determining the threshold. The threshold is based on spending for these items at the 33rd percentile of the expenditure distribution plus 20 percent to account for the cost of other necessities, such as household supplies and personal care items. The SPM also provides an adjustment for geographic differences in housing costs (as well as whether an individual rents or owns and, if owns, has a mortgage or not).
This map shows the impact of the additional considerations of the SPM relative to the OPM.[3] The Census report notes geographic differences in costs, particularly for housing, medical care, and taxes, are most likely to determine whether the SPM rate in a given state is more or less than the OPM; the inclusion of tax credits as income also has a significant impact.
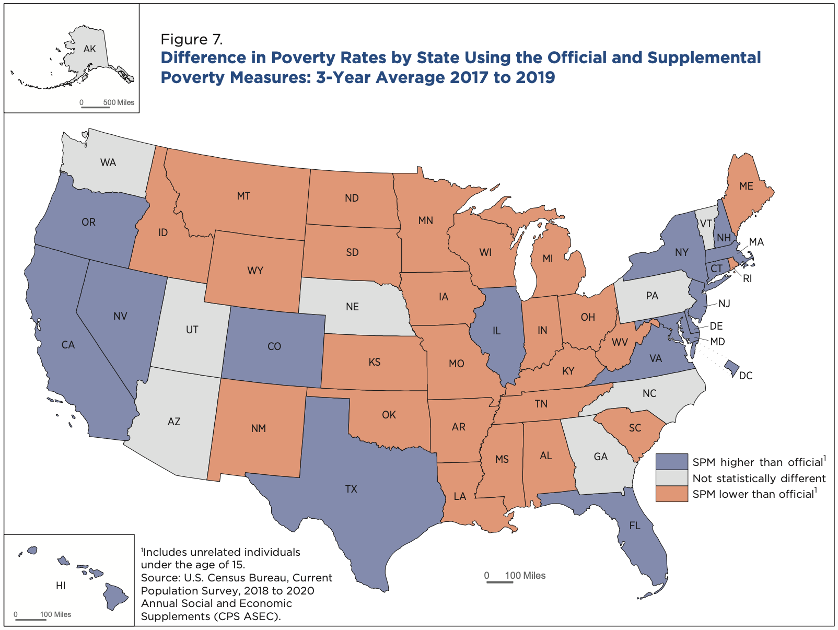
Source: https://www.census.gov/library/publications/2020/demo/p60-272.html
A comparison of the SPM and OPM thresholds for a two-parent, two-child household (the base unit for the SPM) is below. The SPM threshold is above the OPM (and highest) for households who own their home but have a mortgage, followed by households who rent. Households who own their home without a mortgage are subject to a lower poverty threshold, reflecting the fact that their costs for shelter are lower.
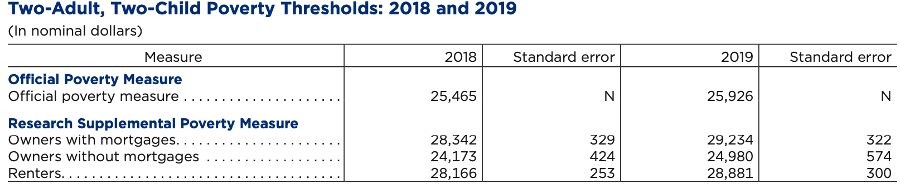
Source: https://www.census.gov/library/publications/2020/demo/p60-272.html
The White House Office of Management and Budget (OMB) convened a working group in 2016 to assess the need for additional changes to the SPM, and the Census Bureau is expected to implement those changes in September 2021.[4] The planned changes include moving the threshold basis from the 33rd percentile of the expenditure distribution to the median; replacing the cost of telephone services with internet services; including the value of in-kind benefits; adjusting for inflation based on price changes for the FCSU components rather than the general CPI-U measure; and expanding the estimation sample from households with two children only to those with any number of children.[5] Another working group was formed by OMB in 2019 to evaluate possible alternative measures of poverty; the work is ongoing.[6]
Consumption-Based Poverty
A consumption-based poverty measure assesses what people consume or purchase, regardless of how it was paid for (whether through income, tax credits, or non-cash benefits) to determine whether their needs are being met or not. In other words, this metric accounts for all types of benefits and aid that might be provided, as well as expenses. A consumption-based metric serves as a good proxy for material hardship or wellbeing. Assessing consumption eliminates the need to determine what necessities cost while also providing a sense of the value people place on various goods by observing what they prioritize.
Flaws, Shortcomings, and Differences Among these Metrics
Scholars and policy experts often talk about the flaws and shortcomings of the various metrics and their methodologies. While there are certainly opportunities for improvements, some of these “flaws” may be more appropriately thought of as differences in their measurement that must be understood in order to ensure their appropriate use. Each measure has its usefulness, depending on the question to be answered.
Official Poverty Measure
The OPM has been criticized for its simplicity and perceived outdatedness, though its simplicity can be part of its usefulness.
A common criticism is the single national threshold given that it is widely understood that the cost of living varies dramatically across the country, within states, and even within cities. As explained here, the primary reason for these cost-of-living differences is the varying cost of housing, particularly for renters, with costs in metro areas ranging from 50 percent below the national average to more than 200 percent above. The average family spends about 20 percent of their income on housing, which leads to the next point of criticism.[7]
With housing consuming 20 percent of the average family budget, using a metric based solely on the cost of food and still assuming food accounts for one-third of an individual’s budget for basic needs may no longer be appropriate. In 2019, the average American family spent just 9.5 percent of its disposable income on food, well below the average cost of housing.[8] Even in 1960, around the time this measure was developed, the average share of a family budget spent on food was 17 percent, far below one-third.[9] But averages mask important differences throughout the income spectrum.
There are significant differences in spending between higher and lower income families that are necessary to keep in mind when trying to measure poverty. In 2019, the poorest 20 percent of Americans spent 36 percent of their income on food compared with 8 percent for the highest income quintile, suggesting the one-third food assumption may still be appropriate in calculating a poverty threshold, even if not the best method.[10]
Similarly, there are significant differences in the proportion of housing costs by income level and by whether an individual rents or owns—which is accounted for by the SPM. In general, the bottom third of households by income spend an estimated 40 percent of their income on housing, compared with 30 percent for high-income households.[11] The differences are greater for renters: Those in the lowest income quintile are most likely to rent (58 percent) and the median renter in this quintile spent 56 percent of income on rent, based on 2015 data.[12] Just 13 percent of the top quintile rents, spending a median of 10 percent of income.[13] For those who own their home, mortgage payments averaged 15.2 percent of people’s income in 2019, though mortgage costs did tend to increase as a share of one’s income as income rises.[14]
Because of the greater share of expenditures, as well as the fluctuation in costs from one area to another, localized housing costs may be a better basis for the poverty threshold than food. Not accounting for regional cost-of-living differences means that people living in high-cost areas will be less likely to be considered poor (and thus less likely to be eligible for government assistance) despite their material circumstances being very similar to those in lower-cost areas who are considered poor but are more able to afford necessities on their own because of the lower costs. This phenomenon may, however, be somewhat mitigated—at least for those who are working—by the fact that wages tend to be higher in high-cost areas.[15]
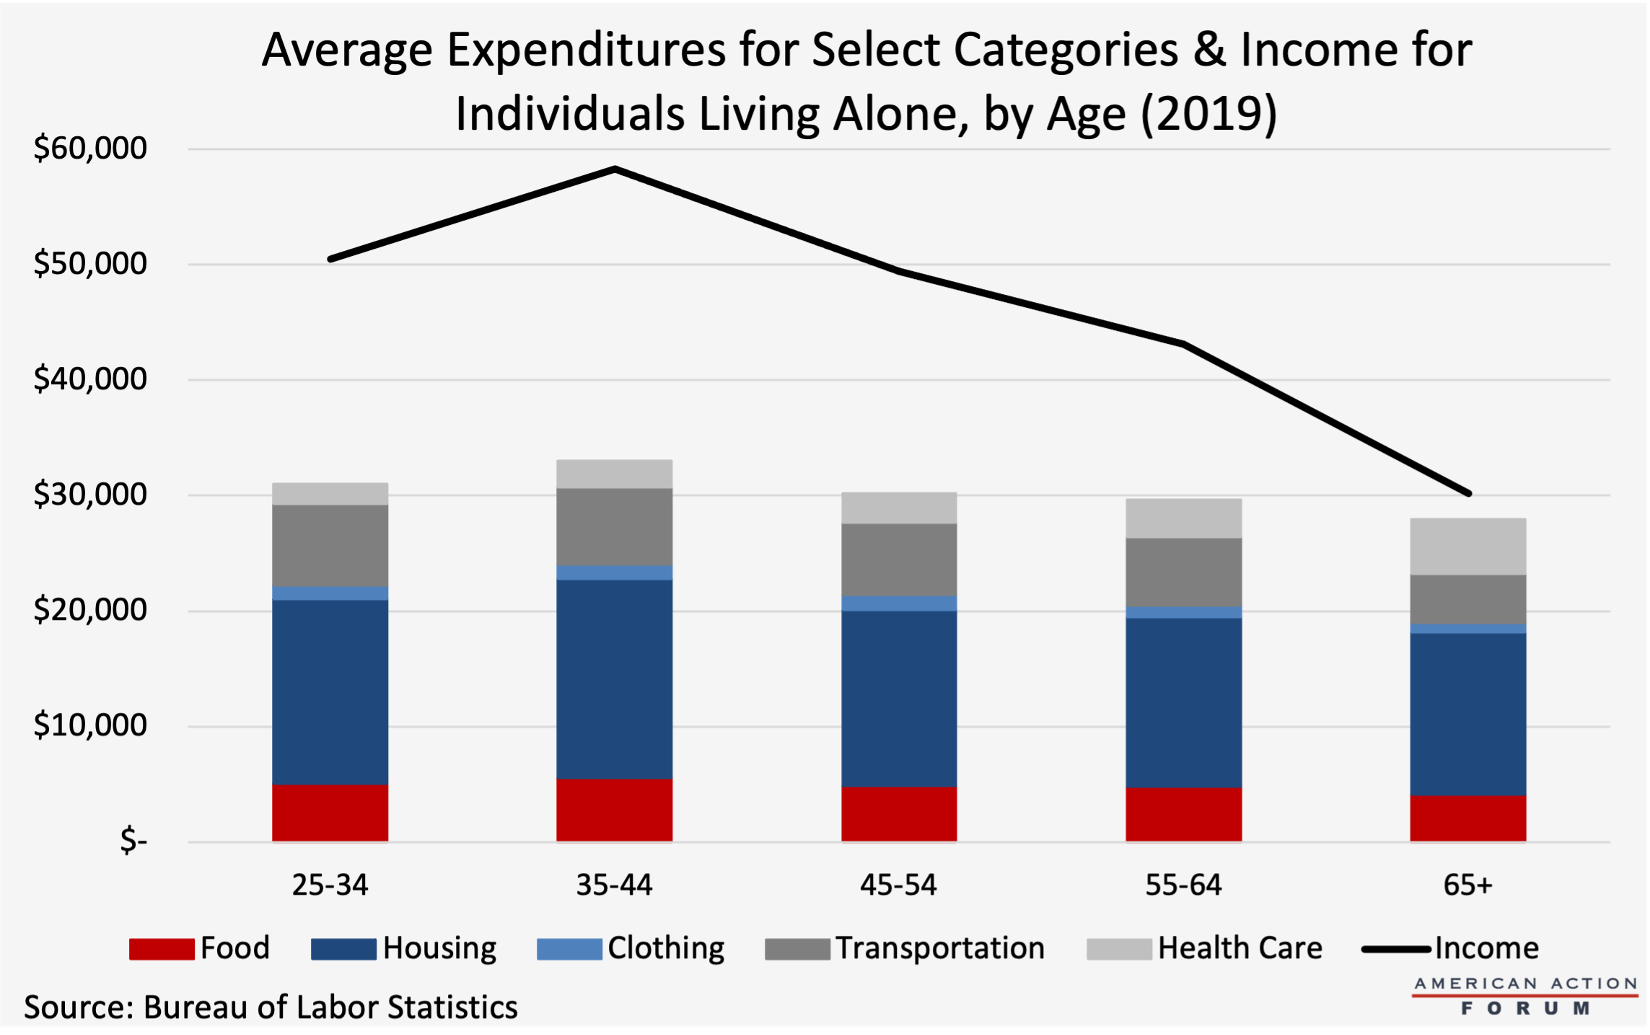
Another factor of the OPM deserving consideration is the threshold’s age-based adjustments. A lower threshold for the elderly implies that the costs of necessities decline after retirement. Admittedly, household expenditures tend to be highest between the ages of 35-54 when households are most likely to have 3 or more people living together (with the average household consisting of 2 adults and 1 child).[16] Even when considering only households with a single occupant, expenditures are highest for the 35-44 year-old age range, with food accounting for roughly 10 percent of income and housing accounting for 30 percent, while Individuals over 65 typically spend less on most basic needs.[17] Because of their lower income, however, these expenditures account for a much higher share of income, with 47 percent spent on housing and 14 percent on food. Health care costs are typically twice as high, accounting for 3-4 times more of their income.[18] Costs for clothes and transportation are roughly equal for all age groups, accounting for 2-3 percent and 12-14 percent, respectively.[19] Considering just these essential categories, it seems the OPM’s age adjustment may be backwards from what it should be, if concerned about disposable income and the ability to pay for any other goods: Among those living alone, the average elderly individual spends less on these five categories but they account for 93 percent of their income, while the average 25–54-year-old spends between 57 and 62 percent of income on such goods.[20]
Despite these flaws, the OPM’s simplicity may be what makes it most useful. By simply analyzing an individual’s income before any non-cash assistance is provided, it provides a clearer picture of an individual’s ability to provide for himself or herself and the degree to which he or she may need assistance. This indicator is the best starting point from which to determine eligibility for any benefits, including tax benefits.
Supplemental Poverty Measure
The SPM tends to be more highly regarded than the OPM because it is more nuanced, but its methodology also has points that should be carefully considered. By setting a threshold based on the cost of not just food, but also other necessities including clothing, shelter, and utilities, it more accurately reflects how much a person needs to meet basic necessities, its most beneficial difference.
Adding the value of benefits received and subtracting expenses in the calculation of whether one is above or below the threshold is less an improvement, per se, and more an alteration of what that assessment tells us: It is no longer simply an estimation of one’s ability to afford certain basic expenses without any help, as the OPM does; it is measuring one’s ability to pay for other items. Including the value of benefits in the poverty threshold only makes sense in assessing one’s ability to meet other needs for which no benefit has yet been provided.
There are also reasons to question the rationale behind the specific adjustments for housing. While those with a mortgage are likely to have the highest housing expenses, they are also likely to have higher income than those who rent, as noted previously, which may make some wonder about the appropriateness of the higher poverty threshold for mortgage-holders.
HHS Guidelines
The HHS poverty guidelines, by not accounting for age of individuals, ignore the reality that people’s costs fluctuate throughout their lifetime, as discussed above.
Consumption
One difficulty with using consumption or expenses as the basis for assessing material hardship is that average expenditures may be depressed if people generally are not spending what they otherwise would if their income were higher. For example, health care expenditures may be less than what they would be if people had more money to spend on care.
General Criticisms of All Three Measures
Inflation
One criticism of each of the government’s poverty measures is its dependence on the CPI-U for annual inflation adjustments. Experts have noted that the CPI-U overstates the extent of price inflation.[21] Some, including American Action Forum President Doug Holtz-Eakin, have argued that using chained CPI provides a more accurate reflection of inflation because it accounts for product substitution, which is even more likely to be employed by lower-income individuals.
Equivalence Scales
After establishing a poverty threshold for a certain size family unit, equivalence scales are used to convert that threshold for families of other sizes. These scales must account for the fact that families share resources—not everyone needs their own kitchen or bathroom—and thus have diminishing marginal costs with each additional family member, so the threshold for a family of four is not simply four times that of an individual. But exactly what the conversion scale should be is debatable, and its weight will impact the growth of the thresholds between household sizes and those of various compositions.[22]
Further, because different poverty measures, as well as assistance programs, use different equivalence scales for setting thresholds or determining eligibility, there is an inconsistency in whether a family is considered impoverished and whether they are eligible for assistance from one program or another, as is well explained in this paper from the Brookings Institution.
Assets
Another potential shortcoming of each of these measures is the lack of consideration of a person’s assets. On the one hand, it may be hard to justify use of taxpayer dollars to provide assistance to people who theoretically have the resources to provide what they need. That said, many assets are not easily made liquid. Further, requiring people to sell assets or otherwise bring down their net worth can have other implications that policymakers may want to consider: Asset accumulation is key to building generational wealth and the ability to provide for future needs.
It should also be noted that while assets are not considered in poverty data, some assistance programs do require asset consideration in determining eligibility for benefits.
[1] https://www.census.gov/library/publications/2020/demo/p60-270.html
[2] https://www.census.gov/topics/income-poverty/poverty/guidance/surveys-programs.html
[3] https://www.census.gov/library/publications/2020/demo/p60-272.html
[4] https://www.census.gov/topics/income-poverty/supplemental-poverty-measure/library/working-papers/topics/potential-changes.html
[5] https://www.census.gov/topics/income-poverty/supplemental-poverty-measure/library/working-papers/topics/potential-changes.html
[6] https://www.census.gov/topics/income-poverty/supplemental-poverty-measure/library/working-papers/topics/potential-changes.html
[7] https://fredblog.stlouisfed.org/2018/07/why-does-cost-of-living-vary-so-much/
[8] https://www.ers.usda.gov/data-products/chart-gallery/gallery/chart-detail/?chartId=76967
[9] https://www.ers.usda.gov/data-products/chart-gallery/gallery/chart-detail/?chartId=76967
[10] https://www.ers.usda.gov/data-products/chart-gallery/gallery/chart-detail/?chartId=58372
[11] http://www.hamiltonproject.org/assets/files/where_does_all_the_money_go.pdf
[12] https://www.federalreserve.gov/econres/notes/feds-notes/assessing-the-severity-of-rent-burden-on-low-income-families-20171222.htm
[13] https://www.federalreserve.gov/econres/notes/feds-notes/assessing-the-severity-of-rent-burden-on-low-income-families-20171222.htm
[14] https://www.bls.gov/cex/tables/calendar-year/aggregate-group-share/cu-income-before-taxes-2019.pdf
[15] https://www.esri.com/about/newsroom/publications/wherenext/salary-versus-cost-of-living/
[16] https://www.bls.gov/cex/tables/calendar-year/mean-item-share-average-standard-error/reference-person-age-ranges-2019.pdf
[17] https://www.bls.gov/cex/2019/CrossTabs/sizbyage/aone.PDF
[18] https://www.bls.gov/cex/2019/CrossTabs/sizbyage/aone.PDF
[19] https://www.bls.gov/cex/2019/CrossTabs/sizbyage/aone.PDF
[20] https://www.bls.gov/cex/2019/CrossTabs/sizbyage/aone.PDF
[21] https://leo.nd.edu/assets/339909/2018_consumption_poverty_report_1_.pdf
[22] https://www.brookings.edu/blog/up-front/2019/04/17/whats-in-an-equivalence-scale-maybe-more-than-you-think/