Research
June 29, 2022
No Evidence of Link Between Market Concentration and Producer Price Inflation
Executive Summary
- As inflation closed in on a 40-year high, some lawmakers renewed claims of a direct relationship between increased market concentration and rising prices.
- This study finds no evidence for that assertion; moreover, prior American Action Forum research dispelled the claim that there is a trend toward increased market concentration.
- Analysis of industry-level producer price data from the U.S. Bureau of Labor Statistics and market concentration data from the U.S. Census Bureau’s Economic Census showed almost no correlation between the level or the percentage point change in the market concentration ratio and the percentage change in the Producer Price Index (PPI).
- The data also revealed that a greater number of industries classified as highly concentrated reported a smaller increase in their associated PPI compared to the increase in overall PPI between March 2021 and May 2022.
Introduction
Following a series of historically high inflation readings, Senator Elizabeth Warren (D-MA) in January argued during a Committee on Banking, Housing, and Urban Affairs hearing that market concentration was “playing a role” in elevated inflation.
In an exchange with then-Federal Reserve Board Chairman nominee Jerome Powell, the senator asked: “[I]n markets with greater concentration and not much competition, are corporations generally able to raise prices and increase profit margins, all else being equal?” Chair Powell responded: “[T]he connection between concentration and market power is not as clean as we might think it might be. In some of the industries that have concentrated, there actually has been … lower cost increases that resulted in lower costs to consumers … so it’s not as direct.”
In other words, Chair Powell testified that the link between market concentration and a firm’s ability to raise prices is murky, at best.
This study examines the correlation between the Producer Price Index (PPI) and industry concentration. Using various approaches to the analysis, the data show almost no correlation between the two variables.
Furthermore, the data indicate that a greater number of industries classified as highly concentrated report a smaller increase in their associated PPI compared to the increase in overall PPI between March 2021 and May 2022.
In short, this study’s findings are consistent with Chair Powell’s response: There is insufficient evidence to support the claim that market concentration is contributing to inflationary pressures.
Data Selection and Methodology
To assess Senator Warren’s claim that market concentration is contributing to elevated inflation, this study used industry concentration ratio data from the Economic Census and industry-level producer price data from the U.S. Bureau of Labor Statistics (BLS). Both variables are categorized using the North American Industry Classification System (NAICS), which facilitated an objective method when merging the data sets.
NAICS codes range in degrees of specificity from a 2-digit NAICS code (a general sector, e.g., 22 – Utilities) to a 6-digit code (a specific industry, e.g., 335312 – Motor and Generator Manufacturing). This study analyzes data at the 6-digit NAICS level.
According to BLS, the producer price index “measures the average change over time in prices received by producers for domestically produced goods, services, and construction. PPIs measure the price changes from the perspective of the seller.” If firms in highly concentrated markets can exercise pricing power, it would be evident by a jump in the PPI, since this is where producers receive actual payment for their goods and services.
Industry concentration ratios from the U.S. Census Bureau’s Economic Census are calculated as the share of sales among the four largest firms and denoted as CR4.
Correlation Between Market Concentration and Producer Prices
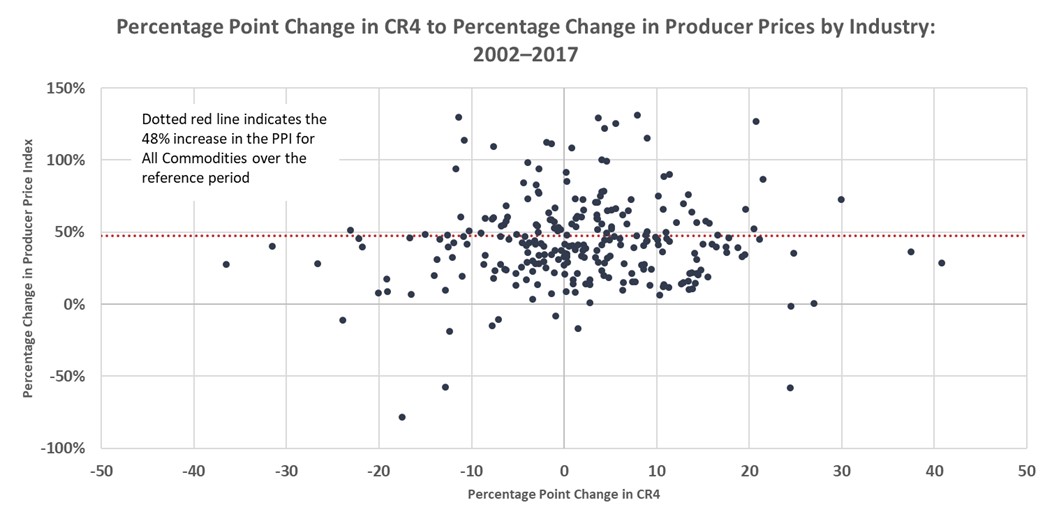
This study’s major finding is displayed in Figure 1. Each dot represents one of the 263 6-digit NAICS industries with relevant data, and the dotted red line indicates the percentage change in PPI for all commodities over the same period. The position of each dot corresponds to the percentage change in PPI and the percentage point change in the CR4 between 2002–2017. If the claim that increased market concentration (measured by the percentage point change in CR4) leads to higher prices (a positive percentage change in the PPI) were true, there would be a strong, positive correlation. The correlation measured 0.06, suggesting a very weak relationship between market concentration and producer prices.
Figure 1
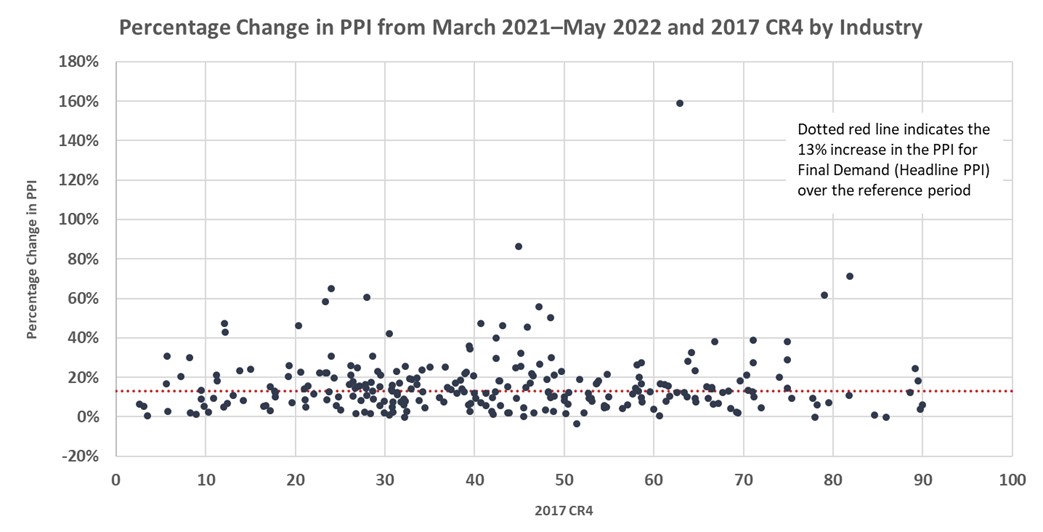
This study also examined the notion that the CR4 level, rather than the percentage point change, might be correlated with the percentage change in producer prices. Accordingly, this study used the 2017 CR4 level (most current observation from the Economic Census) and the percentage change in producer prices from March 2021 to May 2022. This time period is consistent with the historically high inflation Senator Warren referenced.
If the current rhetoric is accurate, there would be a positive correlation between the two variables. This means the percentage change in the PPI would be increasing, moving across the CR4 spectrum from 0 (perfectly competitive markets – firms are price takers) to 100 (monopoly – firm is a price maker). Figure 2 illustrates the 260 industries with related data and includes a dotted red line representing the percentage change in overall PPI over the same period. The correlation coefficient of 0.04 suggests a very weak relationship and gives little credence to the claim that highly concentrated industries were able to demand prices for goods and services that exceeded the general price increase.
Figure 2
Changes in Industry Level PPI Compared to Overall PPI
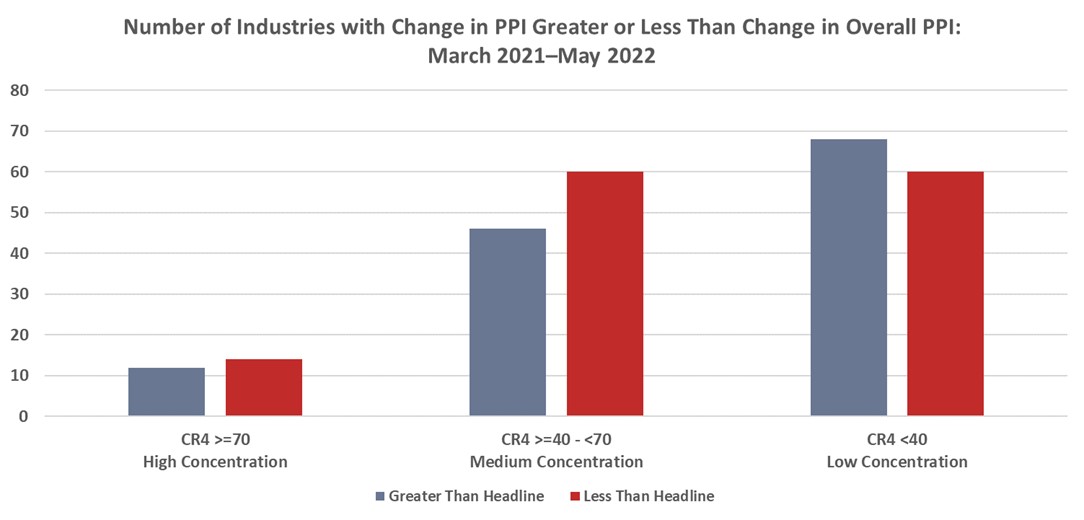
Using the same 260 industries as in Figure 3, this analysis shows that 134 industries (52 percent of the sample) experienced a rise in the PPI less than the 13 percent increase in the headline PPI between March 2021 and May 2022.
As seen in Figure 3, industries with low concentration had a greater number of industries with a change in the PPI that exceeded the pace of overall PPI. By contrast, industries with high and medium levels of concentration had a greater number of industries whose PPI increased less than overall PPI.
Figure 3
Distribution of the Percentage Change in PPI by Concentration Ratio Category
Figure 4 illustrates the distribution of the percentage change in PPI by concentration ratio category.
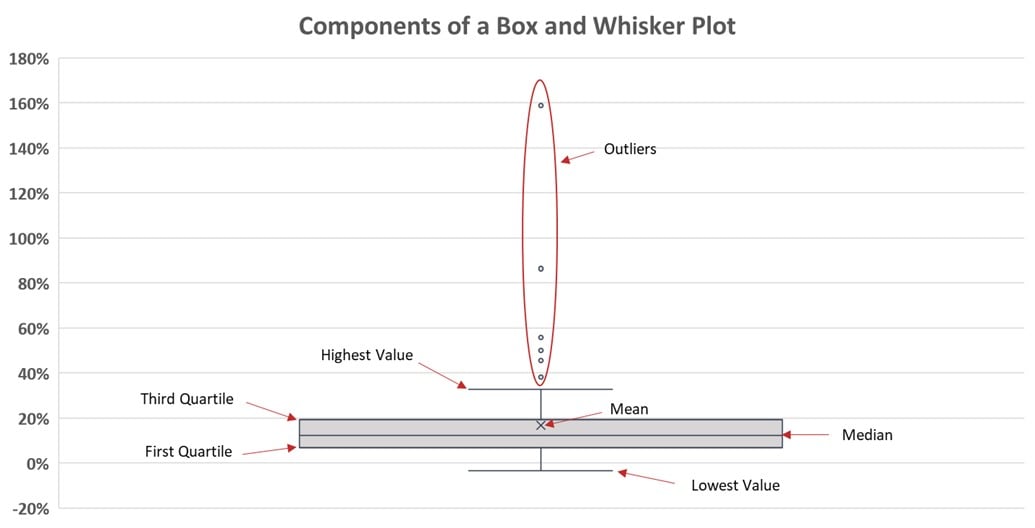
The line running through the middle of each box represents the median change in PPI for each concentration ratio category. Using the median rather than the mean is preferred in this case to account for the presence of outliers in the data set.
If the claim that market concentration is contributing to inflation is true, highly concentrated industries would be expected to have higher median values of the percentage change in PPI. The data, however, show that the median value across all three categories is similar. Industries with low concentration had the highest median change in PPI between March 2021 and May 2022 at 13.6 percent. The median change for the high and medium concentration level categories was 12.5 percent and 12.3 percent, respectively.
Figure 4
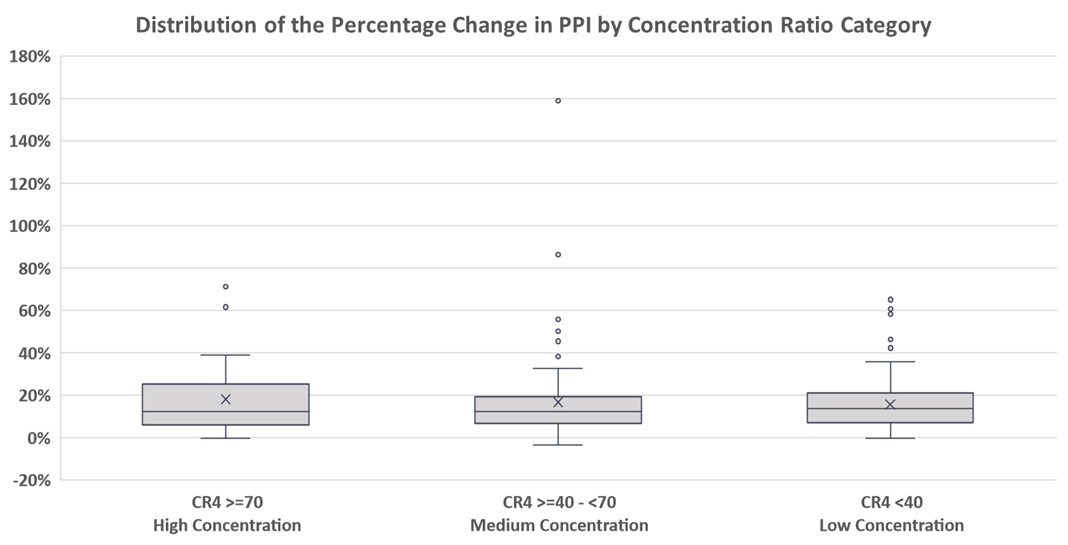
A full description of how to interpret a box and whisker plot can be found in the Appendix.
Conclusion
Chair Powell was correct in his contention that “the connection between concentration and market power is not as clean as we might think.”
This study found no evidence to support the assertion that increased market concentration is playing a role in inflation. Neither the percentage point change in concentration ratios, nor the level of industry-specific concentration ratios, show a meaningful, positive correlation with the change in the PPI.
The analysis also reveals that highly concentrated industries were more likely to experience a smaller increase in the industry-specific PPI relative to the change in the overall PPI and that industries with low concentration had the highest median change in PPI.
Appendix: Interpretation of a Box and Whisker Plot