Research
November 1, 2018
PRIMER: Examining Trends in Emergency Department Utilization and Costs
Executive Summary
- Emergency department (ED) use has been increasing steadily for decades, at a rate faster than U.S. population growth.
- One reason for rising ED use is aging demographics: The elderly are more likely to have complex health conditions and need urgent care. Other reasons include a lack of timely access to care in a doctor’s office or other non-ED urgent care setting and technological improvements that have changed and expanded the role EDs play in our health care system.
- Policymakers and insurers are understandably concerned about increased ED use, as it has relatively high treatment costs compared with other care settings. While no other provider will ever fully replace EDs’ role in our health care system, improving access to primary care could reduce ED utilization, as well as provide other benefits such as greater preventive care and disease management.
- Overcrowding in the ED is also a concern. This challenge stems not primarily from increased ED utilization but from hospital-wide inefficiencies and overcrowding in the inpatient wards that cause new patients awaiting admission to be “boarded” in the ED until space becomes available. Improving access to primary care providers will not resolve the overcrowding issue.
Introduction
Health care in the United States is expensive, and part of the debate over how to control the cost of treatment has focused on overuse of high-cost settings, such as hospital emergency departments (EDs). Treating a patient in an ED costs much more than treating one in a primary care setting, so overuse of EDs for non-urgent needs drives up overall spending, the thinking goes. Insurers have taken note of this structure, and some have even taken the step recently of refusing to cover beneficiaries’ unnecessary ED visits.
Amid these changes, it is worth stepping back and seeing what the data say about ED utilization. How many people are using EDs? Who specifically is going, and why? And what is the relationship to overall health care spending? Answers to these questions and others indicate that while more people are going to EDs, the reason and the relationship to overall health care spending is less clear.
Trends in Patient Volume
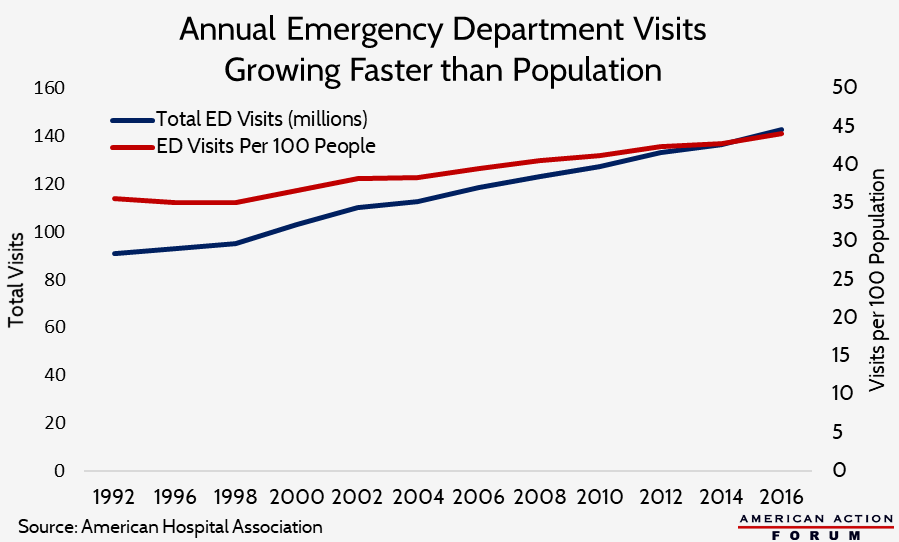
Patient volume in EDs has been growing faster than the population for decades. In 1997, annual visits to the ED totaled 94.9 million (35.6 per 100 people).[1] By 2006, that total had increased 26 percent overall to 119.2 million, or 14 percent when adjusting for population growth (40.5 per 100 people).[2] In 2015, ED visits had reached 136.9 million, or 43.3 per 100 people—a 7 percent increase from 2006 on a per capita basis.[3]
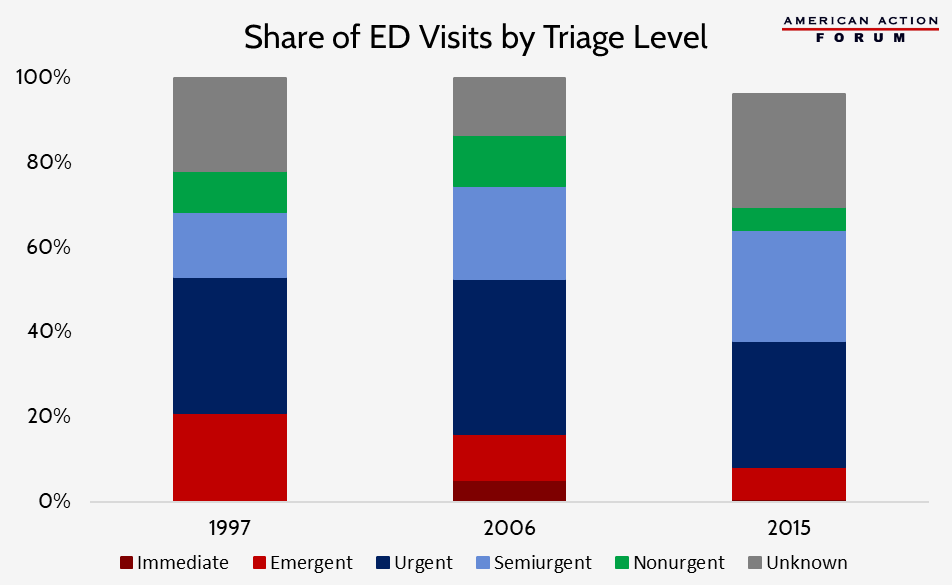
The types of visits accounting for this growth, however, are difficult to determine. The share of visits triaged as at least “semiurgent”—that is, determined to need attention within two hours—grew between 1997 and 2006, but appears to have been shrinking over the past decade, as shown in the chart below.[4] A significant number of visits, however, have an “unknown” triage level, particularly in 2015, which makes it difficult to evaluate the real trend. The share of visits considered at least semiurgent increased from 68 percent in 1997 to 75 percent in 2006, though the share of ED visits that resulted in a hospital admission declined slightly from 13.5 percent in 1997 to 12.8 percent.[5],[6] In 2015, the share of visits (with a known triage level) considered at least semiurgent had dropped to 64 percent and only 9 percent of all ED visits resulted in a hospital admission.[7]
Other data show that the severity of cases seen in the ED appears to be changing, particularly as non-ED acute care centers become more readily available and accessible. Between 2008 and 2015, one study found that the number of low-acuity visits to EDs decreased by 36 percent, despite an overall increase in the number of low-acuity visits across all acute care venues of 31 percent: Visits to non-ED care venues, such as urgent care centers and retail clinics, increased 140 percent during this time period.[8] This jump indicates that people are making better use of non-ED sites of care when they are able. On the other hand, high-intensity visits have become more common in EDs. One study of elderly Medicare beneficiaries showed high-intensity visits increased from 46 percent of all visits in 2006 to nearly 58 percent of visits in 2012.[9] This study found that this increase was “moderately explained” by patient characteristics (particularly, the presence of comorbidities) and an increase in services provided, indicating that patients were presenting with a greater number of chronic conditions. While this study does not account fully for the increase and leaves room for a role of upcoding in boosting the numbers, in general this trend is likely to continue as our elderly population continues to grow over the next few decades.
Other possible reasons for the increased rates of ED utilization, discussed in more detail below, include: the increased frequency with which primary care doctors refer patients to the ED, and the continued difficulty patients face in accessing their primary care providers through an unscheduled appointment or after regular office hours.
A very small share of patients use the ED quite often. Patients with frequent ED use tend to use other health services at a higher-than-average rate, have a typical source of primary care, and are more likely to be covered by Medicare or Medicaid.[10] These individuals are also more likely to have low incomes and poor physical and mental health.[11] Patients who visited the ED at least four times in a single year accounted for only 8 percent of all ED users but 28 percent of all ED volume.[12]
Patient Demographics
Age
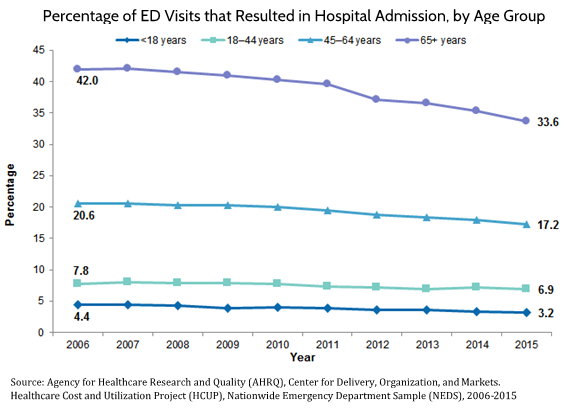
Not surprisingly, the most common patients in an ED by age on a per capita basis were infants less than a year old, visiting the ED at a rate of 84.5 per 100 infants in 2006[13] and 102.2 per 100 in 2015.[14] For one, parents are much more likely to take extreme caution with children of that age, particularly given children’s inability to articulate clearly and accurately their pain and other symptoms. Additionally, not all urgent care facilities have equipment suitable for examining infants (particularly because of their size), so the ED may be the only place available that can properly screen and treat them. The second most common patients in an ED are people 75 years and older, at a rate of 60.2 per 100 people in that age group in 2006 and roughly unchanged in 2015.[15] People living in nursing homes, on average, visited the ED more than once a year; in 2015, the rate per 100 nursing home residents was 150.6.[16] Obviously, health care needs tend to increase as people age. Between 2006 and 2015, ED visits among 45 to 64 year-olds increased 20 percent, the greatest rate of increase among all age groups, according to data from the Agency for Healthcare Research and Quality (AHRQ).[17]
AHRQ also found that the percentage of visits to the ED that result in hospital admission—one potential indication of an ED visit’s appropriateness—has declined among all age groups recently, as shown in the chart below.[18]
Insurance Coverage
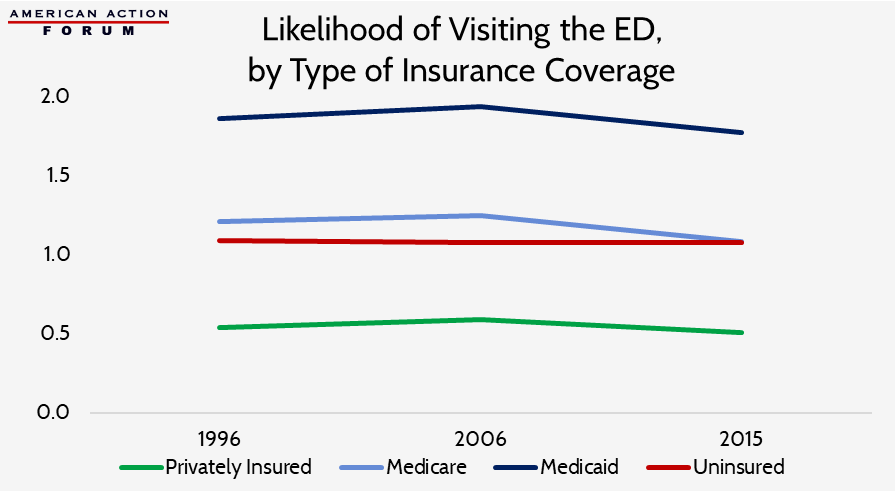
The type of insurance held by people who are going to EDs has been shifting. In 1997, well over three-fourths of individuals visiting the ED had some form of insurance: 38 percent were privately insured, 18 percent were on Medicaid, and 16 percent were on Medicare, while 16 percent had no insurance.[19] In 2006, the share of individuals on Medicaid had increased significantly: 40 percent of people visiting the ED were privately insured, 25 percent had Medicaid or CHIP, and 17 percent had Medicare, while 17 percent had no insurance.[20] In 2015, the trend of an increasing proportion of Medicaid patients using the ED continued: The share of privately insured ED visitors had declined to 34.3 percent while the share of ED visitors on Medicaid had significantly increased, reaching 34.8 percent and surpassing the share of those privately insured. This increase was likely because of the Affordable Care Act’s (ACA) expansion of Medicaid. In contrast, the share of ED visits by Medicare beneficiaries remained roughly the same at 17.7 percent.[21] Presumably because of the ACA’s insurance expansion, the share of uninsured individuals visiting the ED dropped to just under 10 percent. Relative to individuals insured by other means, Medicaid beneficiaries have been much more likely to use the ED and have become increasingly more likely over time, as shown in the chart below. The privately insured, on the other hand, are much less likely to use the ED, though from 1997 to 2006, the privately insured did become somewhat more likely to use the ED and accounted for the majority of the growth in total ED visits. The share of ED visits by uninsured individuals roughly matches the share of individuals who are uninsured.
The difference in ED use between Medicaid beneficiaries and the uninsured is likely primarily due to the poorer health of Medicaid beneficiaries stemming from the greater prevalence of chronic disease.[22] Medicaid beneficiaries also have a hard time accessing a primary care provider within a reasonable time and are unworried about the financial cost of an ED visit because it will be covered almost entirely by Medicaid, facts that likely also drive up ED visits for Medicaid beneficiaries. In contrast, uninsured individuals can face the full burden of the cost and thus likely use the ED only when they find it absolutely necessary.
Race
In 2006, Black individuals visited the ED at more than twice the rate of White or Hispanic people, a slight increase in the rates seen 10 years earlier, though a smaller share of their visits were considered to be urgent.[23] In 2015, the difference in ED visit rates between Whites and Blacks narrowed slightly with Whites visiting the ED at a slightly higher rate and Blacks visiting at slightly lower rates.[24]
There are several factors that might explain this difference, particularly various social determinants of health, including differences in insurance coverage: Between 2015-2017, only 56 percent of Black individuals and 53 percent of Hispanic individuals had private insurance coverage and 11 percent and 16 percent were uninsured, respectively, compared with the White population where roughly 74 percent had private insurance and less than 7 percent were uninsured.[25] This difference is largely a result of differences in employment, which affects access to employer-sponsored insurance (ESI). In 2016, 64 percent of White individuals had ESI, while only 46 percent of Black individuals and 41 percent of Hispanic individuals had ESI.[26] An individual’s health insurance coverage is likely to affect their access to primary care, as explained below. According to AHRQ, Black and Hispanic individuals have historically been less likely to have a regular source of primary care compared to Whites.[27] Another study found that the total time burden for receiving ambulatory medical care was up to 28 percent greater for racial and ethnic minorities and unemployed individuals.[28]
Reasons for Using the ED Rather than Other Care Settings
ED use is a reflection of the health needs in a community and the accessibility of other sources of care there. An individual’s decision to seek care in the ED is primarily a factor of how quickly the person believes they need to be treated. This decision depends on the severity of the patient’s symptoms along with their ability to obtain a timely appointment in a setting other than the ED that is convenient for them. Studies continuously find that the ED is almost never patients’ first choice of location to receive non-urgent care, but they go there because of a lack of other options (perceived or otherwise).
Patient Symptoms
Injuries are typically the most common reason for a visit to the ED, accounting for 37 percent of ED visits in 1997[29] and 36 percent of visits in 2006.[30] In 2015, the share of injury-related visits dropped to 30 percent, roughly 1 million fewer than in 2006.[31] The share of unintentional injury-related visits to EDs, however, rose roughly 9 percentage points, and the share of visits related to adverse effects of medical treatment and medical and surgical complications increased 1 percentage point.[32] In each year, the most common cause for injuries treated in the ED was falls, followed by motor vehicle accidents. Beyond injuries, symptoms related to the respiratory, digestive, and musculoskeletal systems were the next most common causes for ED visits.[33] Specifically, the three most common complaints in 1997 were stomach/abdominal pain, chest pain, and fever, and continued to be so in 2006 and 2015.[34] These types of symptoms, while often not serious, could be indicative of a true emergency, such as a heart attack, ruptured appendix or other organ, or serious illness. Patients also often believe their condition is more urgent than it truly is and err on the side of caution, likely a reason for so many visits that are ultimately determined to be non-urgent. It is not just patients, however, who sometimes inappropriately judge their condition; one study found that 5.5 percent of patients initially determined by hospital clinicians to present non-urgent conditions were later admitted as inpatients.[35] Another study found potentially preventable ED visits increased at a faster rate than ED visits overall from 2008 to 2012, and mental health-related visits increased the most relative to all other nonmaternal treat-and-release ED visits.[36]
In 1997, 29 percent of all hospital admissions resulted from an ED visit; in 2006, that percentage had increased to 41 percent.[37] In 2010, that figure continued to rise, and ED visits accounted for nearly half of all hospital admissions (47 percent), but that trend then began to reverse, and in 2015 ED visits accounted for 35 percent of all hospital admissions.[38] This recent trend reversal may be because ED physicians have increased the intensity of services provided to patients in EDs which may be allowing more people to be discharged rather than needing to be admitted, as discussed below.
Of people admitted to the hospital following their arrival in the ED in 2006, roughly an equal share of patients were covered by private insurance as were covered by Medicare (43 percent and 42 percent, respectively), and 20 percent were covered by Medicaid or the Children’s Health Insurance Program (CHIP). In 2015, 48 percent were Medicare beneficiaries, 38 percent were privately insured, and 28 percent were Medicaid/CHIP beneficiaries.[39] These changes are likely more indicative of overall changes in sources of insurance coverage following passage of the ACA and its expansion of Medicaid eligibility, rather than changes in the health or behaviors of people covered by each type of insurance.
Improved Technology
The role of EDs has been changing as new technology is developed. Because EDs have to be prepared for any and all emergencies, they typically have the most up-to-date medical technology. Improved diagnostic capabilities allow providers to diagnose patients much more quickly, and these technologies—whether imaging devices or laboratory tests—are most likely to be immediately available at an ED. Because of these advantages, providers are more likely to refer patients to the ED and patients are more likely themselves to go to an ED if a quick diagnosis is needed.[40]
The data show there has been an increase in treatment intensity in the ED, and this may be reducing the number of people who are ultimately admitted to the hospital. According to one study, high-intensity visits grew from 46 percent in 2006 to 58 percent in 2012; the number of services provided increased for both admitted and discharged patients. Simultaneously, there was a reduction in the hospital admission rate from 40 percent to 36 percent.[41] Another study found similar results: The rate of ED visits that resulted in a discharge increased while the rate of potentially preventable inpatient stays for the same conditions decreased.[42] The increased intensity can have differing effects. While costs related to care in the ED may be increasing as a result, overall spending may decline if expensive inpatient stays are avoided. Other studies conclude that despite no net change found in the proportion of lower-acuity visits and a reduction in the amount of time lower-acuity patients spend in the ED, the growing intensity of interventions for higher-acuity patients—including blood tests, advanced imaging, intravenous fluids, and medication administration—may be the primary reason for increasing occupancy in the ED.[43] Further, the authors of that study concede that it is difficult to know the cost-effectiveness of this new norm.
Lack of Access to Primary Care
Many barriers to accessing timely outpatient care have been associated with increased ED utilization.[44] To the extent that an individual believes their symptoms or injury requires immediate attention, the fact that settings other than EDs will typically not see them quickly without an appointment often makes them untenable options.
Several studies have shown utilization does increase when physician offices are typically closed. One study found that 75 percent of ED visits among children in 2012 were at night or on a weekend, and that, regardless of insurance status, this lack of access elsewhere was the most common reason given for visiting an ED for non-urgent conditions (i.e. conditions that can wait to be treated for up to 24 hours).[45]
A study from 2013 found no significant increase in utilization after normal working hours or on weekends; use occurred even when other health clinics were open.[46] The mere fact that other options were open, however, does not necessarily mean that they were therefore available; a doctor’s office may be open but not accepting walk-in appointments. One study found that 22 percent of non-urgent ED patients had tried but failed to access primary care first.[47] Nearly half of patients who described the ED as their usual source of care had tried to obtain an appointment with a primary care physician.[48] Their failure was likely due, at least partially, to the fact that over one-fourth of primary physicians were found not to be accepting new Medicaid patients, and more than one-fifth would not accept new patients who lacked insurance.[49] This lack of access likely also explains the greater ED use among Medicaid patients relative to those privately insured. Only 5 percent of primary care physicians surveyed were not accepting new patients with private insurance. A Medicaid and CHIP Payment and Access Commission (MACPAC) report from July 2014 found that access to primary care was a primary factor in whether a Medicaid beneficiary would use the ED and found little evidence of inappropriate use of the ED.[50]
The Congressional Research Service found that ED use is lower in areas with federal health centers,[51] and ED use has been found to be greater in areas that have limited ambulatory care capacity and a greater supply of ED capacity.[52] The Health Resources and Services Administration currently designates more than 6,700 areas across the United States as having a shortage of primary care providers and more than 4,200 areas as being medically underserved.[53] Though, the increase in the number of alternative care options—such as retail clinics now commonly found at CVS, Wal-Mart, Target, and other retailers, as well as expanded telehealth services—may be mitigating this problem somewhat, as discussed earlier.
Others utilize the ED rather than a physician’s office or health clinic because of a perception that care provided in the hospital is going to be of greater quality or because it is seen as the only or easiest option for accessing a specialist.[54]
Effect of Increased Utilization: Overcrowding
Despite the ACA’s coverage expansion, overcrowding of EDs continues to be an issue. Numerous studies find overcrowding in the ED to be a symptom of overcrowding elsewhere in the hospital, rather than a result of an influx of patients in the ED. This overcrowding is typically caused by hospital inefficiencies and a scarcity of inpatient beds or key clinical staff which forces patients to be kept inappropriately in the ED while they wait to be admitted (a practice known as “boarding”).[55]
The primary downside to increased ED utilization and overcrowding is the difficulty it creates in tending to patients with a true emergency in a timely fashion. Hospitals have limited resources, and the more patients seeking care in the ED, the longer it will take to be seen. A study published in 2010 found that despite only 4 percent of physicians in the United States working in the ED, these physicians were responsible for 28 percent of all acute care visits.[56] Nonetheless, ED physicians work hard to ensure that patients with nonurgent conditions are treated and released quickly. A study in 2007 found that patients with needs determined to be of “low-complexity” had a negligible increase in the length of stay for patients in the ED and in the amount of time before other patients’ first contact with a physician.[57] Some hospitals have implemented protocols to enable such patients to be treated and discharged quickly, sometimes by dedicating a certain area and a team of providers specifically to deal with these low-complexity cases.
Overcrowding can lead hospitals to impose ambulance diversion policies which can have negative effects on patients, including both those who are diverted to a hospital further away and those who then have to wait longer for an ambulance to reach them since it has just traveled farther away.[58] Such diversion practices may be causing increased disparities in health outcomes between White and Black individuals.[59]
Further, adverse events are more likely to occur when hospitals are at capacity, which is highly correlated with ED overcrowding and “boarding.”[60] Boarding was found to increase patients’ morbidity, the length of their hospital stay, and their mortality.[61] Overcrowding also limits the capacity to respond to a major disaster. If hospital inefficiencies persist and “boarding” remains prevalent, continued increased use of the ED will certainly make overcrowding worse.
Costs and Expenditures
Because health care costs vary so widely across regions and within regions, studies attempting to compare costs between EDs and other sites of care produce varying results regarding the magnitude of the difference, but they all consistently find that care provided in an emergency room is more expensive than care provided elsewhere. According to AHRQ, the average cost of a primary care visit was $199 in 2008 while the average cost of a doctor visit in the ED was $922.[62] Another study found the median charge for 10 different outpatient conditions treated in the ED between 2006-2008 was $1,233.[63] According to one insurer’s charges in 2012, costs in urgent care ranged from 17 to 28 percent of the cost for treating the same condition in the ED.[64] In Texas, costs in the ED were found to be 10 times greater than costs at urgent care centers from 2012-2015.[65]
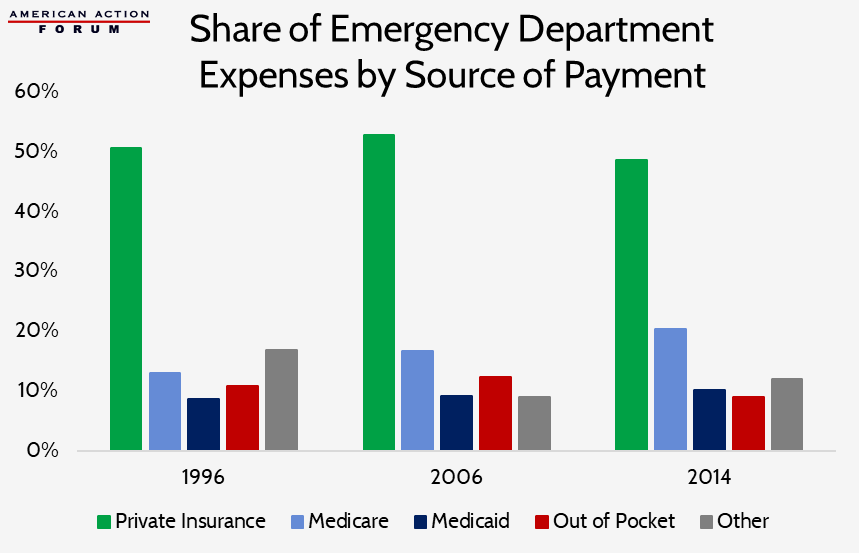
Part of the higher cost is due to the greater regulatory burden, which costs hospitals $39 billion annually, according to an American Hospital Association estimate.[66] Another reason hospitals charge so much for care in their EDs is so they can cross-subsidize uncompensated care (estimated to reach a peak of more than $46 billion in 2013 and then to fall to $39 billion in 2016).[67] This cross-subsidization is typically financed by private payers: Private insurers have consistently paid roughly half of all ED expenditures (as shown in the chart below), despite typically only covering 35 to 40 percent of ED patient visits.[68] The high rate of uncompensated care is somewhat caused by the provisions of the Emergency Medical Treatment and Active Labor Act, which requires any patient be stabilized before being discharged from a hospital, regardless of the patient’s ability to pay.[69] A third reason for the higher costs in the ED is the greater overhead costs associated with the amount of technology that is kept on-hand in an ED so that the staff is prepared to respond to any type of emergency that may arise. As emergencies can occur at any time of day or night, EDs must be open 24 hours and specialists of all kinds must be on-call 24 hours a day, every day, which is certainly costly, as they must be paid for their time on-call whether they treat anyone or not. Finally, some of the greater cost may also result from the fact that most people treated in an ED are seen by both an attending physician and a registered nurse (RN). In 1997, 87 percent of people in the ED were seen by an RN, and 86 percent were seen by a staff physician.[70] By 2015, those percentages had increased slightly: 94 percent were seen by an RN or licensed nurse practitioner and 88 percent of people saw a physician, including 85 percent who saw an attending physician.[71]
Even though hospitals charge so much and total ED visits have been growing, total ED expenditures have accounted for on average just 2 percent of total national health expenditures for years, ranging from 1.6 percent in 1997 to 2.2 percent in 2014.[72] Expenditures for ED services have increased dramatically in dollar figures, however, from $16.9 billion in 1997 to $65.4 billion in 2014, just as total health expenditures have increased. As noted earlier, some of this increase in ED expenditures may be the result of the noted increase in the intensity of services provided in the ED. But what is not yet known and worth considering is the large potential savings that may be occurring as a result in the form of costs avoided by preventing hospital admissions.
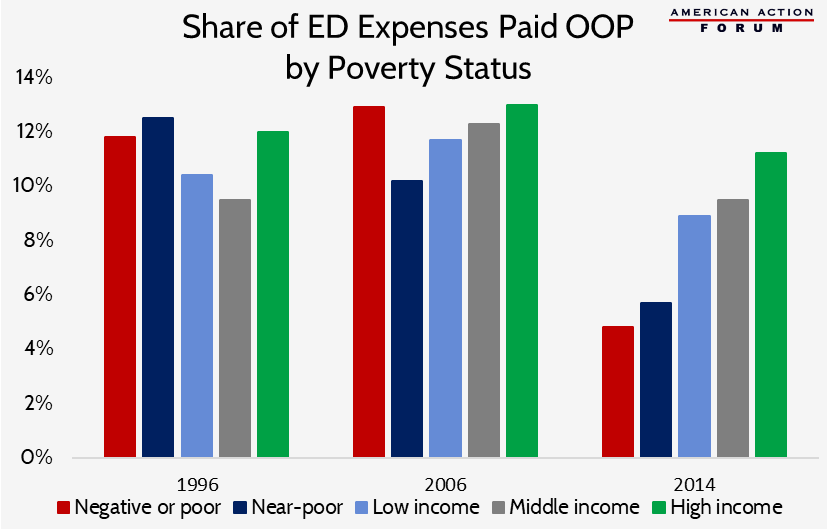
The following chart shows the share of ED expenses paid out-of-pocket (OOP) by individual’s poverty status.[73] While all income groups have recently experienced a reduction in the share of expenses paid OOP, there is a rather significant decline in the share of expenses paid by people near or below the poverty line following passage of the ACA.
Conclusion
Use of EDs has been increasing steadily for decades, at a rate faster than our population growth, as their role in our health care system has expanded. The increased utilization is the result of many factors, including: the changing demographics of our population (particularly the growing number of elderly people who typically have greater health care needs), a lack of timely access to care in other settings, more frequent referrals to the ED by primary care physicians, and the availability of improved technology that makes the ED a preferred option for patients looking for a quick diagnosis. Individuals covered by Medicaid are most likely to use the ED.
Because care provided in the ED is typically much more expensive than if it were provided in a primary care facility—such as a doctor’s office, an urgent care center, or retail clinic—insurers and policymakers concerned with growing health care costs are looking for ways to reverse this trend. Increased ED use and overcrowding also strain hospitals’ limited resources and make it more difficult to ensure patients with true emergencies can be treated in a timely manner—though the real culprit of ED overcrowding is hospital-wide inefficiencies that result in patients “boarding” in the ED while they wait to be admitted to an inpatient ward, rather than excessive use for non-urgent care. When EDs become overcrowded, patients experience worse health outcomes.
ED utilization could be decreased by improving access to primary care, allowing for greater preventive care and disease management, and greater availability of same-day appointments to respond to injuries or a sudden onset of alarming symptoms or illness. Real improvements will likely not be seen, though, unless there are significant improvements in hospital efficiency and management such that patients are no longer “boarded” in the ED, taking up valuable bed space.
[1] https://www.cdc.gov/nchs/data/ad/ad304.pdf
[2] Pitts, Stephen & Niska, Richard & Xu, Jianmin & W Burt, Catharine. (2008). National Hospital Ambulatory Medical Care Survey: 2006 Emergency Department Summary. National health statistics reports. 2.
[3] https://www.cdc.gov/nchs/data/nhamcs/web_tables/2015_ed_web_tables.pdf (Table 1)
[4] A visit categorized as “emergent” indicates the patient should be seen within 1-14 minutes; urgent: 15 mins-1 hour; semiurgent: 1-2 hours; and nonurgent: within 24 hours.
[5] Pitts, Stephen & Niska, Richard & Xu, Jianmin & W Burt, Catharine. (2008). National Hospital Ambulatory Medical Care Survey: 2006 Emergency Department Summary. National health statistics reports. 17.
[6] https://www.cdc.gov/nchs/data/ad/ad304.pdf (Table 3, Table 18)
[7] https://www.cdc.gov/nchs/data/nhamcs/web_tables/2015_ed_web_tables.pdf (Table 7, Table 25)
[8] Poon SJ, Schuur JD, Mehrotra A. Trends in Visits to Acute Care Venues for Treatment of Low-Acuity Conditions in the United States From 2008 to 2015. JAMA Intern Med. 2018;178(10):1342–1349. doi:10.1001/jamainternmed.2018.3205
[9] Burke LG, Wild RC, Orav EJ, et al Are trends in billing for high-intensity emergency care explained by changes in services provided in the emergency department? An observational study among US Medicare beneficiaries BMJ Open 2018;8:e019357. doi: 10.1136/bmjopen-2017-019357
[10] https://www.ncbi.nlm.nih.gov/pubmed/14734955
[11] https://www.ncbi.nlm.nih.gov/pubmed/16781914
[12] https://www.ncbi.nlm.nih.gov/pubmed/16781914
[13] Pitts, Stephen & Niska, Richard & Xu, Jianmin & W Burt, Catharine. (2008). National Hospital Ambulatory Medical Care Survey: 2006 Emergency Department Summary. National health statistics reports. 2.
[14] https://www.cdc.gov/nchs/data/nhamcs/web_tables/2015_ed_web_tables.pdf (Table 2)
[15] Pitts, Stephen & Niska, Richard & Xu, Jianmin & W Burt, Catharine. (2008). National Hospital Ambulatory Medical Care Survey: 2006 Emergency Department Summary. National health statistics reports. 2.
[16] Pitts, Stephen & Niska, Richard & Xu, Jianmin & W Burt, Catharine. (2008). National Hospital Ambulatory Medical Care Survey: 2006 Emergency Department Summary. National health statistics reports. 2, https://www.cdc.gov/nchs/data/nhamcs/web_tables/2015_ed_web_tables.pdf (Table 2)
[17] https://www.hcup-us.ahrq.gov/reports/statbriefs/sb238-Emergency-Department-Age-Payer-2006-2015.jsp?
[18] https://www.hcup-us.ahrq.gov/reports/statbriefs/sb238-Emergency-Department-Age-Payer-2006-2015.jsp?
[19] https://www.cdc.gov/nchs/data/ad/ad304.pdf (Table 2)
[20] Pitts, Stephen & Niska, Richard & Xu, Jianmin & W Burt, Catharine. (2008). National Hospital Ambulatory Medical Care Survey: 2006 Emergency Department Summary. National health statistics reports. 15.
[21] https://www.cdc.gov/nchs/data/nhamcs/web_tables/2015_ed_web_tables.pdf (Table 6)
[22] https://www.healthaffairs.org/doi/pdf/10.1377/hlthaff.25.w324
[23] https://www.ncbi.nlm.nih.gov/pubmed/18958996, https://www.semanticscholar.org/paper/National-Hospital-Ambulatory-Medical-Care-Survey%3A-McCaig-Stussman/2515606778df546c97a8f44fd075ce4cf040c150/figure/1, https://www.semanticscholar.org/paper/National-Hospital-Ambulatory-Medical-Care-Survey%3A-McCaig-Stussman/2515606778df546c97a8f44fd075ce4cf040c150/figure/13
[24] https://www.cdc.gov/nchs/data/nhamcs/web_tables/2015_ed_web_tables.pdf (Table 3)
[25] https://www.census.gov/content/dam/Census/library/publications/2018/demo/p60-264.pdf
[26] https://www.kff.org/other/state-indicator/rate-by-raceethnicity-2/?currentTimeframe=0&sortModel=%7B%22colId%22:%22Location%22,%22sort%22:%22asc%22%7D
[27] https://archive.ahrq.gov/research/findings/nhqrdr/nhdr11/chap9.html
[28] https://jamanetwork.com/journals/jamainternalmedicine/fullarticle/2451279
[29] https://www.semanticscholar.org/paper/National-Hospital-Ambulatory-Medical-Care-Survey%3A-McCaig-Stussman/2515606778df546c97a8f44fd075ce4cf040c150/figure/15
[30] Pitts, Stephen & Niska, Richard & Xu, Jianmin & W Burt, Catharine. (2008). National Hospital Ambulatory Medical Care Survey: 2006 Emergency Department Summary. National health statistics reports. 24.
[31] https://www.cdc.gov/nchs/data/nhamcs/web_tables/2015_ed_web_tables.pdf
[32] https://www.cdc.gov/nchs/data/nhamcs/web_tables/2015_ed_web_tables.pdf (Table 11)
[33] https://www.semanticscholar.org/paper/National-Hospital-Ambulatory-Medical-Care-Survey%3A-McCaig-Stussman/2515606778df546c97a8f44fd075ce4cf040c150/figure/15
[34] https://www.semanticscholar.org/paper/National-Hospital-Ambulatory-Medical-Care-Survey%3A-McCaig-Stussman/2515606778df546c97a8f44fd075ce4cf040c150/figure/17, Pitts, Stephen & Niska, Richard & Xu, Jianmin & W Burt, Catharine. (2008). National Hospital Ambulatory Medical Care Survey: 2006 Emergency Department Summary. National health statistics reports. 22.
[35] https://www.ncbi.nlm.nih.gov/pubmed/8691553
[36] https://www.hcup-us.ahrq.gov/reports/statbriefs/sb195-Potentially-Preventable-Hospitalizations.pdf
[37] https://www.statista.com/statistics/459718/total-hospital-admission-number-in-the-us/
[38] https://www.aha.org/statistics/fast-facts-us-hospitals-2017
[39] https://www.cdc.gov/nchs/data/nhamcs/web_tables/2015_ed_web_tables.pdf (Table 26)
[40] https://www.nejm.org/doi/full/10.1056/NEJMp1204431
[41] Burke LG, Wild RC, Orav EJ, et al Are trends in billing for high-intensity emergency care explained by changes in services provided in the emergency department? An observational study among US Medicare beneficiaries BMJ Open 2018;8:e019357. doi: 10.1136/bmjopen-2017-019357
[42] https://www.hcup-us.ahrq.gov/reports/statbriefs/sb195-Potentially-Preventable-Hospitalizations.pdf
[43] Kocher, Keith E. et al, “Emergency Department Crowding 2.0: Coping With a Dysfunctional System.” Annals of Emergency Medicine, Volume 60 , Issue 6 , 687 – 691
[44] https://www.ncbi.nlm.nih.gov/pubmed/22418570
[45] Renee M. Gindi and Lindsey I. Jones, Reasons for Emergency Room Use Among U.S. Children: National Health Interview Survey, 2012, U.S. Department of Health and Human Services, Centers for Disease Control and Prevention, National Center for Health Statistics, NCHS Data Brief: No. 160, Hyattsville, MD, July 2014.
[46] https://www.ncbi.nlm.nih.gov/pmc/articles/PMC3876304/
[47] https://www.ncbi.nlm.nih.gov/pubmed/15576521
[48] https://www.ncbi.nlm.nih.gov/pubmed/9287889
[49] https://www.ncbi.nlm.nih.gov/pmc/articles/PMC3876304/#b20-wjem-14-609
[50] https://www.macpac.gov/wp-content/uploads/2015/01/MACFacts-EDuse_2014-07.pdf
[51] CRS Report R42433, Federal Health Centers.
[52] https://www.healthaffairs.org/doi/pdf/10.1377/hlthaff.25.w324
[53] https://datawarehouse.hrsa.gov/topics/shortageareas.aspx
[54] https://hsrc.himmelfarb.gwu.edu/sphhs_policy_facpubs/491/
[55] https://www.ncbi.nlm.nih.gov/pmc/articles/PMC4909875/
[56] Stephen R. Pitts et al., “Where Americans Get Acute Care: Increasingly, It’s Not at Their Doctor’s Office.” Health Affairs, vol. 29, no. 9 (September 2010), pp. 1620-1629.
[57] https://www.sciencedirect.com/science/article/pii/S0196064406008845
[58] https://www.healthaffairs.org/do/10.1377/hpb20160602.353150/full/
[59] https://www.healthaffairs.org/doi/10.1377/hlthaff.2016.0925
[60] https://www.ncbi.nlm.nih.gov/pubmed/17446831
[61] https://www.healthaffairs.org/doi/10.1377/hlthaff.2011.0786
[62] https://archive.ahrq.gov/news/newsroom/news-and-numbers/042011.html
[63] https://www.ncbi.nlm.nih.gov/pmc/articles/PMC3584078/
[64] https://www.debt.org/medical/emergency-room-urgent-care-costs/
[65] “Comparing Utilization and Costs of Care in Freestanding Emergency Departments, Hospital Emergency Departments, and Urgent Care Centers.” Ho, Vivian et al. Annals of Emergency Medicine , Volume 70 , Issue 6 , 846 – 857.e3
[66] https://www.aha.org/guidesreports/2017-11-03-regulatory-overload-report
[67] https://www.aha.org/system/files/2018-01/2017-uncompensated-care-factsheet.pdf
[68] Agency for Healthcare Research and Quality. Emergency Room Services-Mean and Median Expenses per Person With Expense and Distribution of Expenses by Source of Payment: United States. Medical Expenditure Panel Survey Household Component Data. Generated interactively.
[69] https://fas.org/sgp/crs/misc/R43812.pdf
[70] https://www.semanticscholar.org/paper/National-Hospital-Ambulatory-Medical-Care-Survey%3A-McCaig-Stussman/2515606778df546c97a8f44fd075ce4cf040c150/figure/9
[71] https://www.cdc.gov/nchs/data/nhamcs/web_tables/2015_ed_web_tables.pdf (Table 24)
[72] Agency for Healthcare Research and Quality. Emergency Room Services-Mean and Median Expenses per Person With Expense and Distribution of Expenses by Source of Payment: United States, 2014. Medical Expenditure Panel Survey Household Component Data. Generated interactively. (July 23, 2018), and https://www.cms.gov/Research-Statistics-Data-and-Systems/Statistics-Trends-and-Reports/NationalHealthExpendData/NationalHealthAccountsHistorical.html
[73] Agency for Healthcare Research and Quality. Emergency Room Services-Mean and Median Expenses per Person With Expense and Distribution of Expenses by Source of Payment: United States. Medical Expenditure Panel Survey Household Component Data. Generated interactively.