








Research
August 24, 2026
Medicare for All: An Updated Coverage and Budget Analysis

In 2019, then-presidential candidate Kamala Harris proposed a replacement for the Affordable Care Act (ACA) built on the template of Medicare for All (M4A). The proposal (“the Plan”) would create a single-payer health system managed by the federal government with the explicit goal of universal coverage. In recent months, declared and potential candidates across the country have voiced support for exploring future M4A proposals. This report refreshes the American Action Forum’s (AAF) prior assessment of the Plan using updated projections from the Center for Health and Economy’s (H&E) combined Under-65 and Over-65 microsimulation models, rebased to a 2027–2036 budget window with full implementation beginning in 2027. This update also comes on the heels of a widely publicized Yale School of Public Health analysis, released as a preprint and modeled on the Medicare for All Act led by Senator Bernie Sanders (I–VT), estimating that a single-payer system could save the country roughly $1.04 trillion per year while preventing 114,000 deaths annually. The H&E simulation described in this report agrees that M4A can achieve universal coverage, but it identifies enormous federal financing requirements and material changes in medical productivity and provider access that the Yale headline figures do not fully capture. A detailed comparison of the two analyses is provided in the Appendix.
While the estimates below carry meaningful uncertainty, the top-line findings are as follows:
KEY FINDINGS
- Coverage under the Plan reaches effectively universal levels almost immediately: The ranks of the uninsured fall from 13 million in 2027, the first year of implementation, and to zero from 2028 onward, as the individual market, employer-sponsored insurance, and Medicaid are fully absorbed into the new federal program.
- Total insured population grows from 332 million in 2027 to 358 million by 2036, tracking total U.S. population growth — which now reflects undocumented and other illegal entrants who begin receiving coverage in 2026 — as essentially all net growth occurs in the new “Other Public Insurance” category that replaces private and Medicaid coverage.
- Medical productivity is projected to fall as the newly insured population enters the system and network-based cost controls disappear: The Medical Productivity Index declines 14 percent in 2027 relative to the current-law baseline, worsening to a 22-percent decline by 2036.
- Provider access improves as cost sharing is eliminated and coverage becomes universal: The Provider Access Index rises 12 percent in 2027 and climbs to a 19-percent improvement by 2036, assuming provider supply keeps pace with demand.
- Absent new revenue, the coverage provisions of the Plan carry a net budgetary cost of $2.5 trillion in 2027, rising to roughly $5.9 trillion annually by 2036, for a cumulative net cost of $47.4 trillion over the 2027–2036 period.
- Layering in the pay-fors identified in the Sanders M4A financing framework — which candidate Harris pointed to as a viable option — still leaves a shortfall: For 2028, $1.7 trillion in new revenue offsets only part of the $4.1 trillion coverage cost, leaving a net budgetary gap of $2.4 trillion for that year alone and $19.0 trillion cumulatively from 2028–2036.
- A separate Yale School of Public Health preprint claims M4A would instead save $1.04 trillion annually and prevent 114,000 deaths a year; the Appendix explains why AAF views that estimate as resting on considerably more optimistic assumptions than the H&E model supports.
MICROSIMULATION ANALYSIS
This update relies on the same H&E microsimulation framework used in AAF’s original assessment of the Plan. The model draws on the Medical Expenditure Panel Survey to simulate how households would respond to the Plan’s coverage rules and to translate those choices into national estimates of coverage, premiums, federal spending, and health care access and efficiency.
The Plan itself is unchanged from the original 2019 proposal: Tt would establish a national single-payer system that fully covers the population, eliminate premiums, deductibles, copays, and other cost sharing, and fold the individual market, employer-sponsored insurance, and Medicaid into an expanded Medicare program. Because H&E’s Under-65 model does not directly capture the over-65 population, the same set of bridging assumptions from the original analysis carries forward into this update:
- Similar Actuarial Value — current Medicare coverage (roughly 70 to 80 percent actuarial value) is approximated using individual- and employer-market PPO plans at Gold and Silver metal levels, with cost sharing loaded into the estimate.
- Total Government Spending — because the Plan eliminates consumer-facing costs, all health-insurance-related spending (and any associated revenue loss) is converted into federal outlays.
- Revenue — offsets not directly tied to the health insurance market are drawn from the financing options in the Sanders M4A plan, consistent with candidate Harris’s statement that the Sanders framework offered “good options” for financing her proposal.
As with the original analysis, this update does not attempt to price dental, vision, or hearing benefits, so the estimates below should be read as a lower bound on the full cost of the Plan. The updated model assumes full population transition and full program cost beginning in 2027, and it now explicitly incorporates coverage for undocumented and other illegal entrants to the United States starting in 2026, consistent with candidate Harris’s 2019 proposal not to exclude undocumented immigrants from the Plan.
COVERAGE IMPACT
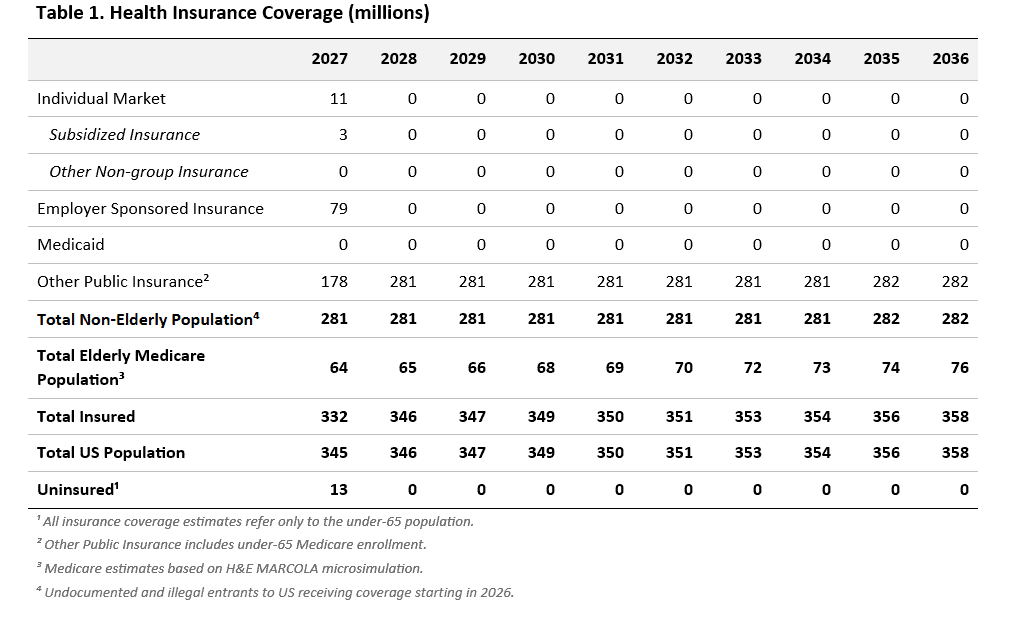
Consistent with any single-payer design, H&E projects the Plan drives the country to effectively full coverage almost immediately: Because enrollment is automatic rather than elective, the uninsured population falls from 13 million people in 2027 — the first year of implementation — to zero every year thereafter. The entire private insurance market and Medicaid are assumed to convert into an expanded public option, consistent with the design candidate Harris proposed in 2019, which is captured here as growth in Other Public Insurance. Because the model now also reflects undocumented and other illegal entrants gaining coverage starting in 2026, Total Insured converges with Total US Population by 2028, rather than leaving a small residual gap as in the prior update.
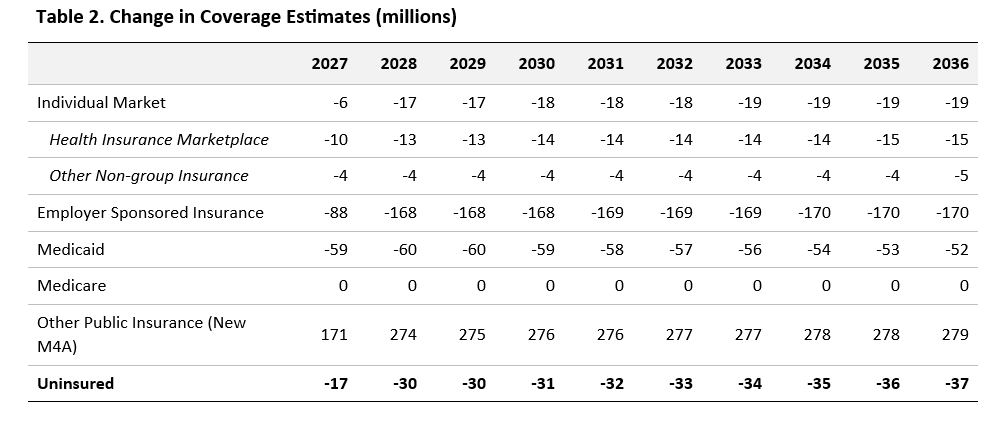
As Table 2 shows, Medicaid enrollment now declines toward zero across the full window rather than partially persisting, as the program is fully absorbed into the new M4A option; the slightly shrinking size of that decline over time (from -59 million in 2027 to -52 million in 2036) reflects the shrinking size of the counterfactual, status-quo Medicaid population against which the Plan is compared, not a partial phase-in of the Plan itself.
PRODUCTIVITY AND ACCESS
To gauge the Plan’s effect on the health care system beyond simple coverage counts, H&E constructs a Medical Productivity Index and a Provider Access Index. Both indices are built by scoring the plan designs available to consumers for their efficiency incentives and access characteristics, then tracking how the projected mix of coverage shifts those scores over time.

H&E continues to project a decline in medical productivity under the Plan. Newly covered enrollees who previously went without insurance add substantial new demand to the system, while the elimination of network-based plan structures and consumer cost sharing removes two of the primary mechanisms that encourage efficient use of care. Under the updated projections, the productivity index falls 14 percent below the current-law baseline in 2027 and continues to deteriorate to a 22–percent decline by 2036.
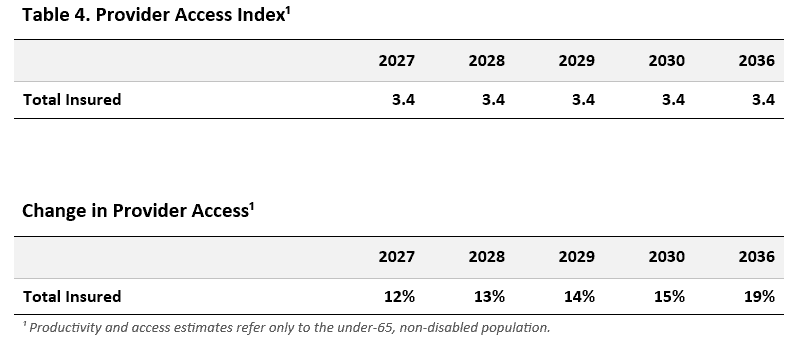
Provider access moves in the opposite direction. Universal coverage and the elimination of cost sharing raise average access to care relative to current law, and the shift of enrollees out of Medicaid — which typically offers comparatively poor access to providers — reinforces the improvement. The access index rises 12 percent in 2027 and reaches a 19-percent improvement by 2036, assuming the supply of providers is adequate to meet the added demand.
Note: Tables 3 and 4 reflect the July 31, 2026 release of the productivity and access indices. A subsequent H&E model refresh decomposes these indices by prior coverage type and produces materially different results, which are discussed in the Appendix.
BUDGET IMPACT
Absent new revenue, H&E projects the coverage provisions of the Plan carry a net budgetary cost of $47.4 trillion over 2027–2036. The table below separates “Sources of Funds,” meaning changes in federal revenue and savings, from “Uses of Funds,” meaning changes in federal spending.
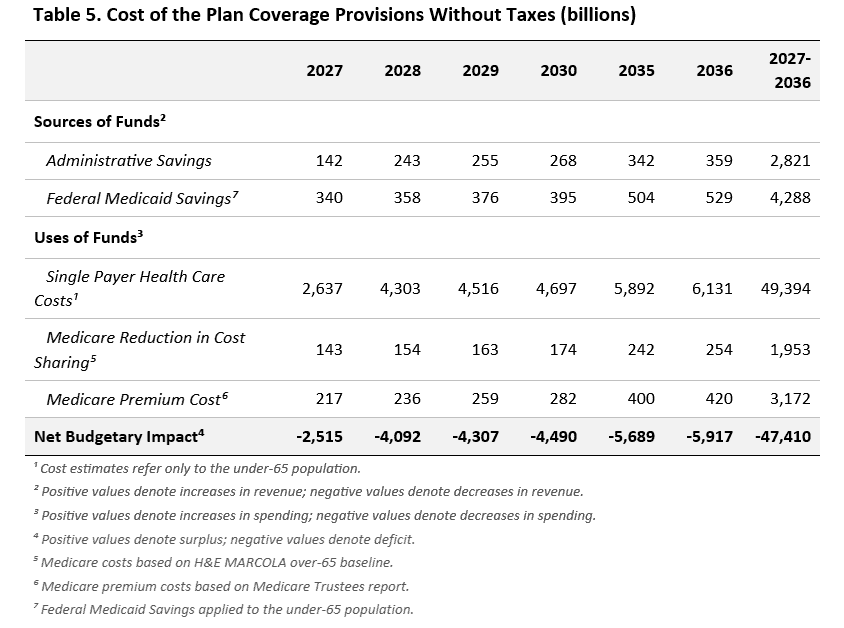
Over the 2027–2036 window, single-payer health care costs total $49.4 trillion, beginning at $2.6 trillion in the 2027 transition year and climbing to $6.1 trillion by 2036. These costs are partly offset by $2.8 trillion in cumulative administrative savings — reflecting the elimination of federal personnel and contractors who currently administer Medicaid, SCHIP, TRICARE, and other federal health programs — and by $4.3 trillion in federal Medicaid savings applied to the under-65 population. The estimate also adds $2.0 trillion in cumulative costs from eliminating Medicare cost sharing and $3.2 trillion from foregone Medicare premiums, consistent with the Sanders M4A plan’s proposal to replace premiums with an income-based tax, which Harris would have exempted for households earning up to $100,000.
REVENUE AND THE NET BUDGETARY IMPACT WITH TAXES
The Under-65 Microsimulation Model is not built to score every financing mechanism in the Plan — progressive income tax changes, capital gains and dividend taxes, and the estate tax, among others, fall outside what the model can directly estimate. To give a sense of how the Plan’s proposed pay-fors would offset its costs, Table 6 applies the revenue figures from the M4A financing text to the 2028 budget, the first full year of implementation in this update, and extends the comparison through 2036.
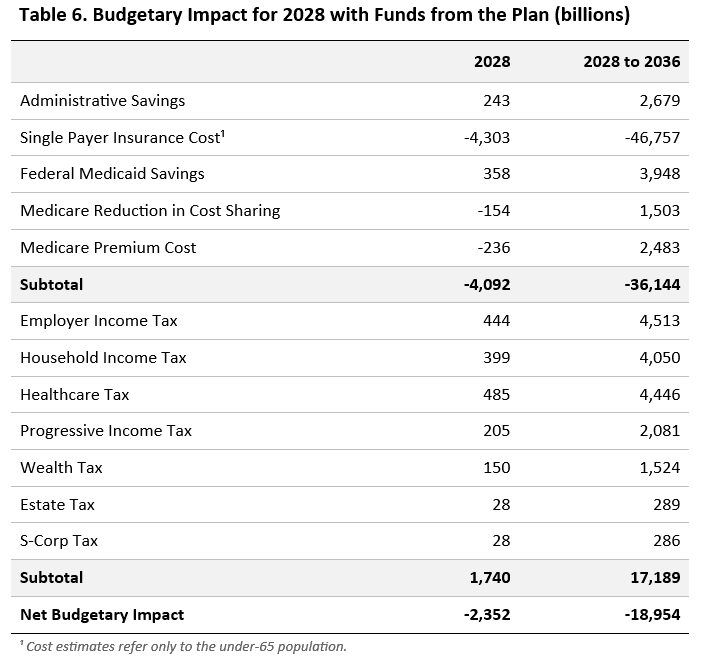
Even after layering in the identified pay-fors, a substantial shortfall remains. In 2028, $1.7 trillion in new tax revenue — from the employer income tax, household income tax, health care tax, progressive income tax, wealth tax, estate tax, and S-corporation tax — offsets only part of the $4.1 trillion net cost of the coverage provisions, leaving a net budgetary impact of –$2.4 trillion for 2028 alone. Over the full 2028–2036 period, the cumulative net budgetary impact remains –$19.0 trillion. Beyond the health care ledger itself, closing a gap of this size through further tax increases would pose a considerable additional burden on the broader economy.
UNCERTAINTY IN THE PROJECTIONS
H&E’s peer-reviewed microsimulation model provides a useful, unbiased central estimate of how the Plan would affect coverage, access, productivity, and the federal budget, but like any long-run economic projection it carries substantial uncertainty. The model is designed to depict a plausible middle path assuming the policy and economic environment otherwise remain stable; actual outcomes over a 10-year window are likely to diverge from any single point estimate.
Three sources of uncertainty are worth flagging. First, the magnitude of the utilization response to eliminating premiums and cost sharing is genuinely uncertain — the model’s own finding that provider access can tighten even as enrollment becomes universal suggests utilization could rise by more, or less, than projected. Second, several of the Plan’s financing provisions — including progressive income tax changes, capital gains and dividend taxation, and the estate tax — sit outside what the Under-65 model can directly score; Table 6 applies the Plan’s own stated revenue figures rather than an independently modeled estimate. Third, the transition assumptions used here — full implementation beginning in 2027, with undocumented and other illegal entrants gaining coverage starting in 2026 — are a modeling simplification of the Plan’s original 10-year phase-in, and different transition assumptions would shift the timing, though not the ultimate magnitude, of the costs and benefits described above.
APPENDIX: A COMPARISON TO THE YALE ANALYSIS
The Yale School of Public Health recently highlighted a new analysis making an unusually strong claim about M4A: A national single-payer system could simultaneously achieve universal coverage, save approximately $1.04 trillion per year, and prevent 114,000 deaths annually. The analysis attributes the savings primarily to lower pharmaceutical prices, Medicare-level provider payments, lower administrative costs, reduced fraudulent billing, and fewer avoidable emergency department visits and hospitalizations.
Universal coverage would unquestionably represent a major expansion of insurance protection. The central question, however, is whether the Yale analysis adequately captures the economic consequences of transforming nearly the entire financing and delivery system for American health care. The H&E microsimulation analysis described in this report suggests that the answer may be no: It finds that M4A can indeed achieve universal coverage, but only alongside enormous federal financing requirements and significant changes in medical productivity and provider access.
Universal Coverage Is Not the Contested Result
There is substantial agreement about one outcome. A sufficiently comprehensive single-payer program can eliminate the uninsured population because enrollment and financial barriers are effectively eliminated. In the H&E simulation, the transition is essentially complete by 2028: Employer-sponsored insurance, individual-market coverage, and Medicaid are replaced for the non-elderly by the new federal insurance program, and the uninsured population falls to zero.
But this illustrates an important distinction. M4A does not simply insure today’s uninsured — it replaces the insurance arrangements of hundreds of millions of people. Relative to the status quo, employer-sponsored enrollment falls by approximately 168 million in 2028 and Medicaid enrollment by 60 million, while enrollment in the new M4A program rises by 274 million. The relevant economic question is therefore not simply whether universal coverage can be achieved — it is whether replacing the existing financing and delivery arrangements for almost the entire population produces savings on the scale Yale projects.
The $1-trillion Savings Claim Depends on Strong Assumptions
The Yale estimate starts from approximately 2024 national health expenditures and concludes that M4A would reduce annual expenditures by $1.04 trillion, nearly 20 percent, despite roughly $304 billion of additional spending associated with unmet medical needs, uncompensated care, and universal dental coverage. The researchers attribute the gross savings to lower drug prices, Medicare-level provider reimbursement, administrative savings, reduced fraud, and reductions in avoidable hospital and emergency care.
This approach makes the treatment of provider prices particularly important. Paying hospitals and physicians Medicare-level rates can mechanically generate very large accounting savings, but lower prices paid by the government are not necessarily equivalent to equivalent reductions in the economic resources required to produce medical care. If reimbursement falls substantially while demand simultaneously rises because insurance and cost sharing have been eliminated, provider participation, capacity, waiting times, capital investment, and ultimately the quantity or quality of available services can change. The H&E analysis explicitly identifies provider supply as an important uncertainty and cautions that provider payment rates and supply responses could materially affect both budgetary costs and real access to care.
Administrative Savings Are Real — But Not Nearly Large Enough in the Alternative Model
Administrative simplification is perhaps the strongest economic argument supporting single payer: Eliminating multiple insurers, billing arrangements, networks, and benefit structures should reduce some administrative costs. The H&E model also finds substantial administrative savings — approximately $2.821 trillion over 2027–2036. But these savings are small relative to the spending the federal government assumes under M4A. The model estimates $49.394 trillion in single-payer health care costs for the non-elderly over the same period, and eliminating Medicare cost sharing adds another $1.953 trillion in federal obligations, while eliminating Medicare premiums adds $3.172 trillion. Administrative savings can be substantial while the overall fiscal commitment remains enormous — a distinction the Yale headline elides.
National Health Expenditures and Federal Spending Are Not the Same Thing
Perhaps the most important issue obscured by the Yale headline is the distinction between national health expenditures and the federal budget. A single-payer system could reduce measured total health spending while still increasing federal expenditures by trillions of dollars, as premiums, employer contributions, state Medicaid spending, and household cost sharing now outside the federal budget become federal obligations.
The H&E simulation illustrates the magnitude of this transformation. Single-payer health costs for the non-elderly rise from $2.637 trillion during the 2027 transition year to $4.303 trillion in 2028, reaching $6.131 trillion annually by 2036. After administrative and Medicaid savings and the additional Medicare obligations are incorporated, the model estimates a $47.410 trillion cumulative federal financing requirement over 2027–2036 before new taxes or other financing mechanisms. Saying that M4A “saves $1 trillion” can therefore be misleading unless the analysis clearly separates three different concepts: reductions in national health expenditures, reductions in the prices paid to providers and pharmaceutical companies, and changes in federal spending and taxation. They are not interchangeable.
Financing Cannot Be Treated as an Afterthought
The H&E analysis considers an illustrative combination of employer and household income taxes, a health care tax, progressive income taxes, a wealth tax, estate taxes, and S-corporation taxes from other sources. These mechanisms collectively generate an estimated $17.189 trillion from 2028–2036. Yet the modeled health-program shortfall over that period is $36.144 trillion, so even after applying all of these revenue mechanisms, the remaining federal financing gap is approximately $18.954 trillion.
Even that calculation is not a complete macroeconomic analysis. Taxes of this magnitude could change labor supply, wages and compensation, investment, capital realization, business organization, and ultimately the size of the tax bases themselves — while households and employers would no longer pay many existing premiums and cost-sharing expenses, so a complete welfare analysis must recognize those offsets too. The correct comparison is therefore not simply “$1 trillion saved versus the current system” — it is the distribution of gains and losses produced when premiums, employer health benefits, patient cost sharing, provider revenues, and state spending are replaced by federal expenditures and taxes.
The Yale Analysis May Understate the Utilization Response
Eliminating deductibles, copayments, coinsurance, and premiums changes the marginal price of medical care facing patients — that is one of the purposes of M4A, since previously uninsured and underinsured people would consume care they currently cannot afford. Yale incorporates $304 billion in additional spending for unmet needs, uncompensated care, and dental benefits, but the magnitude of the longer-run utilization response to essentially zero patient prices is necessarily uncertain. The H&E model explicitly treats utilization following the elimination of cost sharing as a major behavioral assumption rather than a fixed accounting quantity, recognizing that a reform of this scale could affect utilization, provider behavior, labor compensation, tax bases, and the supply of medical services. Estimates of savings can appear highly precise while being driven by assumptions about behavioral responses that are inherently uncertain.
Coverage Does Not Necessarily Equal Access
One of the most important contributions of the H&E framework is separating insurance coverage from provider access. The Yale argument implicitly moves from universal insurance to greater access and then to improved health outcomes, yet possession of an insurance card does not guarantee timely access to physicians, specialists, hospitals, or other services.
The H&E results, refreshed as of this update, demonstrate why this distinction matters. Former Medicaid beneficiaries experience a modeled 100-percent improvement in the provider-access index because their starting access is comparatively limited, but former employer-sponsored beneficiaries experience a 44-percent reduction, while former individual-market beneficiaries experience roughly a one-third decline. Across the total insured population, the refreshed model projects a 29-percent reduction in its provider-access measure — a materially different result from the July 31 release discussed in the body of this report, and a reminder that these estimates remain sensitive to how access is modeled. These estimates depend on assumptions about adequate provider supply, but that is precisely the point: Universal insurance and universal access are different outcomes. A convincing M4A analysis therefore needs to model not only whether every American receives insurance but whether enough medical capacity exists at the proposed reimbursement rates to provide the additional care being promised.
Medical Productivity Is Another Missing Dimension
The H&E analysis also considers the efficiency effects of eliminating differentiated insurance networks and cost sharing. Its Medical Productivity Index attempts to capture how networks, prices, and patient incentives influence the use of medical resources. Under the refreshed model, medical productivity for the total insured population falls 15 percent in 2028 and 22 percent by 2036 relative to the pre-M4A baseline, with some previously insured groups experiencing still larger declines. These estimates should not be treated as certain — the report itself emphasizes that they are model-dependent — but they identify an economic mechanism largely absent from the Yale headline: Eliminating administrative complexity and cost sharing can produce savings and improve financial protection while simultaneously weakening incentives for price-conscious utilization. The relevant policy calculation must account for both effects.
The 114,000-lives Estimate Deserves Particular Scrutiny
The Yale mortality result is even more ambitious than its spending estimate. The researchers estimate that universal coverage itself would avert approximately 62,863 deaths annually, including 29,631 among people who already have insurance but are considered underinsured. The headline figure of 114,174 deaths, however, includes another 51,311 deaths attributed to reversing coverage rollbacks and other health policies enacted since 2025.
That distinction is important. The headline can easily be read as saying that M4A itself saves 114,000 lives each year, but based on Yale’s own description, roughly 45 percent of the headline mortality estimate comes from reversing other policies, rather than from the modeled effect of universal insurance alone. There is also a more fundamental identification problem: Moving from statistical associations between insurance status, financial barriers, and mortality to a precise estimate of deaths prevented by M4A requires strong causal assumptions, since health status, income, employment, disability, insurance coverage, and medical utilization are jointly determined. A credible mortality estimate must establish how much of the observed mortality difference is actually caused by insurance coverage and how much reflects correlated socioeconomic and health characteristics. The additional possibility of capacity constraints makes the calculation still more uncertain — if substantially more people seek care while reimbursement rates fall and provider supply does not expand proportionately, the relationship between nominal insurance coverage and realized medical treatment becomes critical.
A More Complete Interpretation
The strongest conclusion from comparing these analyses is not that universal coverage cannot improve health or reduce some categories of waste — it almost certainly would improve financial protection for millions of Americans, and administrative simplification could produce meaningful savings. The disagreement concerns what happens after those first-order effects. The Yale analysis emphasizes administrative savings, lower prices, fraud reduction, and the health benefits of expanded coverage. The H&E analysis emphasizes the financing transfer to the federal government, increased utilization under first-dollar coverage, changes in provider access, and reduced medical productivity. The latter model still produces universal coverage; it simply demonstrates that universal coverage does not make the other economic tradeoffs disappear. Indeed, the H&E report characterizes its estimates appropriately as scenario projections rather than point forecasts, because a reform of this magnitude would change utilization, provider behavior, compensation, tax bases, and medical supply.
Conclusion
The Yale study provides a provocative case for Medicare for All, but its headline — $1 trillion and 114,000 lives saved every year — creates a degree of certainty that the economics of such a transformation cannot support. The more defensible conclusion is narrower: Medicare for All could achieve universal insurance coverage and generate substantial administrative savings. Whether it would reduce total U.S. health expenditures by $1 trillion annually depends heavily on assumptions about provider reimbursement, pharmaceutical prices, fraud reduction, utilization, and medical supply. Whether those expenditure reductions represent genuine efficiency gains rather than transfers or reductions in provider revenue requires additional analysis. And whether universal insurance produces the projected mortality benefits depends on both causal assumptions and the availability of medical capacity to translate coverage into actual care.
Most important, national health expenditure savings should not be confused with federal budget savings. The H&E model projects that M4A would shift tens of trillions of dollars of health spending onto the federal budget, producing a $47.410 trillion federal financing requirement over 2027–2036 before new taxes and leaving a substantial financing gap even after a broad package of proposed taxes. The central question raised by Medicare for All is therefore not whether universal insurance is achievable — it is. The harder question is whether the United States can simultaneously provide first-dollar universal coverage, dramatically lower provider and pharmaceutical payments, accommodate the resulting increase in demand, maintain provider capacity and access, avoid significant efficiency losses, and finance the resulting federal commitment without substantial economic consequences. A credible evaluation of Medicare for All must answer all of those questions — not simply count the savings while assuming the rest away.
* This update applies the methodology of AAF’s original analysis, “Medicare for All: The Harris Plan” (Stephen Parente and Theo Merkel, August 11, 2024), to a revised set of H&E microsimulation outputs covering 2027–2036, and incorporates comparative commentary on a Yale School of Public Health preprint. Author attribution for this update should be confirmed before publication.