Research
January 10, 2017
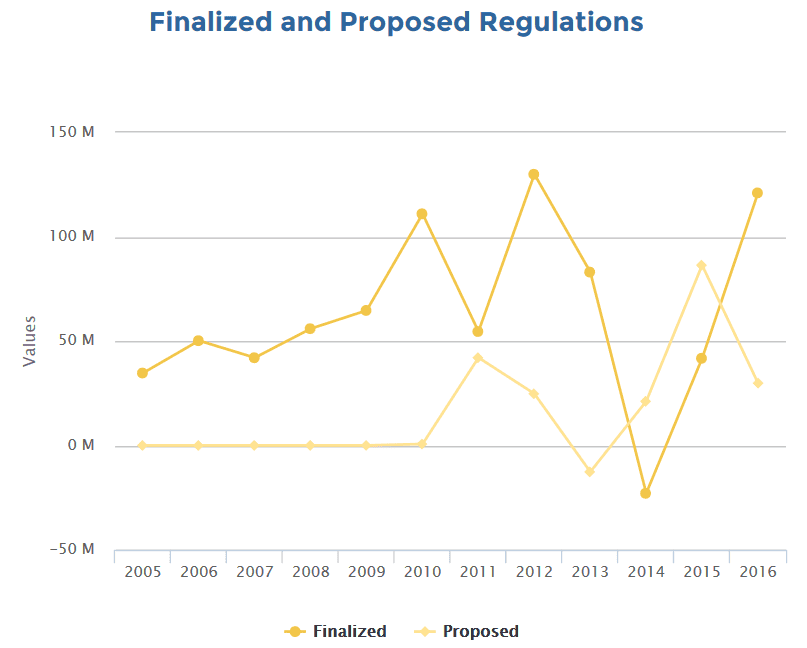
The Midnight Year in Regulation: $164 Billion in Costs, 120 Million Paperwork Hours
President Obama’s final year in office marked his “midnight” for regulating before the arrival of President-Elect Trump. Based on research from the American Action Forum (AAF), regulators published $210 billion in total regulatory costs (proposed and final), with $164 billion from final rules alone. In his last year, the Obama Administration published a slate of controversial rules, including fiduciary standards ($31.5 billion), a second round of emissions standards for heavy-duty trucks ($29.3 billion), a workplace silica rule ($9 billion), and a measure increasing overtime pay ($2.9 billion). Broadly, 2016 stands as the second most burdensome year for federal regulation AAF has tracked since 2005 (by annual costs), trailing only 2012.
Snapshot
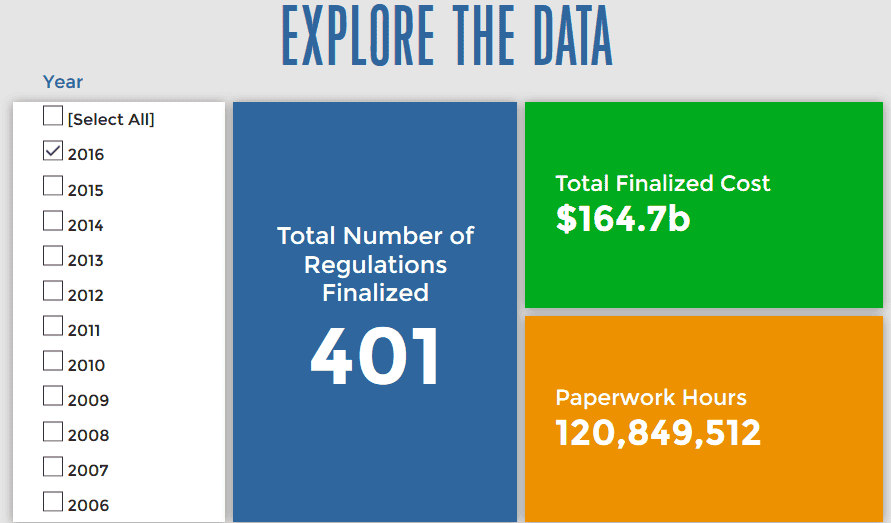
- Final Annual Costs: $23.2 billion
- Total Final Costs: $164 billion
- Total Costs Per Person: $648
- Total Paperwork Hours: 146 million
- Final Paperwork Hours: 120 million
- Final Annual Benefits: $45.3 billion
- Major Rules: 118 (continually updated)
In terms of total final costs, 2016 is trumped only by 2012 ($218 billion) and just barely by 2010 ($169 billion). However, there were only $18 billion in annual costs in 2010, versus more than $23 billion in annual costs in 2016, making last year the second costliest on record (since 2005).
As of this writing, the administration has published 90 major rules, according to the Government Accountability Office (GAO). However, there is a lag between when a rule is published and when GAO logs it in its major rule database. For example, currently GAO only has a record of rules from November 18 and prior in the year. Thus, with ten more major rules, the administration can tie its own record of major rules in a calendar year (100 in 2010), and with 11, it can break the record. Based on a review from the Office of Information and Regulatory Affairs (OIRA), it has concluded review of 21 major final rules from November 18, 2016 to the end of the year. Thus, it is likely 2016 will have the record to itself.
The regulatory activity in 2016 was driven in part by a few large rules and by an active post-election surge of rulemaking. The three largest rules, Fiduciary Rule ($31.5 billion), Phase II of Greenhouse Gas Standards for Trucks ($29.3 billion), and Efficiency Standards for HVAC Equipment ($15 billion) combine for $75.8 billion, or nearly half of the year’s total final regulatory tally. The post-election surge was also notable: 1) OIRA averaged 46.4 rulemakings a month before December and in the last month, it managed to produced 99 regulations, more than any December since 1993. 2) The administration published $21 billion in total costs, $16 billion in final rules, and 21 million hours of paperwork after Election Day. 3) In the 36 working days after the election, the administration managed to release more than 145 regulations. A few large rules, combined with a historic last-minute surge made 2016 one of the most active regulatory years on record, only trailing 2012.
Largest Rules
As noted above, 2016 was a notable year for “mega” or “high-impact” rules, regulations that impose $1 billion or more in annual costs. President Bush averaged 1.6 mega rules annually, but President Obama increased that to more than 3.25 a year, including six in his final year. Below are the ten largest rules, ranked by annual costs:
- GHG Emissions for Heavy-Duty Trucks: $2.5 billion
- Margin Requirement for Swap Dealers: $2 billion
- Fiduciary Rule: $1.9 billion
- Joint Industry Plan: $1.7 billion
- Renewable Fuels Standard: $1.5 billion
- Exposure to Silica: $1 billion
- Proposed Hospital and Critical Access: $998 million
- Requirements for Long-Term Care: $758 million
- Efficiency Standards for HVAC Equipment: $711 million
- Head Start Performance Standards: $599 million
Combined, regulators estimate these ten rules will impose $13.9 billion in new annual costs. However, on a long-term, net present value basis, costs for these rules alone exceed $105.2 billion. In addition, the associated paperwork from these rulemakings will impose 11.2 million hours of reporting and recordkeeping.
It’s important to note that all but one measure on this list is a final rule. In a typical year, there is generally an even mix of significant proposed and final rules. In a midnight year for regulation, however, there is every incentive to publish final rules and leave as few measures as possible in proposed form, as they can easily be delayed or rescinded by the next administration.
Most Active Agencies
Generally, environmental regulators top the list as the most active regulators. Not in 2016, as Secretary of Labor Tom Perez published a slate of expensive rules in 2016 and led his agency to more than $45 billion in regulatory costs; he also imposed more paperwork than any other agency. The chart below tracks final rule costs for the most active regulatory agencies.
|
Agency |
Total Cost (in millions) |
Total Paperwork (in hours) |
|
Labor |
$45.8 billion |
40.1 million |
|
Environmental Protection Agency |
$32.6 billion |
3 million |
|
Health and Human Services |
$31 billion |
29.6 million |
|
Energy |
$19 billion |
1.2 million |
|
Transportation |
$11.2 billion |
10.4 million |
|
Interior |
$6.6 billion |
1.2 million |
|
Securities and Exchange Commission |
$6.1 billion |
9.9 million |
|
Homeland Security |
$3.4 billion |
2.7 million |
|
Treasury |
$2.8 billion |
8 million |
|
Totals |
$158.8 billion |
106.6 million |
Combined, the nine agencies above produced $158 billion in total costs, out of $164 billion total government-wide. The paperwork burdens are also substantial, 106 million, from roughly 120 million in government-wide recordkeeping and reporting burdens.
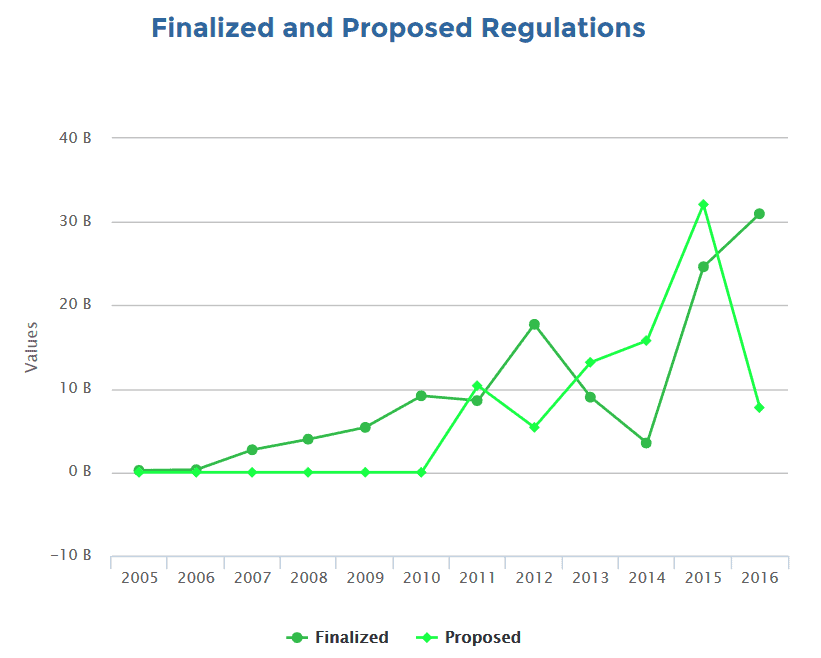
For the first time since at least 2005, the Department of Labor (DOL) has captured the crown as the most active regulator, with $45 billion in total costs, easily eclipsing the Environmental Protection Agency (EPA). In previous years, DOL never topped $4 billion in burdens, but in a year with ten major regulations, after averaging just three annually the prior decade, DOL has far outpaced its historical averages. The graph below displays DOL’s regulatory costs from 2005 to present, courtesy of AAF’s RegRodeo (dark line represents final costs).
For DOL, the massive jump in 2016 results mainly from the final “Fiduciary” rule, which imposes more than $31 billion in long-term costs and could drive millions of retirement savers out of the investment advice market. This was not the only “mega” rule from DOL this year, as they also finalized workplace silica standards, which will impose more than $9 billion in total costs and 12 million paperwork burden hours.
Surprisingly, EPA did not take the top spot for new regulatory burdens. At $32 billion, it was down slightly from its $40 billion imposition in 2015, but still far off from 2012, when the agency published more than $170 billion in regulatory costs. This year, a vast majority of EPA’s total came from final greenhouse gas (GHG) standards for heavy-duty trucks. Even at $29.3 billion in costs, it is still only the third most burdensome EPA measure since 2005. In terms of overall major rule activity, 2016 was a notable increase for the agency, as the Office of Information and Regulatory Affairs (OIRA) approved eight final major rules, after averaging roughly five during the previous decade, including President Obama’s tenure.
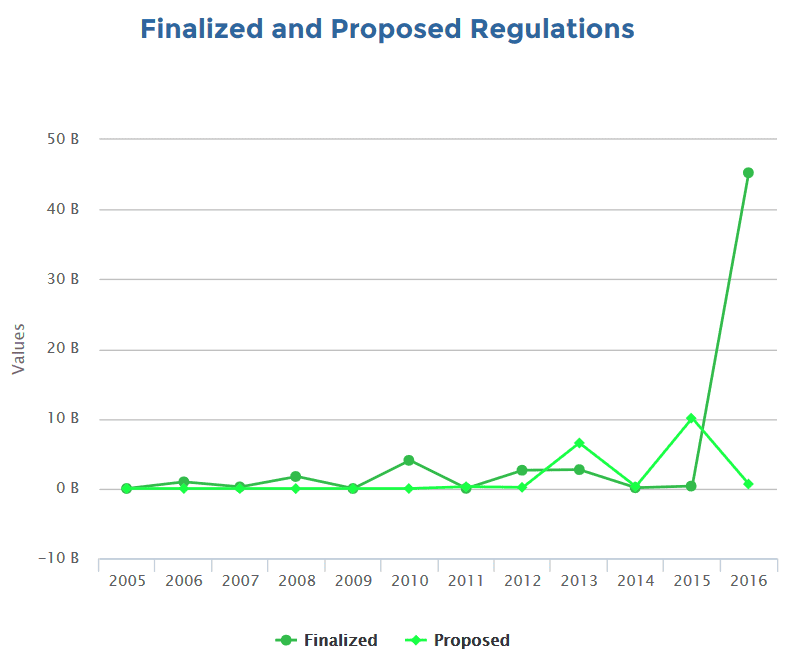
Finally, the Department of Health and Human Services (HHS) broke records by imposing $31 billion in costs, ahead of its $17.7 billion pace in 2012. Consider, the agency published just $2.7 billion in burdens in 2007. The graph below charts the cost history of HHS from 2005 to present (including sub agencies).
Unsurprisingly, with passage of the Affordable Care Act (ACA), the agency’s regulatory burden has expanded. In 2016, it was driven by new food labeling guidelines, which combined, will add $8.6 billion in costs to manufacturers and consumers and 2.6 million paperwork burden hours. In addition, HHS published an ACA rule for long-term care requirements, which will impose $3.1 billion in costs and a controversial regulation of “e-cigarettes,” which will cost $1.1 billion and add 1.6 million paperwork burden hours.
Broadly, the administration released 35 major HHS regulations in 2016. Since 2005, the annual average was just 11 major rules. For example, OIRA released just eight major HHS rules in 2006. In other words, in 2016 HHS more than tripled its output of major regulation, contributing to its record level of regulatory costs.
Raising Prices and Reducing Employment
Generally, when companies bear regulatory costs, there are three options: 1) pass the cost on to consumers in the form of higher prices, 2) cut employment or reduce employee pay, and 3) reduce profits to shareholders. For one and two, regulatory impact analyses often forecast the impact on prices and potential employment affects.
In 2016, regulators imposed rules that could eliminate 11,560 jobs, according to their estimates. One of the largest, efficiency standards for residential furnaces, could impose $9.2 billion in costs, and also eliminate more than 1,700 jobs. Likewise, the $15 billion HVAC efficiency rule could cause nearly 1,000 layoffs, based on agency estimates. The 11,560 job-loss figures is from only ten rules that estimated the impacts, so there could be other rules that will affect employment, but that regulators did not publicly disclose.
For prices, there were 12 rules that estimated consumers would pay more because of new federal regulation. They ranged from a low of $29 more for a dehumidifier, to $10,600 more for a heavy-duty truck. Combined, the price increases from federal regulation in 2016 totaled $23,498. No one consumer will bear this cost but regulatory costs are not borne by some faceless corporation. They are often paid on check-out by average consumers with little knowledge that federal agencies are increasing prices. Below are the products with notable price increases because of regulation:
- Heavy-Duty Trucks: $10,676
- Commercial Packaged Boilers: $10,508
- Commercial Water Heating Equipment: $924
- Compressors: $602
- Walk-in Coolers and Freezers: $275
- Hybrid and Electric Vehicles: $125
- Portable Generators: $118
- Ceiling Fans: $91
- Portable Air Conditioners: $69
- Pumps: $46
- Uninterruptible Power Supplies: $30
- Dehumidifiers: $29
By Industry
When agencies release rules, they designate where in the Code of Federal Regulations (CFR) the regulations will be codified. For example, environmental rules are in Title 40 of the CFR and efficiency standards are in title 10. With this data, AAF is able to display regulatory burdens by industry or subject matter, from agriculture to transportation. The graph below depicts regulatory costs in blue, with new paperwork in red. Anything to the right represents net costs and anything to the left depicts fewer burdens.
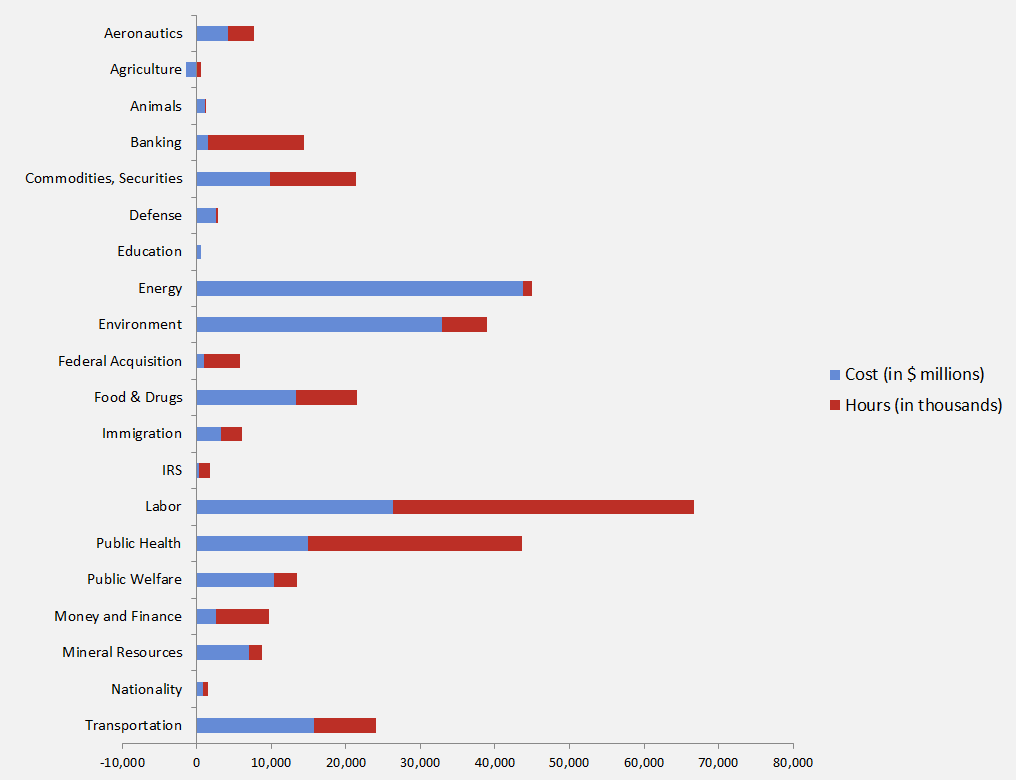
As mentioned above, DOL set records in 2016 and labor regulations far outpaced other areas of regulation, including energy and the environment. The gap between agricultural rules, which eliminated $1.5 billion in costs, and labor regulations, which added $26.2 billion in costs, is stark. In addition, “Environment” might look outsized on the graph, but a vast majority of its costs derive from Phase II of the heavy-duty truck efficiency standards. Finally, HHS generally regulates Titles 42 and 45, “Public Health and Public Welfare.” If they were combined, they would exceed labor’s costs.
By State
When regulators publish their analysis of rules, they often list the affected industries. For example, when DOE listed its HVAC efficiency standards, it listed “Air-Conditioning and Warm Air Heating Equipment and Commercial and Industrial Refrigeration Equipment Manufacturing” as the affected industry. Census data detailing the geographic distribution of industries nationwide allows AAF to apportion illustrative regulatory burdens by state.
The map below represents the cost distribution of the largest final rules in 2016. Regulators targeted industries in California ($12.3 billion), Texas ($10 billion), and Florida ($7.7 billion) more than any other state.
Paperwork
With 120 million in final paperwork burden hours, 2016 marked the second most active year, after only 2012. Now that the cumulative regulatory burden tops 11 billion hours, it appears regulators did not spend 2016 making it easier for individuals and businesses to interact with government. For example, in 2014, regulators managed to cut 22 million hours of paperwork on net. The graph below, courtesy of RegRodeo, charts paperwork growth from 2005 to present:
Few years are likely to topple 2012, when regulators published 129.9 million hours of paperwork, but last year was a close second. The largest drivers of paperwork were from DOL, with three of the largest measures, combining for 29 million hours alone, or almost all of 2005’s burdens.
The Department of Treasury also added several notable burdens, including a seven million-hour rule for “Customer Due Diligence Requirements.” This would require at least 56 hours of recordkeeping per financial institution, totaling more than seven million hours of paperwork. The annual cost of the rulemaking is $220 million.
In total, there were 31 final rules that imposed at least one million hours of paperwork. Combined, they added 103 million hours, out of the government-wide total of 120 million hours in 2016. To put this figure in perspective, it would take 6,500 employees working full-time (assuming 2,000 hours annually) to complete just the final paperwork requirements added last year. It would take 291,000 employees to labor over the paperwork added since 2009, roughly the population of St. Paul, Minnesota.
Finally, the administration proposed more than 25 million hours of paperwork in 2016, including a Medicare and Medicaid rulemaking that adds 8.3 million hours of paperwork, and a CFPB measure for payday loans, that could impose 6.6 million hours, but somehow no monetized costs. If these are other proposed measures are not finalized by January 20, 2017, the incoming Trump Administration could easily place these rulemakings under review or even scuttle them entirely.
Benefits
In 2016, agencies finalized rules that were estimated to generate $45.3 billion in annual benefits. There were only 49 rules that monetized benefits, versus more than 340 that did so with costs. The final GHG standards for heavy-duty trucks led the way, producing $19.8 billion in monetized benefits, largely from reduced fuel consumption, cleaner air, and fewer GHG emissions.
DOL had two of the top four rules generating benefits. It is generally the case that regulations with the highest costs also produce the highest benefit figures. DOL was no different, as the workplace silica rule is expected to generate $4.8 billion in annual benefits and the Fiduciary rule could save consumers $3.4 billion, although many dispute the latter figure. DOL’s “Fall Protection Systems” rule is also expected to increase workplace safety, with $615 million in annual benefits.
Although HHS does not typically monetize both costs and benefits, its “Treatment for Opioid Use Disorders” is estimated to produce $1.8 billion in annual average benefits, compared to $233 million in costs. These benefits stem mainly from longer “Quality Adjust Life Years” and reduced interactions with the criminal justice system. After five years of implementation, annual benefits are expected to rise to $2.4 billion.
Last year was not a record-breaker for deregulatory measures, but regulators did finalize 17 rules that reduced annual costs, totaling $2 billion; these 17 measures also reduced paperwork by one million hours. On net, however, federal regulatory burdens were still positive in 2016. The Department of Agriculture published the largest cost-cutting rule: “Removal of Country of Mandatory Country of Origin Labeling.” At -$1.8 billion, it accounts for a vast majority of overall deregulatory measures, but it was a direct result of a congressional directive from 2016, not an agency-led initiative.
Despite an executive order mandating that agencies, “modify, streamline, expand, or repeal” ineffective regulations, as AAF has noted frequently, many retrospective reviews often “expand,” rather than “repeal” past rules. Although the administration should be commended for eliminating roughly $2 billion in costs and proposing to cut another $1.6 billion in long-term costs, on net, its regulatory output dwarfs these moves. After six years of retrospective review, these deregulatory measures are a historical footnote to eight years of setting new regulatory records.
Conclusion
In 2016, President Obama carved out another legacy of record-breaking proportions. Last year will likely take the record for most major rules issued in a calendar year. It ranks second in annual regulatory burdens. Unlike previous years, however, 2016 was marked by DOL’s frenetic regulatory pace and HHS’s historic output. EPA, while still imposing billions of dollars in burdens, was largely an afterthought.
Despite more than $164 billion in regulatory costs, President Obama’s regulatory legacy is not yet complete. There are still a few, likely active, days left to regulate. It’s possible the administration could publish more than $30 billion in “midnight” regulations. These notable impositions will surely pique the interest of Congress and the next administration as they scrutinize recent rules and chart a new regulatory vision.
Methodology
AAF has data on costs and paperwork burdens for all rulemakings published in the Federal Register from 2005 to present (updated weekly). Every regulation that imposes a private-sector burden, intergovernmental cost (for state and local governments), or paperwork burden is recorded and tracked throughout the rulemaking process. Federal agencies provide the estimates on costs, benefits, and paperwork burdens.
For the purposes of “Reg Rodeo,” AAF focuses on data for total costs and paperwork hours. Each rule link includes additional data on annualized cost estimates (generally a central figure at a seven percent discount rate), regulatory impact analyses with benefit data, and notes on any judicial decisions affecting a rule. All hyperlinks should point directly to the relevant cost-benefit section.
The total cost figure generally represents the highest estimate provided in the rule. Agencies often vary in methodology and language, but these estimates are often displayed as “Total Costs” or “Total Net Present Value Cost.” Some agencies provide net present value figures during a 30-year horizon, while others list only an annual cost. In cases where an agency does not clearly provide a total cost figure, AAF typically uses the given annualized cost figure, which is why sometimes the annual and total cost figure are the same. If the agency gives a specific time-frame for its annual cost calculation, AAF uses that period to derive a projected lifetime cost estimate.
If you feel there are any errors with the figures, please contact us and we will examine every figure and correct if necessary.