Research
June 14, 2021
Poverty in the United States
Executive Summary
- Congress is considering whether to make the recently expanded child tax credit permanent, a decision that requires an understanding of the different official metrics of poverty, primarily the Official Poverty Measure (OPM) and the Supplemental Poverty Measure (SPM), as well as the various factors associated with poverty for both children and adults.
- Both the OPM and the SPM indicate that poverty in the United States has been declining for most of the past decade.
- Under both the OPM and SPM, employment and educational attainment are the two best indicators for whether someone is likely to be impoverished, followed by whether the household is headed by an unmarried female.
- Children are the only age group and one of the only groups among all the characteristics considered to have a lower poverty rate under the SPM compared with the OPM, largely because of the tax credits and benefits available to households with children which are counted as income by the SPM.
Introduction
In the American Rescue Plan enacted earlier this year, Congress temporarily expanded the child tax credit. Proponents argued that this expansion would cut the child poverty rate in half, but now Congress must decide whether to make this expansion permanent.[i] In considering this decision, policymakers need to understand the different metrics for measuring poverty as well as the various factors that are associated with higher poverty. Further, child poverty is inextricably tied to adult poverty, which means that it is valuable to survey poverty rates and causes for all age groups.
The federal government uses multiple methods for measuring poverty—primarily, the Official Poverty Measure (OPM) and the Supplemental Poverty Measure (SPM), as explained in this American Action Forum (AAF) primer. The main difference between the two is that the SPM considers a broader range of income sources while also accounting for expenses of several types of basic needs, making it a better estimate of material wellbeing relative to the OPM, which is more a measure of self-sufficiency. Given the different considerations of the two methods, the calculated poverty rate varies depending on which metric is used. Some individuals may be more likely to be considered poor under the OPM, while most are more likely considered poor under the SPM. As explained in prior AAF research, there are other—perhaps more useful—methods for measuring poverty and material hardship, but they are not as widely used.
This paper summarizes the federal government’s poverty statistics under the two methodologies by various characteristics of the population, highlighting those factors that are the strongest indicators of poverty. It then examines the statistics specifically regarding child poverty.
Overall Poverty Rate: Official Poverty Measure
The OPM estimates that 10.5 percent of Americans (34 million) were living in poverty in 2019, with declines from the year before under each demographic or characteristic measured, consistent with trends over the past decade.[ii]
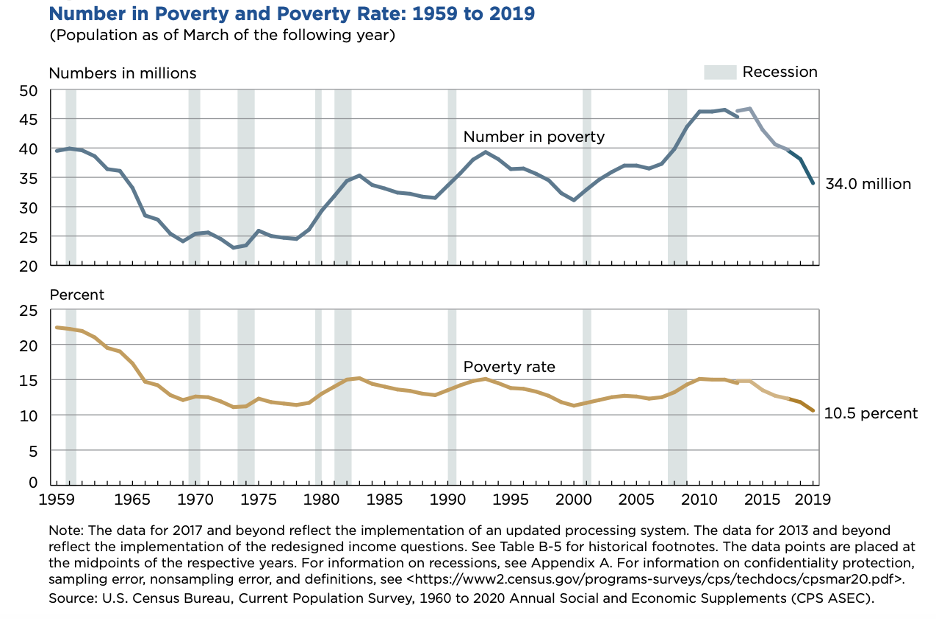
Source: https://www.census.gov/library/publications/2020/demo/p60-270.html
Overall Poverty Rate: Supplemental Poverty Measure
The SPM is a broader measure of poverty, as noted. While the SPM therefore considers most people to have a higher income than the OPM, the consideration of expenses results in a higher overall poverty rate.
According to the SPM, 11.7 percent of Americans (38.2 million) are considered poor.[iii] Despite the higher poverty rate, accounting for both benefits and expenses results in income inequality being less pronounced under the SPM than the OPM; fewer people fall into either the lowest or the highest income brackets.[iv] It should also be noted that the SPM relies on self-reported income and studies have shown significant underreporting, making this metric somewhat unreliable and inaccurate; this underreporting suggests that fewer people are impoverished than is stated in the official rate.[v]
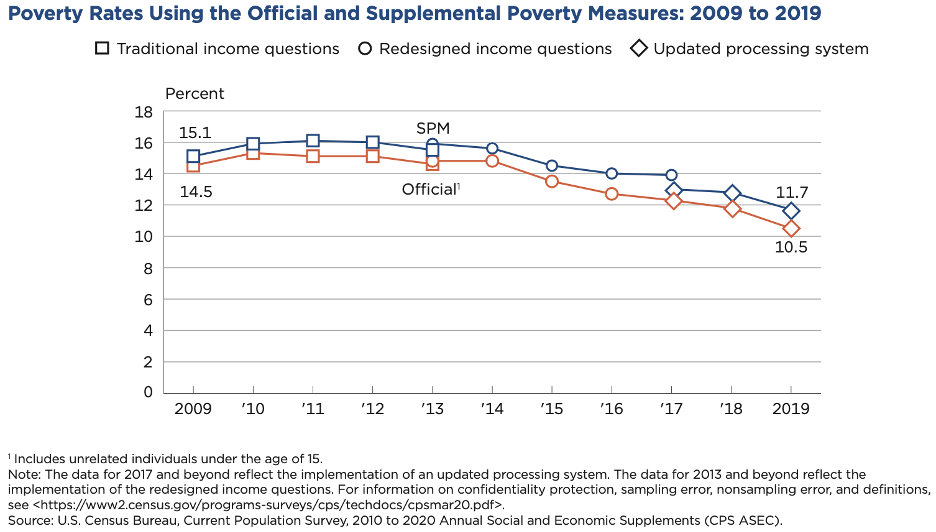
Source: https://www.census.gov/library/publications/2020/demo/p60-272.html
Poverty Rates by Select Characteristics
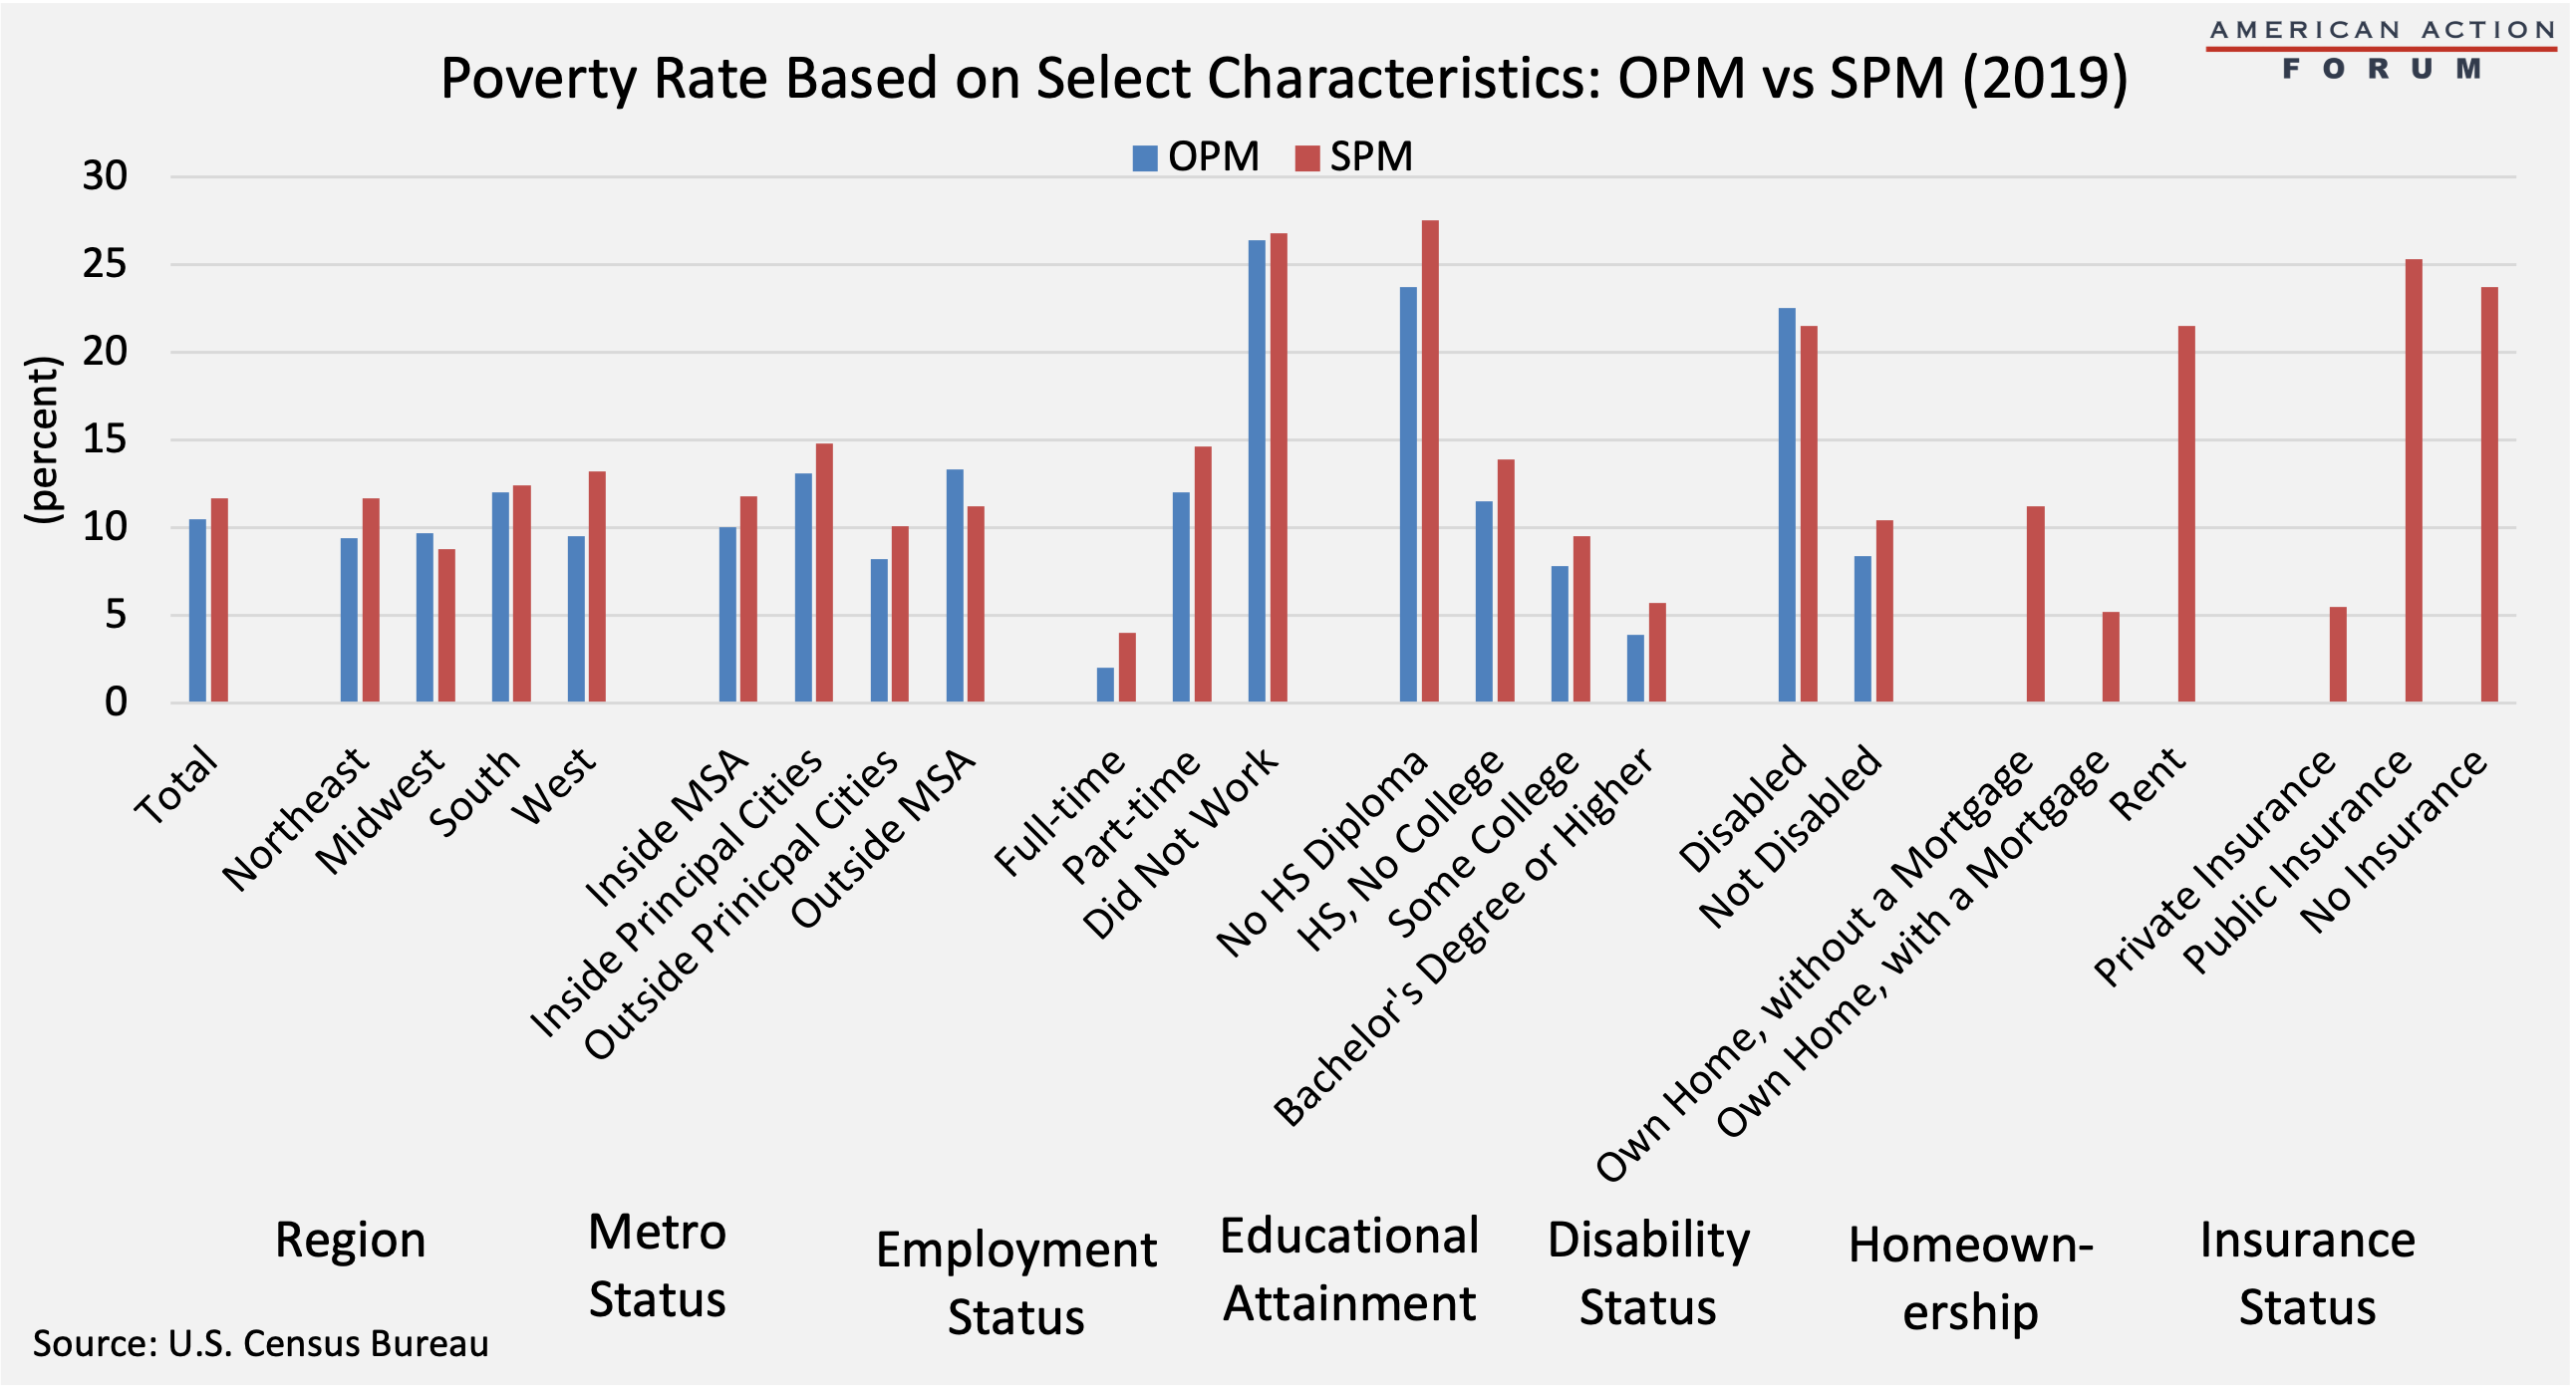
As shown by the charts below, a handful of variables stand out as the most predictive as to whether someone will be in poverty, primarily employment status and educational attainment, which logically are linked. Individuals who work full-time year round are highly unlikely to be in poverty, whereas more than one-fourth of those who did not work at all were in poverty. Under the SPM, likely because of the accounting of various expenses, twice as many full-time workers are considered poor relative to under the OPM, though the rate is still just 4.0 percent.[vi] Similarly, the more education individuals have, the less likely they are to be in poverty, which is surely related to the fact that people are more likely to be employed full-time (and with higher wages) the more educated they are.[vii]
Female-headed households are also significantly more likely to be impoverished than either male-headed households or households of married couples. This likely is also highly correlated with employment. In 2019, the labor force participation rate of women, as well as the share working full-time, was 23 percent lower than that of men.[viii] Women with children are also much less likely to be working full-time, particularly those with children under the age of six: Just 73 percent of noninstitutionalized women with young children are working full-time, compared with 94 percent of such men with young children.[ix] Given the aforementioned connection between education and employment, however, this employment gap may soon begin to narrow as women are now more likely than men than to earn a college degree, and that reversal is growing each year.[x]
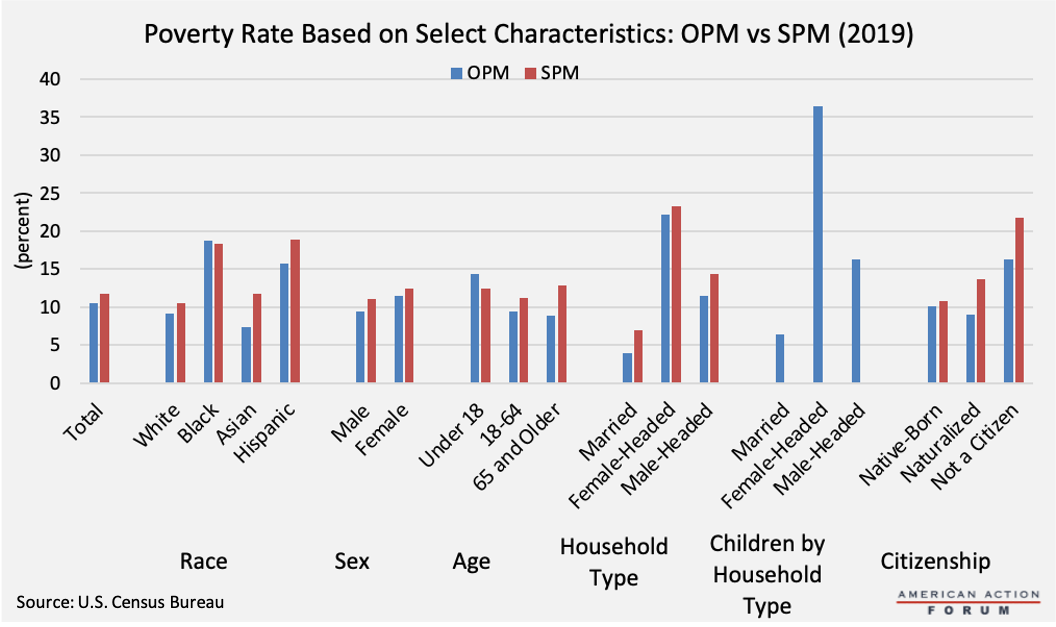
There are also several factors that lead to significant differences in the poverty rates among groups of people, and other factors that result in significant differences between the two measures for a given group of people. For example, noticeable differences exist between people of different races, but depending on which measure is used, the race with the highest poverty rate and that with the lowest poverty rate changes. Further, the poverty rate among Asians is 60 percent greater when using the SPM relative to the OPM; no other racial group has such a disparity between the two measures.
Child Poverty
Child poverty is a particular focus among policymakers examining government responses to poverty. Poverty metrics typically consider households as a single unit when determining whether someone is in poverty, i.e. children are in poverty if their parents or guardians are. Because of this relationship, children are generally more likely to be considered poor if their parents are not well educated or employed full-time; the younger they and their parents are; if they live with a single mother or un-related individuals; if they live in the South; and if they are Black or Hispanic.
One of the most interesting differences between the two poverty rates is the difference based on age, particularly regarding children. Under the OPM, despite children being considered poor only when their parents are, too, children are most likely to be considered poor: Those under 18 years old have the highest official poverty rate of any age group (14.4 percent or 10.5 million), roughly 50 percent higher than 18-64 year-olds (presumably the age bracket of their parents), and this has been true since the 1980s.[xi] Children are also most likely to be in ”deep poverty,” with household income at least 50 percent below the poverty threshold, according to the OPM: 6.2 percent of children compared with 4.5 percent for non-elderly adults and 3.7 percent for elderly adults.[xii] Children make up around 22 percent of the total U.S. population, though they represent 31 percent of all Americans living in poverty.[xiii] This discrepancy is because children in poverty are more likely to be part of a large family, and while poverty thresholds increase to account (at least partially) for the additional expense of each additional child, income often does not increase at the same rate, increasing the likelihood of poverty as family size grows.[xiv] Thus, there may be only one or two adults in poverty in a given household, but three or more children.
Under the SPM, there is less variation in poverty rates between age groups, relative to the OPM, and the elderly have a marginally higher poverty rate (12.8 percent) than the young (12.5 percent).[xv] In fact, among the three age groups, only children are less likely to be considered impoverished under the SPM than the OPM.[xvi]
A study from the Social Security Administration found that many children were classified as poor under only one of these measures: 3.4 percent of children were counted as non-poor under the OPM but in poverty under the SPM, whereas 7.4 percent of children were counted as poor under the OPM but not the SPM.[xvii] There are several reasons for this discrepancy, including differences in household definitions, but the primary reason is the inclusion of benefits that are more likely to benefit children than adults or are dependent on (or increase in) the presence of a child and are not captured by the OPM (whereas the benefits most often received by the elderly, such as pensions and Social Security, are included in the OPM). Refundable tax credits (the Earned Income Tax Credit and the Child Tax Credit) are the largest factor in reducing the number of children considered poor under the SPM.[xviii] The SPM also therefore counts nearly 50 percent fewer children in deep poverty, with the rate falling from 6.2 to 3.4 percent.[xix], [xx]
The age of the parent also has implications for a child’s poverty risk: Children of younger mothers are more likely to be poor than those born to older mothers, partly because younger mothers are more likely to be unmarried and partly because younger mothers are less likely to be working full-time and tend to have lower wages.[xxi] Because non-White and Hispanic women are more likely to give birth at a younger age, age and race are co-correlated.[xxii]
Before the pandemic hit, child poverty rates were on a consistent downward trajectory, reaching historic lows for some race and ethnic groups. As of 2019, using the OPM, 21 percent of Hispanic children were considered in poverty along with 26 percent of Black children.[xxiii] These groups were three times more likely to be impoverished than Asian (7 percent) or White, non-Hispanic children (8 percent).[xxiv]
Among children living with related family members, 14.1 percent of children under 18 and 5.5 percent of children under age 6 were considered poor under the OPM, compared with 29.9 percent of children not living with relatives.[xxv]
Following the same patterns as the overall population, children in female-headed households were most likely to be considered poor (36.5 percent) under the OPM compared with 16.3 percent in male-headed households and just 6.4 percent in households of married couples.[xxvi] Among children under age 6, nearly half (46.5 percent) were impoverished in female-headed households compared with just 18.4 percent in male-headed households.[xxvii]
As of 2019, there was no statistical difference between the poverty rates of the Northeast, Midwest, and West (ranging from 9.4-9.7 percent), under the OPM.[xxviii] The South, however, had the highest poverty rate at 12 percent. Those living outside metro areas as well as those in principal cities had roughly the same poverty rate (13.1 and 13.3 percent, respectively), whereas those living in the suburbs had a poverty rate nearly 40 percent lower.[xxix] The map below shows child poverty rates by school district. The states with the highest official child poverty rates in 2019 included Mississippi (27.6 percent), Louisiana (26.4 percent), New Mexico (23.5 percent), Alabama (21.9 percent), and Arkansas (21.7 percent).[xxx] The states with the lowest child poverty rates were: New Hampshire (8.1 precent), Utah (9.6 percent), Vermont (10.8 percent), North Dakota (10.9 percent), and Minnesota (11.0 percent).[xxxi]
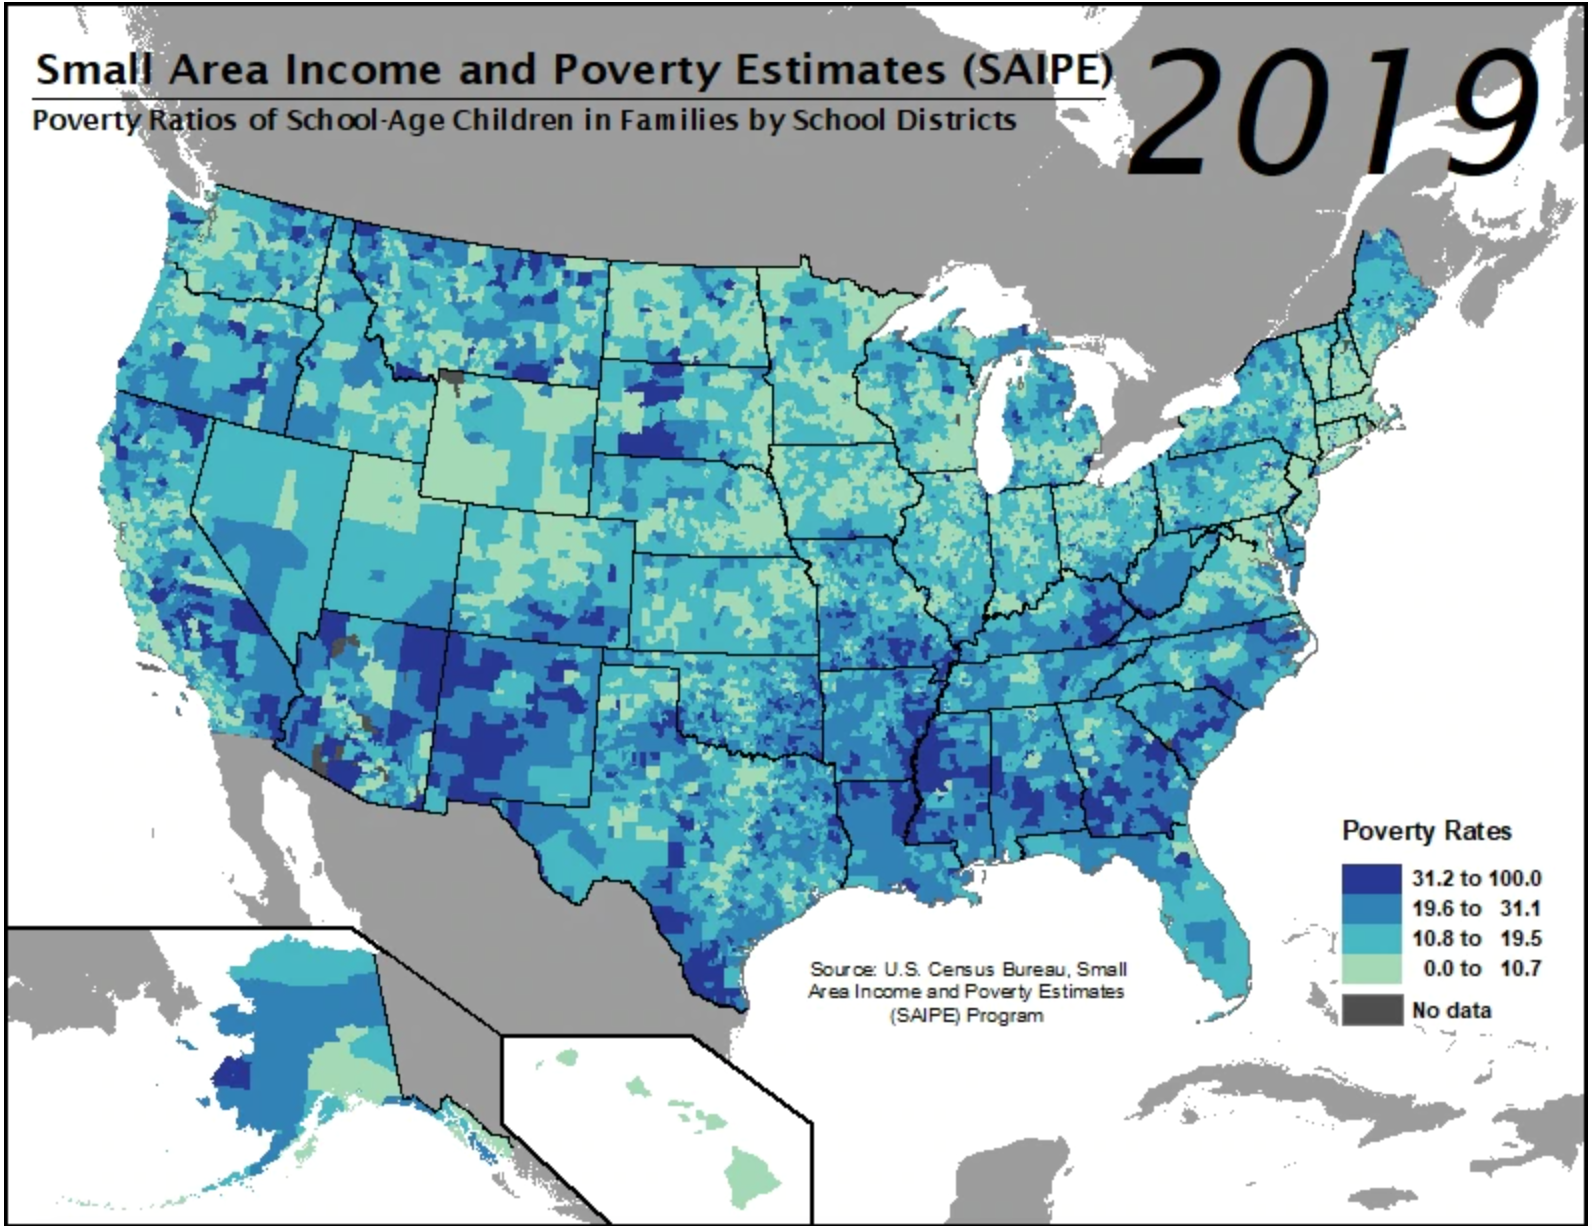
Source: https://www.census.gov/data-tools/demo/saipe_childhood/index.html
Regional poverty rates under the SPM vary from the OPM, however, because the SPM accounts for differences in the cost of housing across the country. Consequently, the variations between the two metrics are greatest in the Northeast and West where housing costs are often the highest, as shown in the chart above.[xxxii]
Finally, the government’s two poverty metrics do not consider children and households in the same way; some children are not counted in the OPM because of their non-traditional family status (foster children or children living with non-related individuals, for example), but they are counted under the SPM. In fact, according to the U.S. Census, less than 20 percent of American families fit the traditional definition of a nuclear family consisting of two married parents and their minor children, leaving many children excluded from the official poverty counts.[xxxiii] Some of these children likely would be included among the poor, while others not. Research has shown foster children to be at lower risk of poverty than the average child because of the value of foster payments paid by the state.[xxxiv] Homeless children, on the other hand, are very likely to be poor, but they are not included in either the OPM or SPM.[xxxv] It is estimated there are 2.5 million homeless children in the United States.[xxxvi]
Conclusion
The OPM and SPM provide varying rates of poverty because of the different considerations that are made under each method. For most characteristics, the poverty rate tends to be higher under the SPM, with children being a notable exception, largely because of the SPM’s inclusion of tax credits and benefit programs that are more likely to be provided to households with children. Despite the methodological differences, both metrics show that employment status, educational attainment, and marital status are the best predictors for determining someone’s risk of being impoverished: Earning a college degree, working full-time, and being married before having children provide the greatest promise for escaping poverty.
[i] https://www.americanprogress.org/issues/economy/reports/2021/02/23/495784/expanded-child-tax-credit-lift-millions-children-poverty/
[ii] https://www.census.gov/library/publications/2020/demo/p60-270.html
[iii] https://www.census.gov/library/publications/2020/demo/p60-272.html
[iv] https://www.census.gov/library/publications/2020/demo/p60-272.html
[v] https://ideas.repec.org/p/nbr/nberwo/15181.html
[vi] https://www.census.gov/library/publications/2020/demo/p60-272.html
[vii] https://www.americanactionforum.org/project/economic-benefits-educational-attainment/
[viii] https://www.bls.gov/news.release/famee.t05.htm
[ix] https://www.bls.gov/news.release/famee.t05.htm
[x] https://educationdata.org/education-attainment-statistics
[xi] https://www.census.gov/library/publications/2020/demo/p60-270.html
[xii] https://www2.census.gov/programs-surveys/demo/tables/p60/270/tableB-6.xls
[xiii] https://www.pewresearch.org/fact-tank/2020/11/30/prior-to-covid-19-child-poverty-rates-had-reached-record-lows-in-u-s/
[xiv] https://fas.org/sgp/crs/misc/R46294.pdf
[xv] https://www.census.gov/library/publications/2020/demo/p60-272.html
[xvi] https://www.census.gov/library/publications/2020/demo/p60-272.html
[xvii] https://www.ssa.gov/policy/docs/ssb/v75n3/v75n3p55.html
[xviii] https://www.census.gov/library/publications/2020/demo/p60-272.html
[xix] https://www.census.gov/library/publications/2020/demo/p60-272.html
[xx] https://www.irp.wisc.edu/wp/wp-content/uploads/2019/09/Focus-35-2b.pdf
[xxi] https://www.brookings.edu/testimonies/non-marital-births-and-child-poverty-in-the-united-states/, https://link.springer.com/article/10.1007/s10826-019-01616-0, https://taxfoundation.org/average-income-age/
[xxii] https://www.irp.wisc.edu/wp/wp-content/uploads/2019/09/Focus-35-2b.pdf
[xxiii] https://www2.census.gov/programs-surveys/demo/tables/p60/270/tableB-6.xls
[xxiv] https://www2.census.gov/programs-surveys/demo/tables/p60/270/tableB-6.xls
[xxv] https://www.census.gov/library/publications/2020/demo/p60-270.html
[xxvi] https://www.census.gov/library/publications/2020/demo/p60-270.html
[xxvii] https://www.census.gov/library/publications/2020/demo/p60-270.html
[xxviii] https://www.census.gov/library/publications/2020/demo/p60-270.html
[xxix] https://www.census.gov/library/publications/2020/demo/p60-270.html
[xxx] https://www2.census.gov/programs-surveys/saipe/datasets/2019/2019-state-and-county/est19us.xls
[xxxi] https://www2.census.gov/programs-surveys/saipe/datasets/2019/2019-state-and-county/est19us.xls
[xxxii] https://www.nar.realtor/research-and-statistics/housing-statistics/county-median-home-prices-and-monthly-mortgage-payment
[xxxiii] https://www.americanprogress.org/issues/lgbtq-rights/reports/2016/12/01/292886/making-paid-leave-work-for-every-family/
[xxxiv] https://www.ncbi.nlm.nih.gov/pmc/articles/PMC5484162/
[xxxv] https://www.everycrsreport.com/reports/R45031.html
[xxxvi] https://www.air.org/center/national-center-family-homelessness