Research
March 10, 2022
Assessing Americans’ Diets
Executive Summary
- Americans’ diets are quite poor when measured against official nutritional guidelines.
- Those with the worst diets and those with the best diets have similar diet patterns in terms of which foods they are likely to consume most and least.
- Those who tend to be least likely to meet nutritional guidelines are also those who are most likely to be food insecure.
- The foods Americans struggle with most in meeting recommended intake levels are whole grains and fatty acids, which are under-consumed, and sodium and saturated fats, which are over-consumed.
- Targeted efforts to improve nutrition among low-income children, young adults (particularly young men), and non-Hispanic Blacks are likely to have the largest effect; thus, a focus on improving the Supplemental Nutrition Assistance Program (SNAP) may be warranted.
Introduction
Long story short, Americans generally do not eat well, and this unfortunate truth has persisted for decades.[i] The U.S. government surveys Americans’ diets and assesses their quality, relative to the government’s dietary guidelines.[ii] This paper further analyzes food consumption among various subpopulations to better understand the causes of poor nutrition. This understanding can help in the development and reform of policies to improve Americans’ diets. For example, research from the American Action Forum (AAF) showed the connection between agricultural subsidies and the American food supply and consumption. Recent AAF research also highlighted the dramatic economic impact of nutrition-related chronic disease, finding it cost the United States an estimated $16 trillion from 2011-2020.
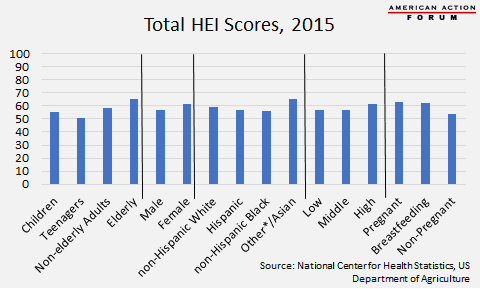
Not all Americans eat equally poorly, however, and not everyone eats equally poorly throughout their lives. The groups with the best nutrition scores as of 2015 are the elderly, females, Asians, and high-income individuals.[iii] Those with the lowest scores are children (particularly teenagers), males, non-Hispanic Blacks, and low- and middle-income individuals. Unsurprisingly, those least likely to meet nutritional recommendations are largely the same groups most likely to be food insecure and to participate in the Supplemental Nutrition Assistance Program (SNAP). Scores across all subgroups range from 51 to 66, out of 100. While these outcomes suggest that most Americans could benefit from improved nutrition, targeted efforts to low-income children, young adults (particularly young men), and non-Hispanic Blacks are likely to have the largest potential effect.
The data also show some consistency regarding which foods Americans generally struggle to consume in recommended amounts (listed in order of farthest from recommendation): whole grains, sodium, fatty acids, saturated fats, and dairy. Americans are most likely to meet the protein guidelines, including protein from plants and seafood, and generally do a good job of consuming enough whole fruits, although overall fruit consumption should be increased. Most Americans would also benefit from greater vegetable consumption, particularly greens and beans.
As the government has a limited ability to change Americans’ eating habits, it may wish to focus on ensuring existing government nutrition programs better meet their mission. SNAP is an example of one such program that could use improvement in this regard and would benefit those most in need.
Healthy-Eating Index
To assess Americans’ diets, consumption quantities across various food groups are measured and scored based on the Healthy Eating Index (HEI), with a maximum score of 100 for those perfectly following dietary guidelines. For years, the average score has been in the 50s.[iv] Survey responses are broken down by age, gender, race, income, and for women, pregnancy or breastfeeding status; total scores for each group are shown below.
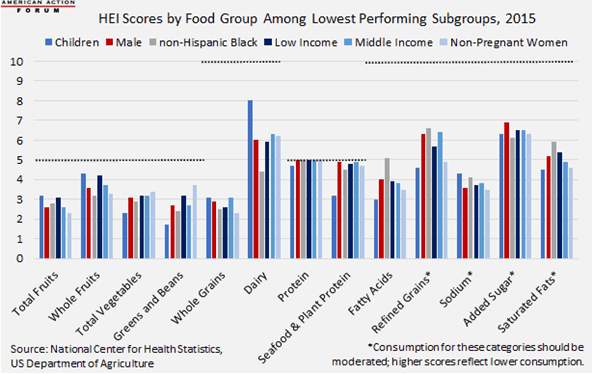
The next chart shows the HEI scores for each food group among the lowest-performing subpopulations, along with the total maximum score for each food. Of note, those with the highest HEI scores in each demographic subgroup fall into the exact same pattern in terms of which food groups people are most and least likely to meet the official recommendations. In other words, whether you eat relatively well or relatively poorly, your nutritional struggles are generally the same. Everyone needs to eat more whole grains and fatty acids and less sodium and saturated fats. Surprisingly, for as much attention as is given to added sugars, sugar intake is not as problematic as other foods for most people.
Age
Within demographic categories, the most noticeable differences are seen between children and the elderly, with scores generally improving with age.[v] In fact, across all categories, the elderly have the highest overall diet score while children have the lowest.
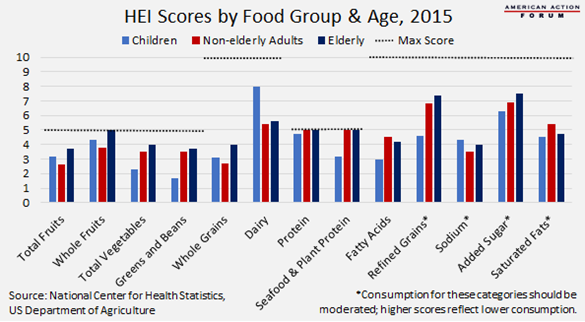
As shown by the chart above, children are much less likely to eat vegetables (but eat a decent amount of fruit), consume much less protein from seafood and plants than adults (which is somewhat explained by the vegetable consumption and may explain their significantly lower consumption of fatty acids), and don’t eat near enough whole grains (although, that is not unique to children). Children also do the worst job of limiting the foods that should be eaten in moderation. Kids do consume much more dairy than other age groups but still fall somewhat short of the recommendation.
Nevertheless, younger children have a better-quality diet than teenagers, who have the worst diet quality of any age group.[vi] This is presumably a factor of parental control over a child’s diet which tends to decrease as children consume more food outside of the home.
While children’s diets have improved significantly over the past two decades, more than half of the nation’s youth are considered to have a poor diet. The biggest changes in children’s diets have been greater consumption of whole fruits and grains, and fewer added sugars and sugar-sweetened beverages.
Race
Stark differences in diet also exist among racial groups, with Asians—scoring roughly as well as the elderly—being much more likely to meet recommendations than other races and non-Hispanic Blacks being much less likely to meet recommendations, outscoring only children and nonpregnant women across all subgroups.[vii] Of course, as with most things, these tendencies are not true across all categories. Asians fall behind in their dairy consumption and eat too many refined grains and far too much sodium. Blacks score relatively well in the fatty acids and refined grains categories, though in no category do they score significantly better than any other racial group.

Income
Generally, having higher income is associated with better nutrition. Some easy explanations include a better ability to afford nutritious food, greater likelihood of easy access to healthy food (such as proximity to grocery stores and farmers markets), more time to cook rather than relying on processed foods which tend to be nutritionally deficient, and—given the link between income and education—a greater likelihood of understanding the importance of good nutrition. Compared with age and race, however, income does not seem to be as influential on the quality of people’s diets. Income does influence how often people eat and where they get their food, though, which has some impact on nutrition.
As with food insecurity, stark differences are seen across income groups in the likelihood of eating three full meals in a day, with only 50 percent of those making 130 percent of the federal poverty level (FPL) or less eating breakfast, lunch, and dinner, compared with 71 percent of those earning 350 percent or more of FPL.[viii] Of note, the difference in the likelihood of eating three meals among children of various income groups is minimal, but increases with age, suggesting that the Supplemental Nutrition Program for Women, Infants, and Children (WIC) (available to children up to age 5) and school meal programs (which have better participation rates among younger children) help significantly to close nutritional gaps.
This may not, however, be universal across nutrition assistance programs. A recent study found Supplemental Nutrition Assistance Program (SNAP) participants have consistently had poorer diets than non-SNAP participants even when compared to individuals who are income-eligible for but not participating in SNAP.[ix] Further, diet quality generally did not show statistically significant improvement for SNAP participants over time (2003-2014) despite improvements among non-SNAP participants.[x] While the authors struggled to understand the reason for this (aside from greater consumption of sugar-sweetened beverages among SNAP participants), this research further indicates that income may have a more limited effect on nutrition and diet quality than many generally assume.
Geography
Where people live certainly impacts the availability of certain foods, at least to a degree, which impacts what people eat. One noticeable impact is the consumption of fruits and vegetables which varies widely across states. Residents of the West Coast, Northeast, Colorado, and Florida are most likely to consume the recommended amount of fruits and vegetables.[xi] Unsurprisingly, the states with the highest share of residents meeting the fruit recommendation are also most likely to have the highest share of residents meeting the vegetable recommendation, and these states are generally the ones producing the most fruits and vegetables.[xii]
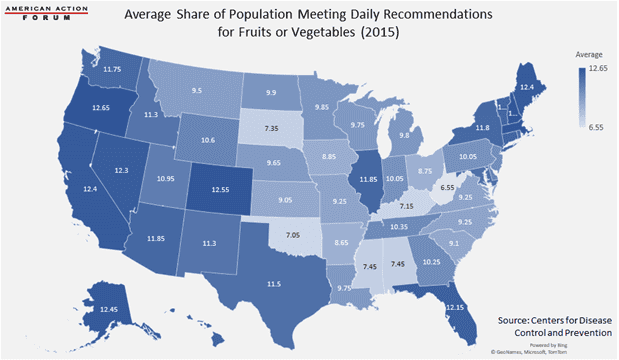
States in the Southeast and Midwest have the lowest shares of their populations meeting fruit and vegetable guidelines.[xiii] Despite having the country’s highest concentration of farms, these states tend to grow corn, grains, cotton, and soybeans.[xiv] Alaska is a surprising outlier with a relatively high share (12.5 percent) of its population meeting such recommendations despite having the lowest agricultural sales in the country.[xv]
Food Source
Where people get their food also influences its nutritional quality, and food source is somewhat related to income and age.
More than one-third of American adults consume fast food on any given day, though consumption decreases with age: 45 percent of 20-39 year-olds eat fast food, compared with 24 percent of people 60 and older.[xvi] Children from lower-income families (earning less than $25,000 per year) consume more calories from fast food restaurants than other age or income groups.[xvii] Across races, Blacks are most likely to eat fast food (42 percent) while Asians are the least likely (31 percent). This is likely tied to the higher concentration of fast food restaurants per capita in predominantly Black neighborhoods.[xviii]
One fact that may be surprising to some is that fast food consumption among adults was found to increase with income. Given that lunch is the most common fast food meal, the correlation between income and fast food consumption may be that higher income individuals are more likely to buy fast food for lunch while working, whereas lower income individuals may be more likely to bring food from home. While traditional fast food has long been known for its cheap price, fast food has changed substantially over the past decade. In recent years, cities have seen a rise of higher-priced healthier quick service restaurants, expanding fast food options beyond typical burger, chicken, and French fry establishments to places offering, for example, custom entrée salads, poke bowls, smoothies, Mediterranean, and specialty sandwiches.[xix]
Adults with household income of $75,000 or more also consume roughly twice as many calories from full-service restaurants as those with income less than $25,000.[xx]
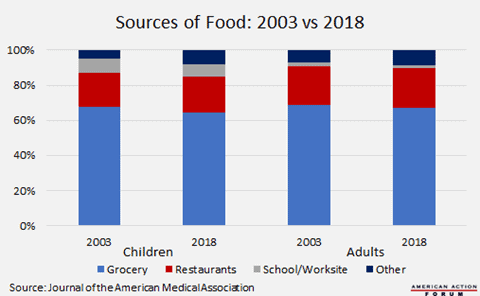
A recent study assessed food intake and quality from grocery stores, restaurants, and schools and worksites from 2003-2018.[xxi] Over the period studied, Americans consumed slightly less food from grocery stores and worksites; a steady share of food from restaurants and schools; and more food from other sources (including food obtained from someone else, at an entertainment facility or sports stadium, or from a food truck). The quality of food consumed from each of these sources improved at least slightly over the study period, except for food from other sources which declined slightly. The improved quality of the food from schools resulted in the share of children consuming poor quality food at school to fall by over half, from 55.6 percent to 24.4 percent.

Despite a slight improvement, the overall nutritional quality of food consumed at restaurants remains low, and the overconsumption of sodium may be linked to eating at restaurants.[xxii] Food from restaurants contains more sodium than food consumed from grocery stores and cooked at home, though most people do not realize it.[xxiii] Over the past 30 years, portion sizes from 10 popular fast food restaurants significantly increased along with calories and sodium.[xxiv] With Americans eating more food away from home, the overconsumption of salt is likely to continue, but there may be good news.
According to the Bureau of Labor Statistics’ annual Time Use Survey, more Americans are spending time preparing food and spending more time doing so than compared with a decade ago: the overall 17.5 percent increase in time spent preparing food occurred in all subgroups studied except adults aged 18-24.[xxv] Americans are also spending more time grocery shopping.[xxvi] These datapoints indicate that Americans are cooking more, though it is hard to reconcile with the above data that less food is being consumed from grocery stores.
Finally, a significant amount of research has focused on food deserts as a possible explanation for poor diet quality, but it seems this may not be as strong a predictor as originally thought. In 2019, 14 percent of census tracts were classified as low-income and low access to a wide variety of food choices; this is a decrease of 7 percent from 2015 and primarily the result of improved access (rather than higher income).[xxvii] This improved access may have limited impact, however, on an individual’s nutritional quality. Further research found that “access to a nearby supermarket explained no more than 1.5 percent of the difference in the healthfulness of grocery purchases between high- and low-income households.”[xxviii] Instead, researchers estimate that 90 percent of nutritional inequality between high- and low-income households results from differences in demand for healthy foods which they link to potential differences in education and nutrition knowledge.[xxix] Other research has found similar results: Just 10 percent of the dietary gap is attributed to differences in food access.[xxx]
Conclusion
It likely comes as little surprise that Americans generally have poor diets, but some Americans struggle to meet their nutritional needs more than others. Given the economic and societal costs of poor nutrition, it is in the public’s interest to combat this failure. Understanding who is most in need of improving their diets and which foods cause the most trouble is important for understanding how and where to target interventions.
The data indicate that children (particularly teenagers) and young adults, Blacks, and low- and middle-income households could benefit most from improving their diets. These demographic groups tend to also be more likely to be food insecure and to participate in SNAP. While SNAP purports to be a nutrition-focused program, the evidence finds that SNAP participants have worse nutrition than similarly situated non-participants. As the government has a limited ability to change Americans’ eating habits, it may wish to focus on existing government nutrition programs to better ensure they are meeting their mission. SNAP is an example of one such program that could use improvement in this regard and would benefit those most in need.
As for which foods at-risk populations need to consume more and which to consume less, they are the same foods that all Americans generally need to consume more or less: more whole grains and fatty acids and less sodium and saturated fats. Most Americans would also benefit from greater consumption of fruits, vegetables, and dairy. Because of the consistency of nutritional deficiencies across subpopulations, interventions targeted at populations most in need have the potential to improve the die
[i] https://www.fns.usda.gov/cnpp/healthy-eating-index-hei-reports
[ii] https://www.fns.usda.gov/healthy-eating-index-hei
[iii] https://www.fns.usda.gov/healthy-eating-index-hei
[iv] https://www.fns.usda.gov/hei-scores-americans
[v] https://www.childstats.gov/americaschildren/tables/health6.asp
[vi] https://www.childstats.gov/americaschildren/health6.asp
[vii] https://fns-prod.azureedge.net/sites/default/files/media/file/FinalE_Draft_HEI_web_table_by_Race_Ethnicity_jf_citation_rev.pdf
[viii] https://www.ars.usda.gov/ARSUserFiles/80400530/pdf/1718/Table_36_DMP_POV_17.pdf
[ix] https://pubmed.ncbi.nlm.nih.gov/30498812/
[x] https://jamanetwork.com/journals/jamanetworkopen/fullarticle/2684625
[xi] https://www.ers.usda.gov/faqs/, https://www.cdc.gov/mmwr/volumes/66/wr/mm6645a1.htm?s_cid=mm6645a1_w
[xii] https://www.nass.usda.gov/Publications/AgCensus/2017/Online_Resources/Ag_Atlas_Maps/17-M221.php, https://www.ers.usda.gov/amber-waves/2011/june/on-the-map/
[xiii] https://www.nass.usda.gov/Publications/AgCensus/2017/Online_Resources/Ag_Atlas_Maps/17-M207.php
[xiv] https://ipad.fas.usda.gov/rssiws/al/us_cropprod.aspx
[xv] https://beef2live.com/story-states-produce-food-value-0-107252
[xvi] https://www.cdc.gov/nchs/products/databriefs/db322.htm
[xvii] https://www.ars.usda.gov/ARSUserFiles/80400530/pdf/1718/Table_51_QSR_INC_17.pdf
[xviii] https://www.ncbi.nlm.nih.gov/pmc/articles/PMC4783380/
[xix] https://www.prnewswire.com/news-releases/increased-focus-on-healthy-offerings-helps-reshape-the-fast-food-industry-301155461.html, https://www.businessinsider.com/future-of-fast-food-healthy-affordable-2017-11
[xx] https://www.ars.usda.gov/ARSUserFiles/80400530/pdf/1718/Table_47_FSR_INC_17.pdf
[xxi] https://jamanetwork.com/journals/jamanetworkopen/fullarticle/2778453
[xxii] https://nutrition.org/quality-of-meals-at-full-service-and-fast-food-restaurants-has-anything-changed/
[xxiii] https://www.ncbi.nlm.nih.gov/pmc/articles/PMC6347977/
[xxiv] https://pubmed.ncbi.nlm.nih.gov/30826304/
[xxv] https://www.ers.usda.gov/amber-waves/2020/april/more-americans-spend-more-time-in-food-related-activities-than-a-decade-ago/
[xxvi] https://www.ers.usda.gov/amber-waves/2020/april/more-americans-spend-more-time-in-food-related-activities-than-a-decade-ago/
[xxvii] https://www.ers.usda.gov/amber-waves/2021/june/updated-food-access-research-atlas-now-maps-changes-in-low-income-and-low-supermarket-access-areas-in-2019/
[xxviii] https://www.ers.usda.gov/amber-waves/2020/september/differences-in-the-local-food-environment-are-not-the-main-cause-of-nutritional-inequality/
[xxix] https://www.ers.usda.gov/amber-waves/2020/september/differences-in-the-local-food-environment-are-not-the-main-cause-of-nutritional-inequality/
[xxx] https://www.npr.org/2021/11/30/1060073647/a-glimpse-at-how-the-other-half-eats