Research
April 2, 2020
Insulin Cost and Pricing Trends
Executive Summary
- Diabetes cost the United States $327 billion in 2017, becoming the most expensive chronic disease in the nation.
- Insulin costs, before accounting for any rebates or discounts, comprise an estimated $48 billion (20 percent) of the direct costs of treating diabetes; after rebates, insulin accounts for 6.3 percent of costs.
- The average list price of insulin increased 11 percent annually from 2001 to 2018, with average annual per capita insulin costs now nearing $6,000. Because patients’ out-of-pocket costs are typically based on list price, their expenses have risen substantially despite the decrease in net price for many of the most commonly used insulin products over the past several years.
- If the trends of the past decade continue, gross insulin costs in the United States could reach $121.2 billion in total spending (or $12,446 per insulin patient) by 2024, but if more recent trends of much slower price growth prevail, insulin spending could total $60.7 billion in 2024 (or $6,263 per patient).
The Rising Cost of Diabetes
Diabetes is now the most expensive chronic condition in the United States.[1] One in every four U.S. health care dollars is spent on someone with diabetes, and one in seven dollars is spent directly on diabetes-related expenses.[2] The economic cost of diabetes in the United States totaled $327 billion in 2017, including $237 billion for direct medical costs and $90 billion in lost productivity.[3] The 2017 total represents an average annual increase of 6 percent from the 2012 estimated cost of $245 billion.[4]
The rising costs of diabetes largely tracks the dramatic increase in the cost of prescription insulin—which an estimated 8.3 million individuals use to control their condition. Between 2012 and 2018, the price of available insulin increased 14 percent annually, on average, and in 2016 insulin accounted for 31 percent of a Type 1 diabetic’s health care costs, up from 23 percent in 2012.[5] The rising cost of insulin has an impact on both patients and society as a whole. One fourth of diabetic patients, no longer able to afford their prescribed treatment plans, ration their supply, which can be dangerous and potentially fatal.[6] And nearly three-fifths (57 percent) of individuals with diagnosed diabetes are insured through a public program, such as Medicare, Medicaid, or the Children’s Health Insurance Program (CHIP), and these programs cover a disproportionate share (66 percent) of the costs of diabetes.[7] In other words, taxpayers end up footing most of the bill for diabetes treatments.
Given the rising costs, it is worth understanding what is driving these increases. This analysis first details increases in insulin prices and offers a projection for how much insulin will cost in the coming years. It then examines what is driving these increases.
The Price of Insulin
Past Price Growth
Since 1991, growth in insulin prices has been accelerating, with a reprieve only in recent years. The list price of insulin per milliliter in the United States increased, on average, 2.9 percent annually from 1991-2001, 9.5 percent per year from 2002 and 2012, 20.7 percent annually between 2012 and 2016, and 1.5 percent per year from 2016-2018.[8] .[9]
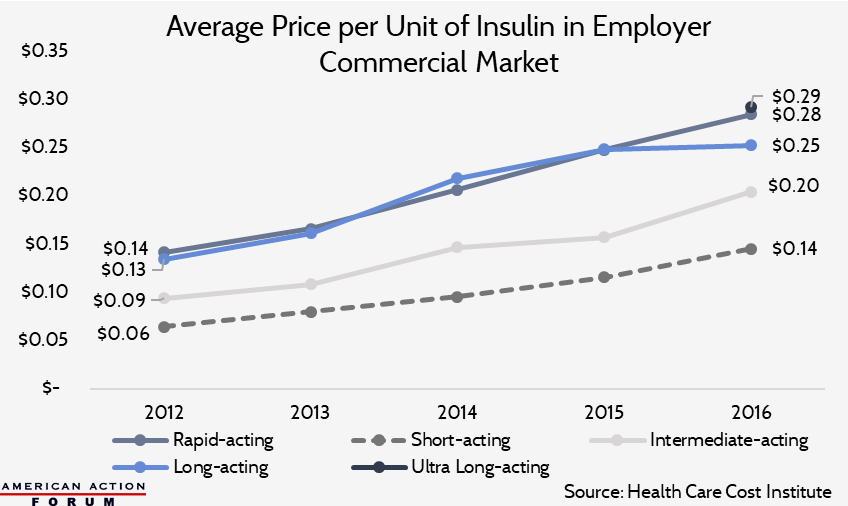
As the chart below shows, however, these increases are driven not simply by price hikes for existing products, but by higher prices for new products. Newer insulin products are more expensive than older products. Since rapid-acting and long-/ultra-long-acting insulins are now the most commonly used insulins, the rising cost of these medicines is contributing significantly to rising average insulin costs per patient and overall insulin spending.
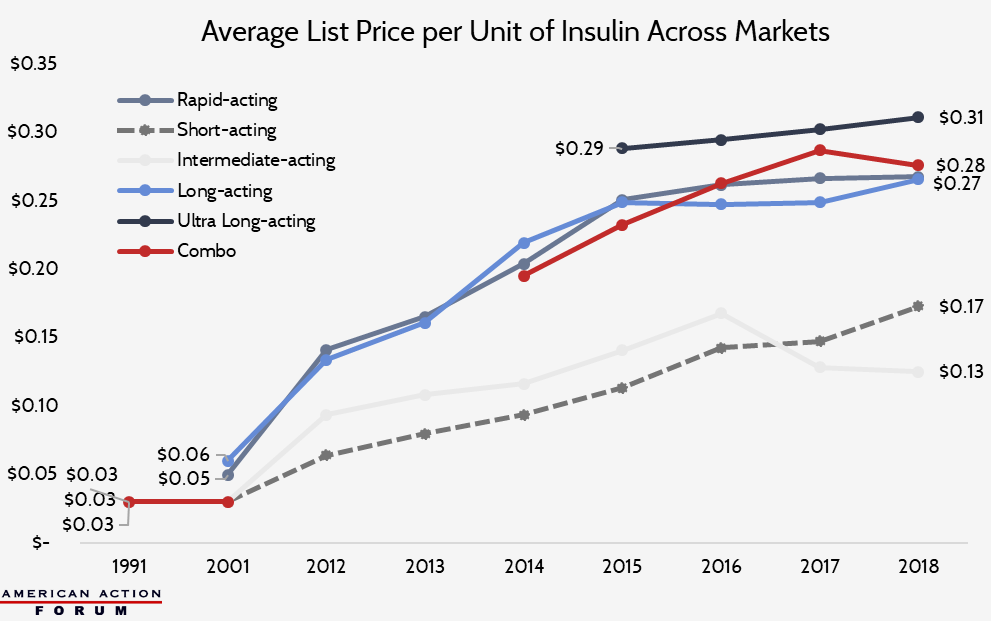
The prices detailed above are list prices—and the discrepancy between list prices and net prices due to rebates is likely partially responsible for high insulin prices, as detailed below.
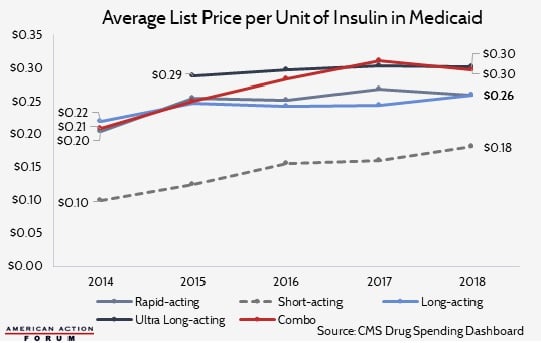
Insulin Spending in Medicaid
Examining Medicaid reimbursement for insulin provides a useful window into market prices for insulin, as Medicaid, by law, receives the “best price” in the nation for all outpatient drugs. Medicaid reimbursements for insulin have increased dramatically over the past decade. The chart below shows the growth in the Medicaid reimbursement rate per milliliter (which typically contains 100 units) of the various types of insulin. While the cost growth from 1991 to 2001 is noticeable, the increases from 2001 to 2014 were more rapid, increasing an average of 9.1 percent annually primarily due to the introduction of new insulin products.[10] These price increases have resulted in Medicaid spending on insulin reaching $3.9 billion in 2018.[11]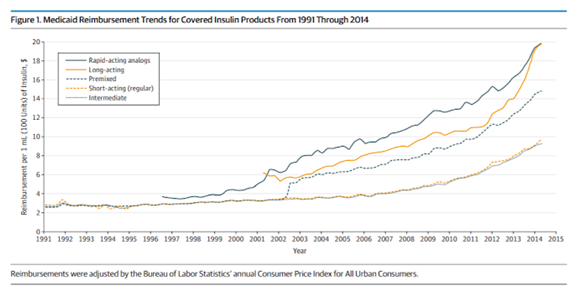
Source: American Medical Association [12]
Insulin Spending in Medicare Part D
Medicare spending on insulin has also increased exponentially over the past decade. Total Part D spending on insulin increased 10-fold from $1.4 billion in 2007 to $14.4 billion in 2018, more than 10 times faster than enrollment.[13], [14] The top five insulin products in 2018 (in terms of use and total spending) accounted for $8.1 billion (56 percent) of all Part D insulin spending.[15] Spending per person increased 18 percent annually, from nearly $900 in 2007 to roughly $4,000 in 2016, and beneficiaries’ average out-of-pocket (OOP) costs during this time increased 17 percent annually.[16]
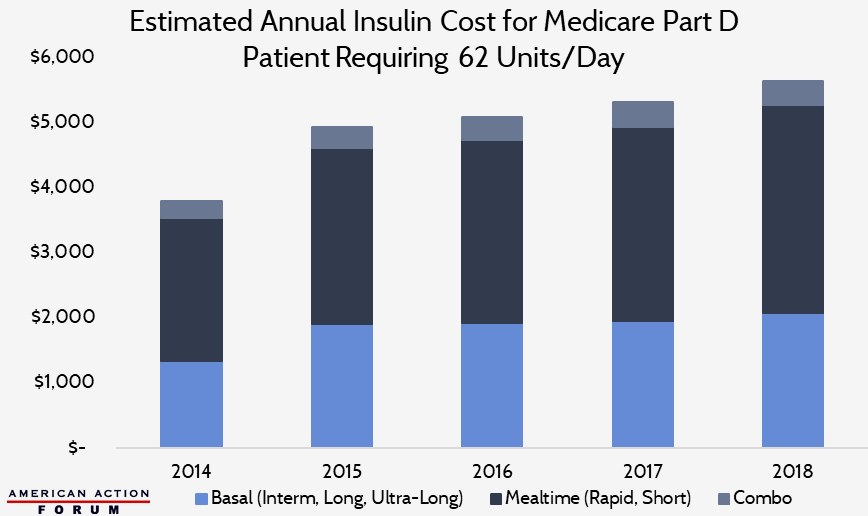
Typical Insulin Spending per Patient
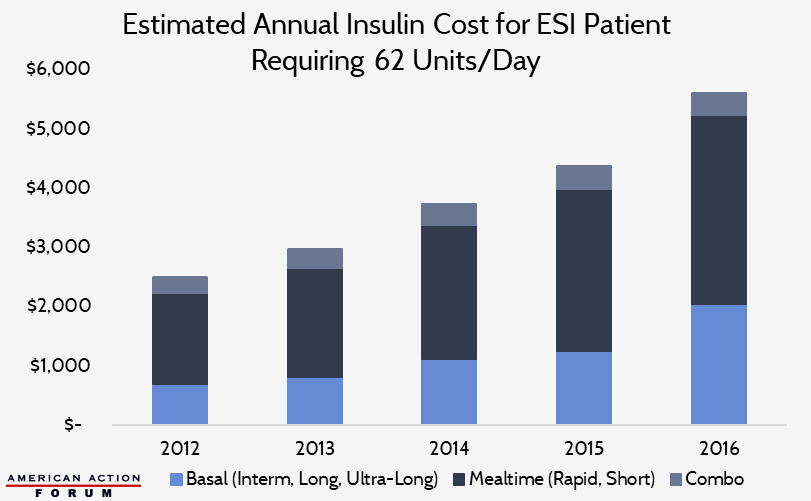
According to the Health Care Cost Institute, the average insulin user with employer-sponsored insurance (ESI) uses 62 units per day (approximately 22 basal units, 36 mealtime units, and 4 units of combination insulin).[17] The following chart shows the estimated average annual insulin cost for a Medicare Part D patient taking a similar dosage, based on pricing and spending data from the Centers for Medicare and Medicaid Services’ Part D Drug Spending Dashboard.[18] Per capita insulin costs in Medicare Part D, Medicaid, and ESI are all broadly similar and are estimated to have surpassed $5,600 in 2018, as shown in the Appendix.
The Appendix further details spending and cost information for Medicaid, Medicare Part D, and patients with ESI.
Estimating Future Costs
With more than 8 million Americans estimated to be using insulin today at a cost of nearly $6,000 annually per person, insulin costs (before rebates) account for roughly $48 billion (20 percent) of the direct medical costs of diabetics.[19] If the share of diabetics requiring insulin remains steady at 24 percent and 1.5 million Americans continue to be diagnosed each year, gross insulin costs would increase more than $2 billion annually if insulin prices and per capita utilization did not change. If insulin list prices continued to increase at a rate similar to the trend between 2012 and 2018, gross insulin costs in the United States could reach $121.2 billion by 2024 (or $12,446 per insulin user), before subtracting discounts and rebates. If prices continue to increase at the slower rate seen between 2016 and 2018, gross insulin costs would increase to just $60.7 billion in 2024 (or $6,263 per patient).
Why Are Prices Increasing?
A number of factors likely contribute to rising insulin prices, but one of the largest is the existence of large rebates.
Rebates
The current practice of manufacturers offering large rebates likely contributes to both increasing insulin prices and the limited uptake of lower-priced products.[20] Pharmacy-benefit managers (PBMs) are responsible for maintaining insurers’ drug formularies, or list of prescriptions that are covered by a given insurance plan, and they generate significant revenue through rebates on brand-name drugs from manufacturers.[21] PBMs incentivize drug manufacturers to offer competitively high rebates so their specific products are included on formularies and given preferential placement.[22] Hence, competition among drug manufacturers for top-tier allocation of their products has driven ever-larger rebates, which naturally leads to higher list prices.[23]
While list prices are increasing significantly, net prices (list prices minus rebates and other discounts) received by manufacturers have increased much less drastically.[24] For example, Novo Nordisk reported that between 2001 and 2016, the list price of the NovoLog vial increased 353 percent while the net price increased just 36 percent.[25] The NovoLog FlexPen list price increased 270 percent between 2003 and 2016, while its net price only increased 3 percent.[26] Eli Lilly released similar information showing the list price of Humalog increased 27 percent from 2015 to 2019, while the net price decreased 14 percent.[27] Sanofi’s latest pricing report shows that since 2012, the average list price for all its insulin products increased 126 percent by 2018, while the average net price has decreased 25 percent.[28]
Based on the data provided by these manufacturers, as well as data from Pharmaceutical Care Management Association (PCMA), insulin rebates average between 30 and 50 percent, and often reach as high as 70 percent for the most commonly used insulin products, significantly higher than the average rebate for other types of drugs.[29] For comparison, the Medicare Trustees Report shows that rebates for all drugs averaged between 18 and 22 percent in Medicare Part D from 2015 to 2017, while rebates for all products in Medicaid averaged 51 percent in 2016.[30], [31] Estimates of drug rebates in the commercial market range from 12 percent to 30 percent in 2018.[32] PCMA maintains that its analysis of rebates for insulin products indicates there is no correlation between list price growth and the size of the rebate. It remains true, however, that insulin rebates are larger, on average, than those provided for other types of drugs, according to available data.
This discrepancy between list and net price has a major impact on the amount that insurers and patients ultimately spend on insulin. According to the American Diabetes Association’s (ADA) 2017 report on the Economic Costs of Diabetes in the United States, after accounting for discounts and rebates, insulin costs account for just 6.3 percent of overall costs, ranging from 4.6 percent of costs for privately insured individuals and 7.2 percent of costs for those enrolled in public programs.[33]
Nevertheless, patients’ insulin costs, on average, are increasing. Patients’ prescription out-of-pocket (OOP) costs—increasingly calculated as a percentage of the cost (co-insurance), rather than a fixed dollar amount (co-payment)—are typically based on a medicine’s list price, rather than the net price. As list prices rise, so do patients’ OOP costs. Further, the large rebates do not benefit insulin patients directly. Insurers and PBMs use rebates primarily to reduce premiums for all enrollees, rather than reduce patients’ OOP liability. Thus, diabetic patients generally only benefit indirectly, through low premiums, from the significant rebates and discounts offered for insulin products.
The rebate structure is also likely at least partially responsible for the low utilization rates of the less expensive insulin options currently on the market. Eli Lilly attempted to offer lower-cost versions of both its pen and injection insulin products (Humalog Lispro injections in May 2019 and Humalog Kwikpens in January 2020).[34] By January 2020 (nine months after the release of the half-price Humalog injections), only 14 percent of U.S. prescriptions for Humalog were for the half-price version.[35] Pharmacists and patients claim the half-price Humalog Lispro injections are not readily available or that they are not covered by the patients’ insurance.[36] Novo Nordisk announced it would offer free, one-time insulin supply to patients in immediate need, as well as expanded affordable options such as a $99 three-pack of vials or a $99 two-pack of their brand-name insulin pens. Last, Sanofi’s Insulin Valyou Savings Program sets a fixed $99 monthly price on any combination of up to 10 insulin vials/pens, but the program is only available to uninsured patients.
If the cheaper products are purchased (for which rebates are not provided), rather than the more expensive products for which rebates are offered, insurers and PBMs may experience reduced revenue. As a result, insurers and PBMs may be unlikely to encourage patients to use the lower-cost options, perhaps by refusing coverage.
Competition Issues
Ninety-nine percent of the insulin used in the United States is produced by one of three drug manufacturers. The lack of robust competition allows insulin prices to remain high, particularly for the uninsured and those with high cost-sharing insurance plans. While the regulatory barriers hindering biosimilar insulin supply in the United States recently expired, as explained here, it is unlikely that new competition will enter the market overnight.
Regulatory Barriers
Finally, numerous legal and regulatory changes affecting the broader health care market have likely also impacted the price of medicines across the board. The Affordable Care Act (ACA) included several provisions that either reduced drug manufacturer revenues or increased the cost of selling drugs, primarily by expanding or creating new programs for which drug manufacturers must provide significant discounts. A previous American Action Forum study estimated that from 2012-2018, these policy changes cost the pharmaceutical industry roughly $140 billion.[37] Given that, it should not be surprising that the price of medicines increased during this time.
Results of Increasing Costs
Rising insulin prices can cause severe consequences for diabetics. Roughly a quarter of American diabetics reported rationing their insulin because they cannot afford the cost of their full prescribed dosage.[38] In 2018, the ADA conducted the Insulin Affordability Survey, and 39 percent of respondents indicated their insulin costs had increased from the year prior, while 27 percent said that the increasing costs of insulin had affected their insulin use or purchase in some way.[39] Of those who were affected, 26 percent noted regularly taking less than prescribed, 23 percent noted having to change to less expensive types or brands, and another 23 percent noted missing doses weekly. Additionally, 36 percent said they were forced to make the choice between insulin or other health-related services, 32 percent said they had to make the choice between insulin or transportation, and 30 percent said they had to make the choice between insulin or paying for their utilities.[40]
Conclusion
Diabetes is now the costliest chronic condition in the United States, with one fourth of health care expenditures in the United States spent on patients with diabetes. The insulin costs for the estimated 8.3 million Americans who require prescription insulin accounts for roughly 20 percent of the overall cost of treating diabetes before rebates and discounts are factored in—although after rebates are accounted for, insulin is responsible for 6.3 percent of overall costs. If current trends continue, gross annual insulin costs could reach $121.2 billion by 2024. While regulatory barriers hindering competition in the insulin market are set to expire soon, changes to current drug pricing practices are likely also needed to bring costs down.
Appendix
Insulin Costs in Medicaid
From 1991 to 2014, Medicaid reimbursements for insulin increased 17.1 percent annually from roughly $42.8 million to $1.6 billion.[41] Between 2014 and 2018, spending accelerated, averaging 24.2 percent per year for a cost of $3.9 billion in 2018. Though, as shown by the charts below, this increase was only partially a result of price increases.[42] Much of the increased spending during this period is due to rapid increases in Medicaid enrollment as a result of the ACA Medicaid expansion.
The estimated average cost per Medicaid patient using a standard dosage of insulin (22 units of basal insulin, 36 units of mealtime insulin, and 4 units of combination insulin) is depicted in the next chart, reaching $5,800 in 2018.[43]

Insulin Costs in the Employer Market
According to the Health Care Cost Institute, annual per capita insulin costs for diabetics with ESI averaged $2,864 in 2012; by 2016, average costs had climbed to $5,705.[44] The chart below shows estimated annual costs for an insulin patient in the ESI market, taking a standard dose of 62 units per day.[45]
Insulin Spending in Medicare Part D
Total Part D spending on insulin increased 10-fold from $1.4 billion in 2007 to $14.4 billion in 2018, more than 10 times faster than enrollment.[46], [47] Another $367 million was spent on insulin administration supplies (syringes, needles, pens, pumps, etc.) in 2018.[48] Spending per person increased 18 percent annually from nearly $900 in 2007 to roughly $4,000 in 2016, and beneficiaries’ average OOP costs during this time increased 17 percent annually.[49] The average price per dosage unit increased 10.1 percent per year from 2014 to 2018.[50]
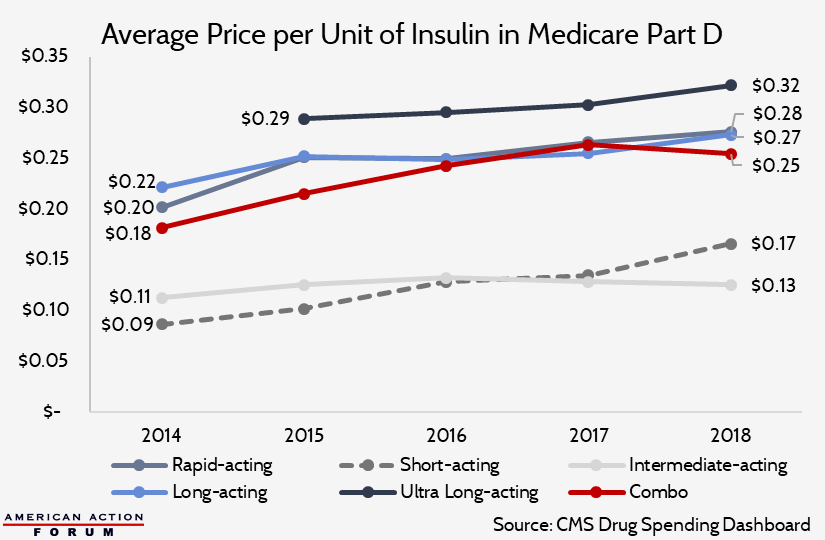
Based on these data from the Centers for Medicare and Medicaid Services’ Part D Drug Spending Dashboard, the following chart shows the estimated average annual insulin cost for a Medicare Part D patient requiring 62 units per day (22 basal units, 36 mealtime units, and 4 units of combination insulin). Per capita insulin costs in Part D surpassed $5,600 in 2018.
[1] https://connect.asmbs.org/07-2018/american-diabetes-association-report-diabetes-is-the-most-expensive-chronic-disease-in-america
[2] https://care.diabetesjournals.org/content/41/5/917
[3] https://care.diabetesjournals.org/content/41/5/917
[4] https://www.diabetes.org/resources/statistics/cost-diabetes
[5] https://healthcostinstitute.org/diabetes-and-insulin/spending-on-individuals-with-type-1-diabetes-and-the-role-of-rapidly-increasing-insulin-prices
[6] http://main.diabetes.org/dorg/PDFs/2018-insulin-affordability-survey.pdf
[7] https://care.diabetesjournals.org/content/diacare/suppl/2018/03/20/dci18-0007.DC1/DCi180007SupplementaryData.pdf
[8] http://www.natap.org/2019/HIV/ioi150073.pdf, https://www.uofmhealth.org/news/archive/201604/sugar-shock-insulin-costs-tripled-10-years-study-finds, https://healthcostinstitute.org/diabetes-and-insulin/price-of-insulin-prescription-doubled-between-2012-and-2016, https://www.cms.gov/Research-Statistics-Data-and-Systems/Statistics-Trends-and-Reports/Information-on-Prescription-Drugs
[9] https://healthcostinstitute.org/diabetes-and-insulin/spending-on-individuals-with-type-1-diabetes-and-the-role-of-rapidly-increasing-insulin-prices
[10] http://www.natap.org/2019/HIV/ioi150073.pdf
[11] Authors’ calculation based on CMS Medicaid Drug Spending Dashboard data: https://www.cms.gov/Research-Statistics-Data-and-Systems/Statistics-Trends-and-Reports/Information-on-Prescription-Drugs/Medicaid
[12] http://www.natap.org/2019/HIV/ioi150073.pdf
[13] https://www.kff.org/medicare/issue-brief/how-much-does-medicare-spend-on-insulin/
[14] 2018 estimates are authors’ calculations based on data obtained from CMS’s Medicare Part D Drug Spending Dashboard: https://www.cms.gov/Research-Statistics-Data-and-Systems/Statistics-Trends-and-Reports/Information-on-Prescription-Drugs/MedicarePartD
[15] Products include: Lantus Solostar, Levemir Flextouch, Lantus, Novolog Flexpen, and Humalog Kwikpen U-100. Authors’ calculations based on data obtained from CMS’s Medicare Part D Drug Spending Dashboard: https://www.cms.gov/Research-Statistics-Data-and-Systems/Statistics-Trends-and-Reports/Information-on-Prescription-Drugs/MedicarePartD
[16] https://www.kff.org/medicare/issue-brief/how-much-does-medicare-spend-on-insulin/
[17] https://healthcostinstitute.org/diabetes-and-insulin/spending-on-individuals-with-type-1-diabetes-and-the-role-of-rapidly-increasing-insulin-prices
[18] https://www.cms.gov/Research-Statistics-Data-and-Systems/Statistics-Trends-and-Reports/Information-on-Prescription-Drugs/MedicarePartD
[19] This estimate does not account for the value of rebates provided for insulin as that information is not publicly available and thus was not included in the study conducted by the Health Care Cost Institute or the data available on the CMS Drug Spending Dashboards which are the basis for this estimate.
[20] https://www.advisory.com/daily-briefing/2019/11/13/pbms
[21] https://www.drugchannels.net/2019/02/how-health-plans-profitand-patients.html
[22] https://www.advisory.com/daily-briefing/2019/11/13/pbms
[23] https://healthpolicy.usc.edu/research/the-association-between-drug-rebates-and-list-prices/
[24] https://care.diabetesjournals.org/content/41/6/1299
[25] https://www.novonordisk-us.com/perspectives/our_perspectives.html
[26] https://www.novonordisk-us.com/perspectives/our_perspectives.html
[27]https://assets.ctfassets.net/srys4ukjcerm/4eLJOMYz0ZOsvxx8QqmxEb/111ae072aba877601c2e0cc836ded5dc/Lilly-2019-Integrated-Summary-Report.pdf
[28] https://www.sanofi.us/-/media/Project/One-Sanofi-Web/Websites/North-America/Sanofi-US/Home/corporateresponsibility/Prescription_Medicine_Pricing_2019.pdf?sf208075846=1
[29] https://www.pcmanet.org/wp-content/uploads/2018/05/Insulins-Prices-Rebates-Costs.pdf
[30] https://www.cms.gov/Research-Statistics-Data-and-Systems/Statistics-Trends-and-Reports/ReportsTrustFunds/Downloads/TR2019.pdf
[31] https://altarum.org/sites/default/files/Altarum-Prescription-Drug-Rebate-Report_April-2018.pdf
[32] https://altarum.org/sites/default/files/Altarum-Prescription-Drug-Rebate-Report_April-2018.pdf
[33] https://care.diabetesjournals.org/content/diacare/suppl/2018/03/20/dci18-0007.DC1/DCi180007SupplementaryData.pdf
[34]https://www.reuters.com/article/us-lilly-insulin/eli-lilly-to-launch-half-priced-versions-of-two-more-insulin-products-idUSKBN1ZD1JN
[35]https://assets.ctfassets.net/srys4ukjcerm/4eLJOMYz0ZOsvxx8QqmxEb/111ae072aba877601c2e0cc836ded5dc/Lilly-2019-Integrated-Summary-Report.pdf
[36]https://www.politico.com/newsletters/prescription-pulse/2019/10/11/access-issues-drug-shortages-dictate-pharmacy-fills-in-q3-780208
[37] https://www.americanactionforum.org/insight/understanding-the-policies-that-influence-the-cost-of-drugs/
[38] http://main.diabetes.org/dorg/PDFs/2018-insulin-affordability-survey.pdf
[39] http://main.diabetes.org/dorg/PDFs/2018-insulin-affordability-survey.pdf
[40] http://main.diabetes.org/dorg/PDFs/2018-insulin-affordability-survey.pdf
[41] http://www.natap.org/2019/HIV/ioi150073.pdf
[42] https://www.cms.gov/Research-Statistics-Data-and-Systems/Statistics-Trends-and-Reports/Information-on-Prescription-Drugs/Medicaid
[43] Utilization rates have been increased from 40 units per day (used in the AMA study) to 60 units per day to better match today’s average utilization, as found in the HCCI report: https://healthcostinstitute.org/diabetes-and-insulin/spending-on-individuals-with-type-1-diabetes-and-the-role-of-rapidly-increasing-insulin-prices
[44] https://healthcostinstitute.org/diabetes-and-insulin/spending-on-individuals-with-type-1-diabetes-and-the-role-of-rapidly-increasing-insulin-prices
[45] https://healthcostinstitute.org/diabetes-and-insulin/price-of-insulin-prescription-doubled-between-2012-and-2016
[46] https://www.kff.org/medicare/issue-brief/how-much-does-medicare-spend-on-insulin/
[47] 2018 estimates are authors’ calculations based on data obtained from CMS’s Medicare Part D Drug Spending Dashboard: https://www.cms.gov/Research-Statistics-Data-and-Systems/Statistics-Trends-and-Reports/Information-on-Prescription-Drugs/MedicarePartD
[48] Authors’ calculations based on data obtained from CMS’s Medicare Part D Drug Spending Dashboard: https://www.cms.gov/Research-Statistics-Data-and-Systems/Statistics-Trends-and-Reports/Information-on-Prescription-Drugs/MedicarePartD
[49] https://www.kff.org/medicare/issue-brief/how-much-does-medicare-spend-on-insulin/
[50] Authors’ calculations based on data obtained from CMS’s Medicare Part D Drug Spending Dashboard: https://www.cms.gov/Research-Statistics-Data-and-Systems/Statistics-Trends-and-Reports/Information-on-Prescription-Drugs/MedicarePartD