


Testimony
September 22, 2021
Recognizing and Building on the Success of Pandemic Relief Programs
United States House of Representatives Select Subcommittee on the Coronavirus Crisis
*The views expressed here are my own and not those of the American Action Forum. I thank Gordon Gray, Tara O’Neill Hayes, and Angela Kuck for their insight and assistance.
Chairman Clyburn, Ranking Member Scalise, and members of the Subcommittee, thank you for the privilege of appearing today to share my views on the pandemic relief policies and the opportunities for improving the economic outlook for all Americans. I wish to make three main points:
- Congress and the Administration undertook a very successful fiscal response to the COVID-19 recession in 2020, but emergency actions are in no way a foundation for future growth policy;
- Fiscal policy in 2021 has a more mixed record; stimulus efforts have been misguided and counterproductive, while longer-run growth policies are, on balance, unpromising; and
- A successful growth and anti-poverty approach will focus on education, skills, and access to jobs.
Let me discuss in turn.
The Successful Response to the COVID-19 Recession in 2020
The sharp downturn in the spring of 2020 was different in character, deeper, and more rapid than any postwar recession. Despite this, on a bipartisan basis Congress and the Administration responded in a timely fashion, with programs of necessarily large scale, and by-and-large appropriate design.
In the 20th century, recessions were income-related events. In the prototypical recession, when inventories built up, production was throttled back, layoffs ensued, and household incomes fell. The resulting retrenchment in household spending exacerbated the original problem, and the downturn took hold. Eventually, the shelves became too bare, production ramped up, laid-off workers were recalled, and the dynamics took hold in reverse. Many of the familiar fiscal policies – unemployment insurance (UI), tax cuts, etc. – were designed to provide transfer income to lessen the depth of the recession and shorten its duration.
In the 21st century, recessions have been triggered by financial instability and wealth destruction that spilled over to the Main Street economy. The dot-com bubble burst led to a mild recession early in the century and the 2007-2008 financial crisis spawned the Great Recession. The same tools were deployed, but with little success. Despite fiscal policy legislation in 2001, 2002, 2003, and 2005, the years after the dot-com recession were labelled the “jobless recovery.” The painful aftermath of the Great Recession is familiar to all.
The COVID-19 recession is unique. Income rose in 2020, with personal income up 4.8 percent, employee compensation up by 3.1 percent overall, and wages and salaries up 3.4 percent. The recession was not an aggregate income event. Similarly, housing values rose in 2020, equity markets were up strongly, and household wealth has been bolstered by the large amount of transfer income that has been saved. The recession was not a financial market or wealth event.
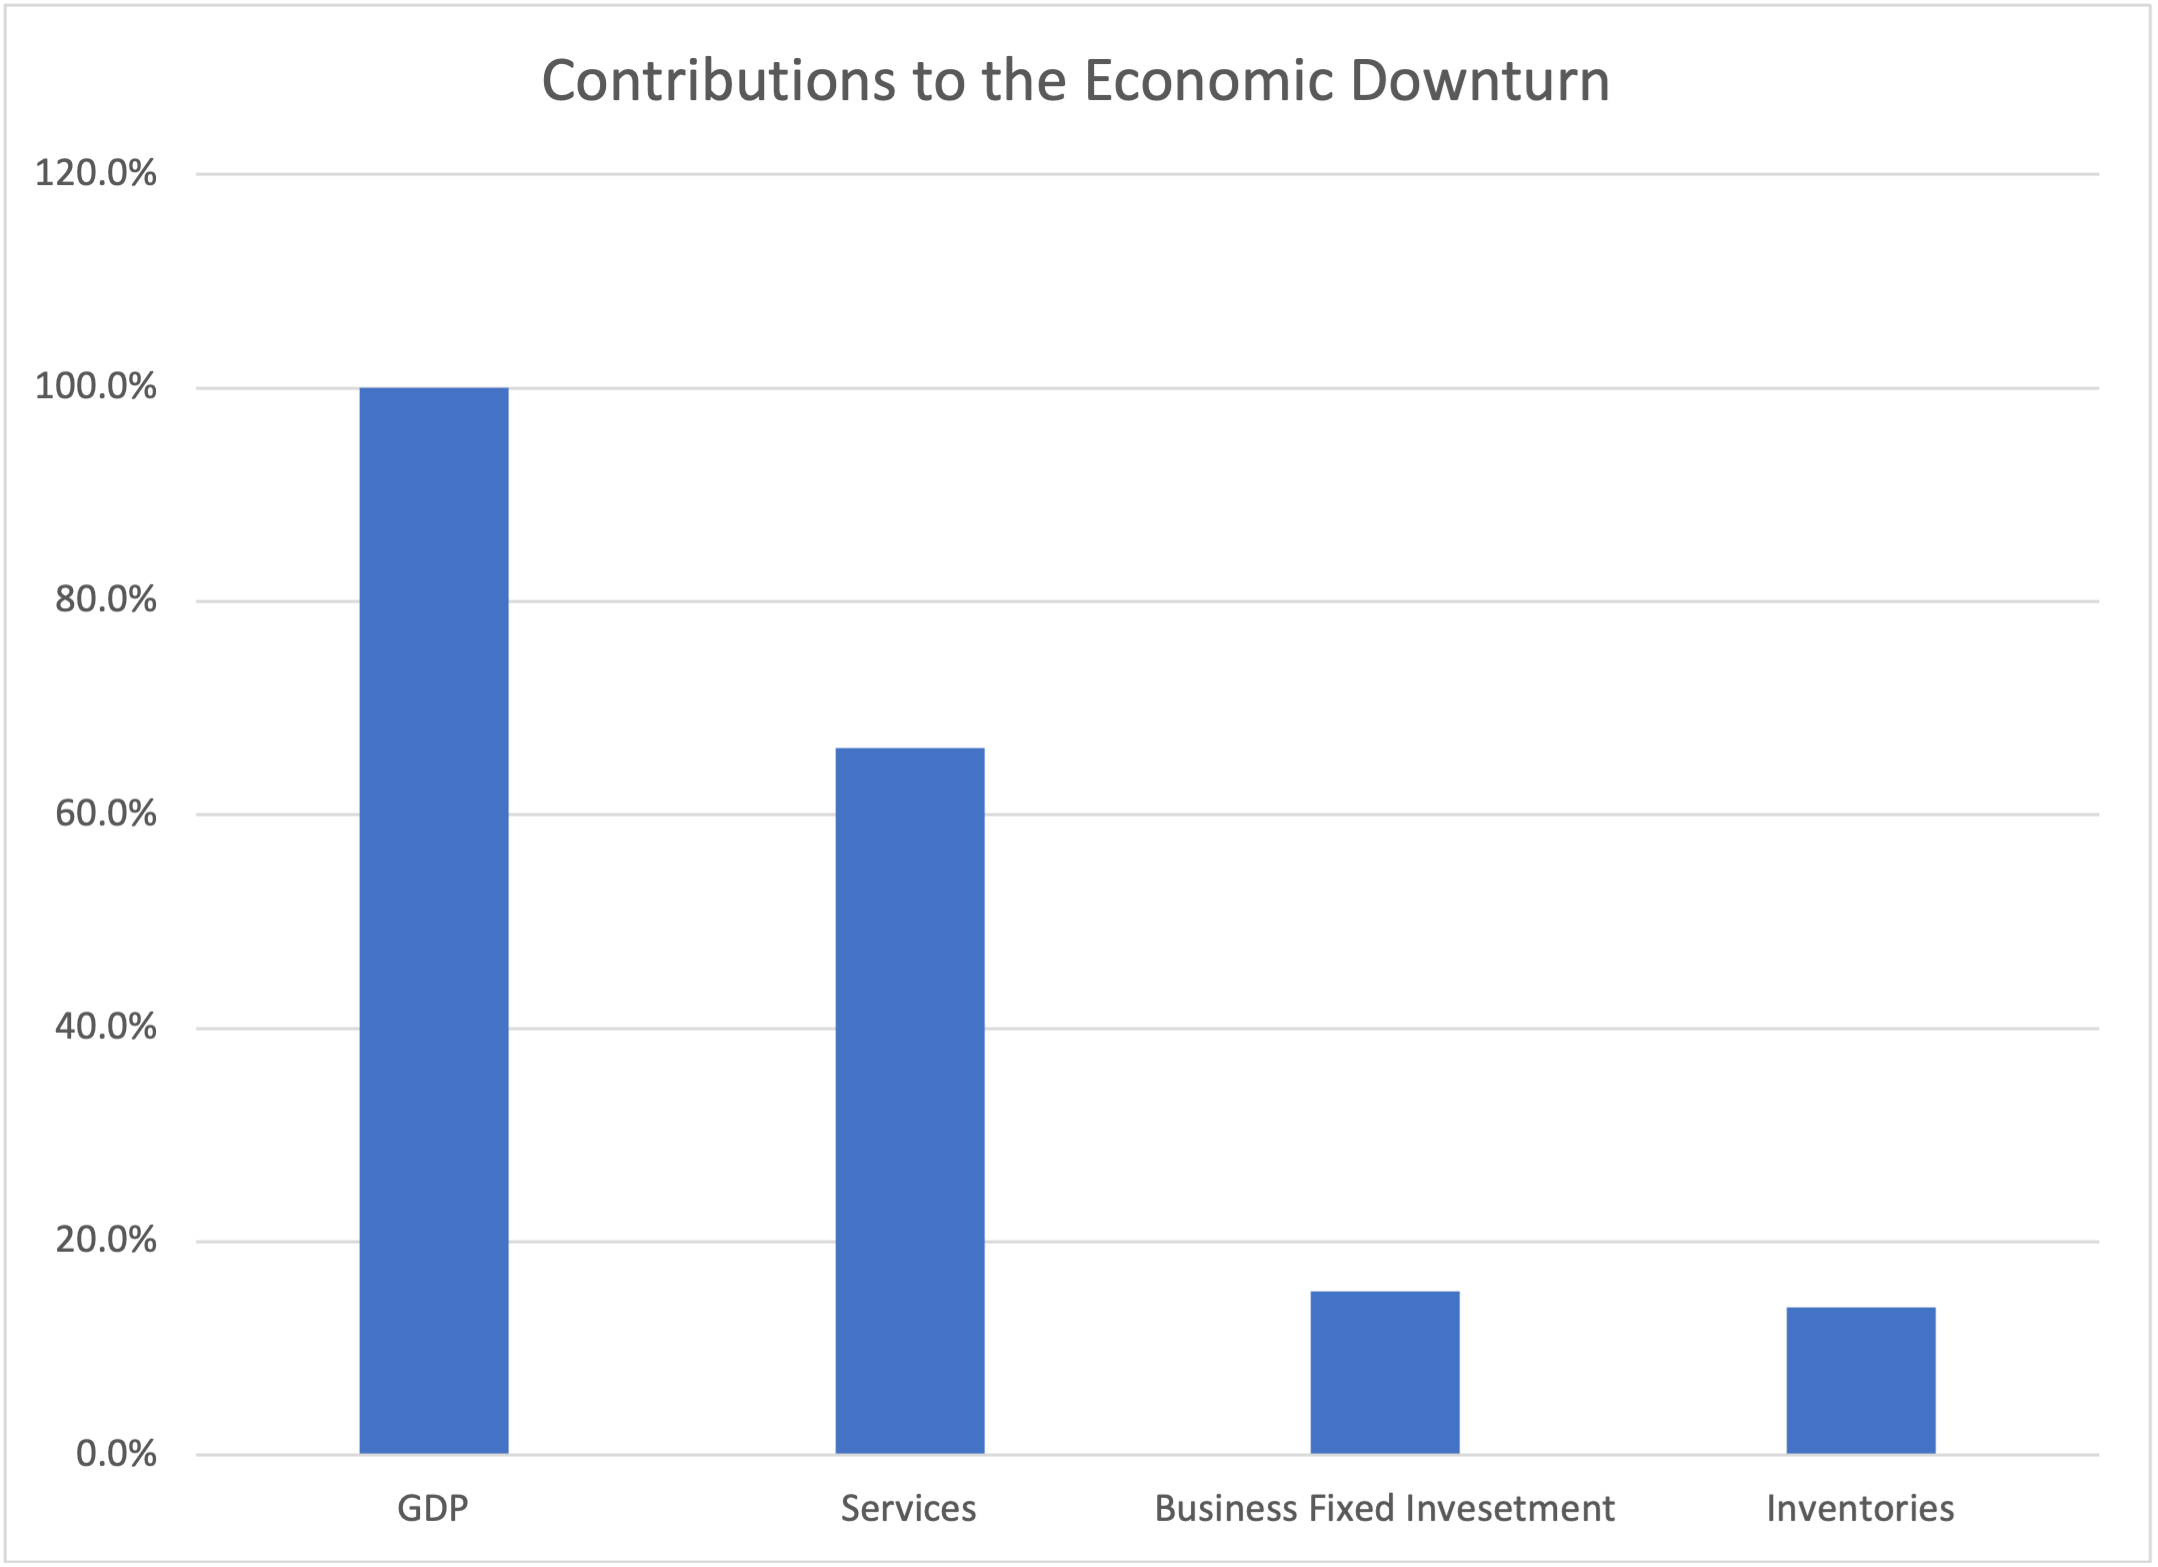
The COVID-19 recession was a household spending (“consumption” in the jargon of economics) and labor supply event. Between Q4 of 2019 and the trough in Q2 2020, real gross domestic product (GDP) fell precipitously by $1,944.1 billion (in 2012 dollars) or 10.1 percent. As shown in the chart (below), 66 percent of that decline can be traced to reduced household spending on services. This follows directly from the threat of the virus: consumption of personal services such as restaurant meals, hotels, concerts, haircuts, and the like involved personal contact and ran the risk of infection with the coronavirus. The traditional drivers of economic downturn such as business investment or inventory decumulation contributed relatively little.
The impact of the virus’s threat is shown more clearly in the chart (below) reproduced from the Track the Recovery website in January 2021. The chart displays a real-time estimate of total spending (blue), as well as spending by households in low-income (green) and high-income (red) zip codes. All three measures collapsed in early March 2020. Of note, in part due to the large policy response, spending overall and in low-income areas was above January 2020. Spending in high-income zip codes, however, had yet to recover and remained 2.2 percent below last year.
The second channel for the virus was direct interference in the labor market. Workers in these service industries, disproportionately low-skill and inexperienced, were unable to work in those conditions. More generally, the threat from the coronavirus prevented many from going to work across the economy. 
This unique recession was also historically large and rapid. As noted above, GDP fell by 10.1 percent in the first half of 2020, and by 9 percent in the second quarter alone. By comparison, during the worst year (1932) of the Great Depression the economy shrank by 12 percent. Payrolls in April 2020 fell by 20.8 million jobs, en10 times larger than any single monthly loss on record. The service sector lost over 18.3 million jobs. The leisure and hospitality industries were particularly devastated, losing over 7.5 million jobs.
Congress and the Administration responded in kind. In 2020, tCongress enacted 5 pieces of legislation, most notably the Coronavirus Aid, Relief, and Economic Security (CARES) Act. Combined, these 5 bills are estimated to increase the deficit by about $3.5 trillion. They provided direct relief to households, support to small businesses, and expanded unemployment insurance and paid leave. The response was timely – CARES passed in March – and of the necessary scale.
It was also largely well-designed. There were three major aspects that drew negative attention. First, the Main Street Lending and Municipal Liquidity facilities at the Federal Reserve provided little lending. In retrospect, this seems most attributable to the fact that Federal Reserve liquidity efforts (its balance sheet expanded by roughly $4 trillion) preserved normal, private-sector lending patterns.
Second, the Paycheck Protection Program (PPP) was initially not as well-targeted as some critics would have liked. Still, it delivered roughly $500 billion in support quite quickly; later iterations improved the coverage of the program.
Finally, the federal bonus (originally $600 per week, later reduced to $300 per week) to unemployment insurance made sense when the goal was to make sure that people did not seek work. As the threat of the virus faded, however, it became apparent that providing replacement rates in excess of 100 percent for large swaths of the labor market is a real impediment to getting individuals back to work.
Overall, these efforts substantially improved the economic outlook. In the 2nd quarter of 2021, GDP regained its pre-pandemic level. Importantly, these 2020 efforts were genuinely temporary and did not alter the baseline projections of spending and revenues. That, however, was soon to change.
The Transition from Support to Growth in 2021
As the economy entered 2021, it was growing strongly due to the continued support (there had been another $900 billion in December) and the arrival of the vaccines as an additional weapon in the fight against the coronavirus. The next important fiscal policy was the American Rescue Plan (ARP) – the Biden Administration’s $1.9 trillion proposal. ARP was advertised as much-needed stimulus to reverse the course of the economy and restore growth. As noted above, however, the economy was no longer in recession and was growing. Indeed, at the time of ARP’s passage, real-time indicators showed 1st quarter GDP growing at an annual rate in excess of 6 percent.
Moreover, recall that the “theory” of stimulus is that when the economy is below full employment, government stimulus—tax cuts, checks, spending—will boost spending. This will, in turn, stimulate business activity, which will begin a virtuous cycle of additional income to workers, more spending, and more hiring. Because of the virtuous cycle, $1 of stimulus is expected to have (much) more than a $1 impact—the “multiplier effect.”
That’s the theory; it just has nothing to do with the ARP. First, one lesson is that there is no stimulus as long as the virus stops households from spending freely and prevents supply responses. Further, even taking the stimulus theory at face value, the $1.9 trillion size of the package eclipsed the economic need. Real GDP is below potential GDP with the output gap somewhere in the vicinity of $450 billion (in 2012 dollars). The $1.9 trillion proposal is a bit over $1.6 trillion in 2012 dollars. Thus, the law was a stimulus of over three times the size of the output gap that needed to be closed to get the economy back to potential. Based on any reasonable economic theory of stimulus, $1.9 trillion is far too large, particularly given supply constraints. The ARP (passed in March) did not alter the pace of growth a bit from the first to the second quarter, and all those checks produced a 3.3 percentage point increase in nominal consumer spending but only a 0.4 percentage point increase in real spending. In short, the household relief provided in the ARP to a significant degree evaporated in higher prices.
The second key aspect of the ARP is that its content has an internal contradiction. In broad terms, it contained provisions to fight the coronavirus with more vaccines and testing, more than $1 trillion for households, and $440 billion for aid to communities and businesses. If the plans to fight the virus were successful, however, there would be no need for special monies to open schools, open child daycares, provide paid leave, support businesses, or stimulate household spending. Only if the vaccination plan was expected to fail did it make sense to provide large-scale support for the economy through the summer and into the fall.
The third key feature is that some of the economics are very weak (at best). As noted above, it made no sense to increase to have the $300 UI benefit, and to have it extend to the end of September (especially if one expected the labor market to be essentially unimpaired by the virus during the summer).
Consider also the $40 billion for housing programs, which broadly included $25 billion for rental assistance, $10 billion for homeowner assistance, and $5 billion for homelessness assistance.[i],[ii] Conceptually, I still find it difficult to reconcile the need for specific assistance on housing with the notion that Congress has provided hundreds of billions in stimulus checks and enhanced UI benefits to permit households to maintain their budgets – including rent and mortgages. Moreover, the funding is not temporary; it will be available to be disbursed for up to 5 years (until September 30, 2025) — well past the expected duration of the COVID-19 pandemic.[iii]
Another questionable design was the checks to households. The $600 checks provided in December will produce no real stimulus; raising them to $2,000 doubled down on a failed policy. If the checks are, instead, viewed as relief for those facing financial travail they should have been targeted on the long-term unemployed.
In 2020, the fiscal response to COVID-19 has been appropriately large, timely, and entirely temporary. The ARP is none of these. Much of its provisions has nothing to do with COVID-19 and are permanent or clearly intended to be; consider, for example, the grotesque bailout of the multiemployer pension system, as well as the expanded and advanceable child tax credit, the childcare tax credit, the expanded earned income tax credit, and the expanded and larger premium tax credits.
This has become abundantly clear with the markup of the Build Back Better Act, a proposal that may be debated on its long-term merits as a massive expansion of the social safety net, an enormous and poorly designed tax increase, a climate change policy, an education policy, and much more.
But it is of questionable merit as the way forward for pro-growth fiscal policy. One reason for concern is the research the American Action Forum (AAF) released on the economic consequences of raising the proposed taxes and spending it exclusively on productive infrastructure. The upshot? The economy shrinks instead of grows, as the negative effects of the taxes outweigh even a disciplined focusing on productive spending. Since the actual Build Back Better Act is not a disciplined infrastructure spending program, the likely impacts will be even more negative.
Despite this, the case for the Build Back Better Act was highlighted by the president in his recent remarks: “And the same time, it’s true that long-term investments that bring down the biggest costs that families face — housing, childcare, education, and healthcare — these investments will lower out-of-pocket expenses, not raise them. They will spur more people to work by helping ease the burdens of childcare and senior care that parents, especially mothers, bear — keeping them out of the job market” (emphasis added).
The gamble in the Build Back Better Act is whether the constellation of checks to parents (child tax credit), paid family leave, child care subsidies, earned income tax credit expansion, home health care, and health insurance subsidies will raise the labor force participation rate (LFPR) – particularly for women. Suppose, for example, the Build Back Better Act were to instantaneously raise the LFPR for U.S. females to that of western Europe (taken from Isabel Soto’s recent research). That would mean a LFPR of 72.1 percent instead of 68.9 percent, or roughly 3.3 million more workers (as of the end of June). That corresponds to a 2.3 percent increase in the labor input in the economy. If productivity is (roughly) the same for the new workers, this means a 2.3 percent increase in GDP.
Is 2.3 percent big? Well, it is roughly one year of trend economic growth or $520 billion. I’ll let you decide if that is “big” enough. I would just emphasize that it is hardly a lock. First, much of the benefit – child credit, health insurance subsidies, home health care, child care subsidies – is not work-contingent. Moreover, as Soto concluded: “Data from European countries that have implemented country-wide paid-leave programs do not support the argument that a state-sponsored paid-leave system increases female labor force participation. There have also been attempts to create paid leave programs in the United States at the state level, but since the creation of these programs, female labor force participation has not seen significant change.”
No change in labor force participation means no change in supply-side growth.
A potential strong point in the long-term growth agenda is the Senate-passed infrastructure bill. While it did not fully pay for the outlays by cutting non-investment federal spending, as discussed in my analysis, the Congressional Budget Office (CBO) has released its analysis that suggest an investment program has long-lived beneficial impacts.
Priorities for Long-term Growth
As discussed above, the 2020 fiscal policies were quite beneficial, but there is no longer a need for temporary stimulus efforts. Rather, policies that improve trend economic growth are critical to improving the standard of living for working families. The trend growth rate of post-war GDP per capita (a rough measure of the standard of living) has been about 2.1 percent. At this pace of expansion an individual could expect their standard of living to double in 30 to 35 years. Put differently, during the course of one’s working career, the overall ability to support a family and pursue retirement would become twice as large. In contrast, the long-term growth rate of GDP in the most recent CBO projection is 1.7 percent. This long-term growth rate implies that it could take the same American at least twice as long to see their standard of living double. The American Dream is disappearing over the horizon. The bills passed and under consideration in 2021 are not promising candidates for improving this outlook and contributing strong long-term growth. What should be in the mix?
One central issue is a strategy for addressing poverty in the United States, and at the center of that strategy should be work. Indeed, defining poverty as insufficient economic resources invites merely “throwing money at the problem.” A better view of poverty is that it reflects the absence of economic self-sufficiency, and the goal should be to make individuals economically self-sufficient.
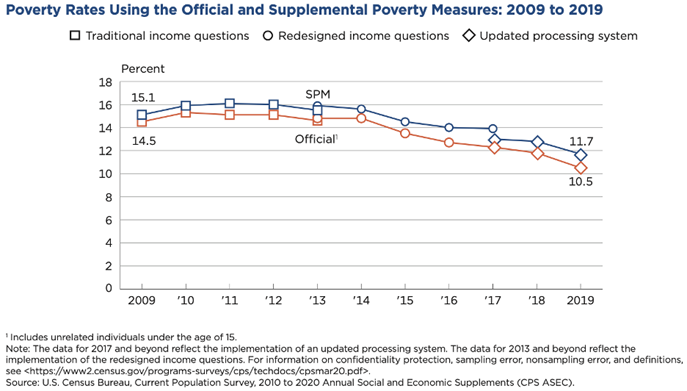
The United States uses a variety of measures of poverty. The Official Poverty Measure (OPM) has been based on the cost of a minimum food diet in 1963, adjusted annually for inflation using the Consumer Price Index for All Urban Consumers (CPI-U) and assuming food accounts for one-third of a household’s basic costs, as explained here. There is no geographic adjustment, simply a national threshold.
Determining whether someone is above or below the OPM threshold is based on money income before taxes (including cash-like benefits, such as Social Security payments, unemployment benefits, and child support payments) but not including capital gains, non-cash benefits (such as food or housing subsidies), or the value of tax credits received. In this way, the OPM is roughly a poverty measure that focuses on economic self-sufficiency.
Recent attention focused on the fact that an alternative poverty measure may have actually fallen during 2020 as a result of the large fiscal response. The Census Bureau also publishes the Supplemental Poverty Measure (SPM), which uses a more comprehensive assessment of income and expenses than the OPM and includes the value of federal non-cash benefits, as well as the cost of taxes and other expenses paid (such as child care, medical, and commuting costs) to convey a more accurate picture of an individual’s net income.
Also unlike the OPM, the SPM considers a more comprehensive assessment of needs, including food (based on today’s cost), clothing, shelter, and utilities in determining the threshold. The threshold is based on spending for these items at the 33rd percentile of the expenditure distribution plus 20 percent to account for the cost of other necessities, such as household supplies and personal care items. With its focus on post-tax, post-transfer income, the SPM carries the spirit of an “economic resources” approach to poverty.
A final perspective is a consumption-based poverty measure, which assesses what people consume or purchase to determine whether their needs are being met. In other words, this metric accounts for all types of benefits and aid that might be provided, as well as expenses. A consumption-based metric serves as a good proxy for material hardship or wellbeing. Assessing consumption eliminates the need to determine what necessities cost while also providing a sense of the value people place on various goods by observing what they prioritize.
As shown below, both the OPM and SPM had shown declining rates of poverty over the past decade, following the recession of 2008.
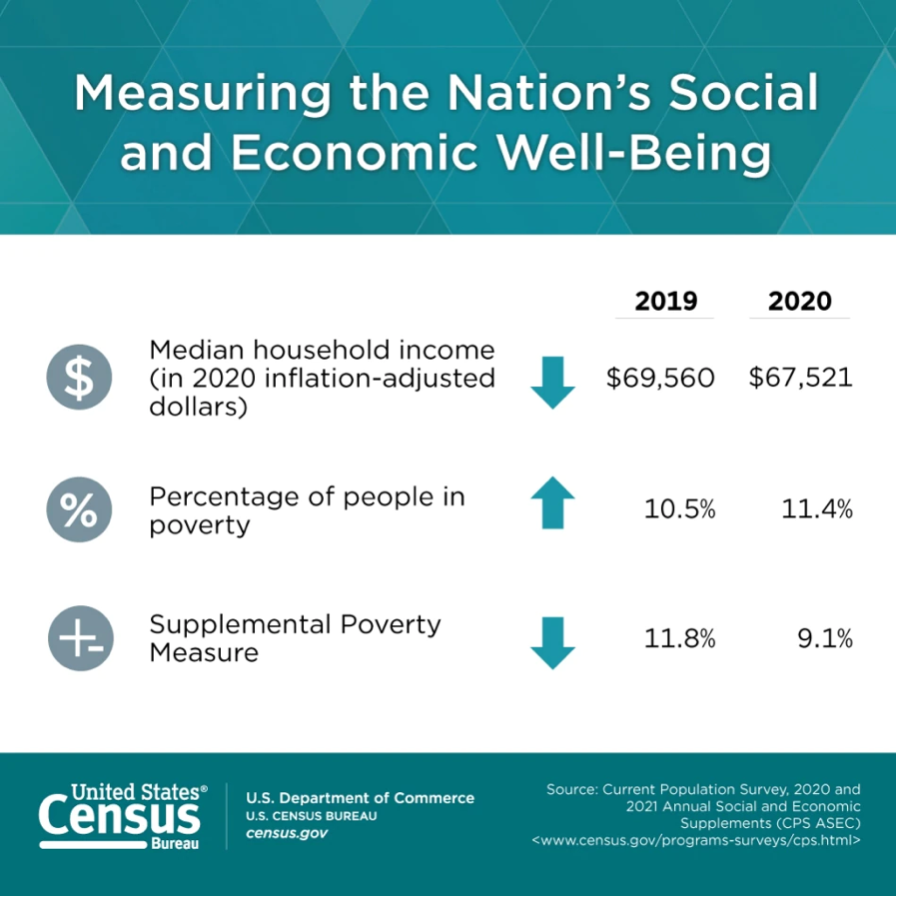
When the COVID-19 pandemic struck in 2020, poverty as measured by the OPM increased to 11.4 percent, nearly one percentage point, as many people lost their jobs and thus had less earned income.[iv] After accounting for the generous benefits provided throughout the year (stimulus checks, enhanced SNAP benefits, the enhanced Child Tax Credit, and a freeze on mortgage and rent payments), however, the SPM shows fewer people experiencing poverty last year, relative to 2019, with SPM falling to 9.1 percent.[v]
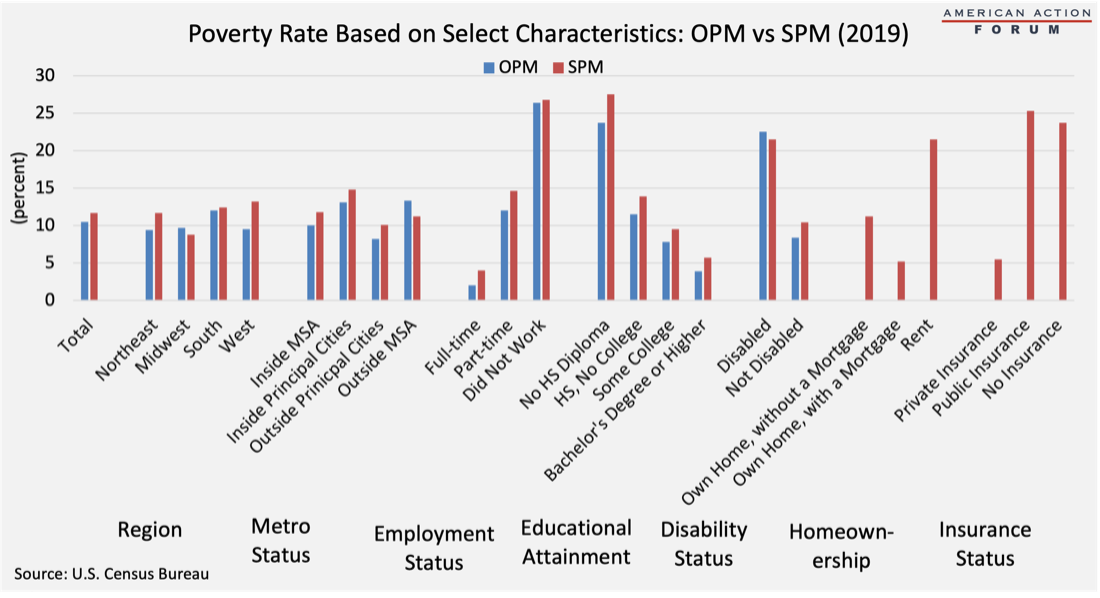
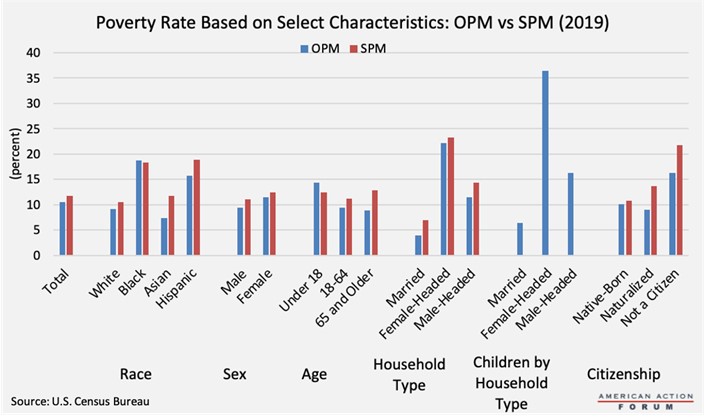
Despite the methodological differences, both the OPM and SPM show that employment status, educational attainment, and marital status are the best predictors for determining someone’s risk of being impoverished: Earning a college degree, working full-time, and being married before having children provide the greatest promise for escaping poverty.
Individuals who work full-time year-round are highly unlikely to be in poverty, whereas more than one-fourth of those who did not work at all were in poverty. Under the SPM, likely because of the accounting of various expenses, twice as many full-time workers are considered poor relative to under the OPM, though the rate is still just 4.0 percent.[vi] Similarly, the more education individuals have, the less likely they are to be in poverty, which is surely related to the fact that people are more likely to be employed full-time (and with higher wages) the more educated they are.[vii]
Female-headed households are also significantly more likely to be impoverished than either male-headed households or households of married couples. This likely is also highly correlated with employment. In 2019, the labor force participation rate of women, as well as the share working full-time, was 23 percent lower than that of men.[viii] Women with children are also much less likely to be working full-time, particularly those with children under the age of six: Just 73 percent of noninstitutionalized women with young children are working full-time, compared with 94 percent of such men with young children.[ix] Given the aforementioned connection between education and employment, however, this employment gap may soon begin to narrow as women are now more likely than men than to earn a college degree, and that reversal is growing each year.[x]
Thank you and I look forward to your questions.
[i] https://docs.house.gov/meetings/BA/BA00/20210210/111179/HMTG-117-BA00-20210210-SD002.pdf
[ii] https://docs.house.gov/meetings/BA/BA00/20210210/111179/HMTG-117-BA00-20210210-SD002.pdf
[iii] Sections 4201(j), Section 4207(a), Section 4206(a) of HFSC reconciliation bill, available at https://docs.house.gov/meetings/BA/BA00/20210210/111179/HMTG-117-BA00-20210210-SD003.pdf
[iv] https://www.census.gov/newsroom/press-releases/2021/income-poverty-health-insurance-coverage.html
[v] https://www.census.gov/newsroom/press-releases/2021/income-poverty-health-insurance-coverage.html
