Insight
April 14, 2020
Analysis of the Competing Proposals to Reform Medicare Part D
Executive Summary
Over the past year, Congress has put forward several proposals to lower prescription drug costs, including numerous proposals to reform the Medicare Part D benefit structure. This study analyzes how these plans would be expected to impact spending in 2022, estimating aggregate impacts by looking just at those drugs for which annual spending is high enough to require a manufacturer payment if a beneficiary took only that drug (and not taking into account behavior changes resulting from the reforms). While the plans are conceptually similar, the differences in the details result in significantly different impacts for the various stakeholders.
- All of the pending proposals seek to put downward pressure on prescription drug prices, specifically by requiring manufacturer rebates in the catastrophic phase of the benefit (at least) rather than (solely in) the coverage gap, ensuring the mandatory discount increases along with a drug’s price, and increasing insurers’ liability and thus their incentive to control costs.
- Each plan also caps beneficiary spending and significantly reduces the government’s reinsurance liability, providing greater financial protection to both beneficiaries and taxpayers.
- Despite H.R. 3 setting the lowest out-of-pocket (OOP) cap and requiring drug manufacturers to pay the greatest share of overall costs, it is expected to reduce beneficiaries’ OOP costs and the federal government’s reinsurance costs the least, relative to the other congressional proposals.
- H.R. 19 and S. 3129 are expected to provide the greatest OOP savings to beneficiaries and will provide nearly the same level of reinsurance savings to the federal government as the revised S. 2543.
The Proposals
This study examines the potential impacts of three congressional proposals to reform the Medicare Part D program and compares them to proposals from the American Action Forum (AAF) and the Medicare Payment Advisory Commission (MedPAC). First, the Senate Finance Committee (Finance) has considered, approved, and then revised S. 2543, the Prescription Drug Pricing Reduction Act (PDPRA) of 2019, and this paper assesses the most updated version. Second, Speaker of the House Nancy Pelosi has introduced H.R. 3, which includes both a Part D reform and other, much more sweeping changes. Third, several House Republican committee leaders have introduced H.R. 19, the Lower Costs, More Cures Act, and S. 3129 includes an identical Part D reform.
For an overview of the structure of the various proposals, read this primer.
Estimating the Impact
Summary of the Overall Impact
According to this analysis—detailed below, and sans any assumptions regarding behavioral changes—H.R. 19 and S. 3129 would be expected to provide beneficiaries with the greatest out-of-pocket (OOP) savings and the federal government with the second-greatest reduction in reinsurance costs. The revised Finance proposal would provide slightly greater savings in reinsurance costs but less than half the amount of overall OOP savings to beneficiaries. Of note, while H.R. 3 would set the lowest OOP cap and impose the greatest financial liability on the pharmaceutical industry of all the plans, it is not projected to reduce either beneficiaries’ OOP spending or the government’s reinsurance costs as much as the other two congressional proposals. There are two key reasons for these unexpected findings. First, most beneficiaries do not incur enough costs to reach the $2,000 limit and thus will not see any reduction in their OOP costs due to that cap. Further, because H.R. 3 maintains a coinsurance rate of 25 percent while H.R. 19/S. 3129 and S. 2543 would reduce coinsurance to 15 percent and 20 percent, respectively, beneficiaries with spending below the OOP limit would not see savings under H.R. 3 but would under the other plans. Second, for all those who do reach the OOP threshold, the lower limit offered by H.R. 3 would result in a greater share of overall spending occurring in the catastrophic phase—where the government becomes liable for costs. This shift would result in less reinsurance savings. Finally, insurer liability does not increase as much under H.R. 3, which has two important—but competing—implications: It may help to keep premiums from rising (since expected insurer liability is essentially what determines premiums), but it does little to change their incentives to more significantly control costs.
Table 1: Estimated Change in Liability by Stakeholder, Relative to Current Law
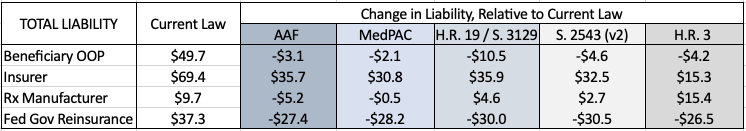
*This stakeholder analysis does not include estimated costs of premium changes for either the beneficiary or the federal government, aside from the discussion at the end regarding estimates done by others.
Stakeholder Liability on an Individual Basis
Table 2: Stakeholder Liability Before the Catastrophic Phase, Assuming Patient Reaches Catastrophic Threshold
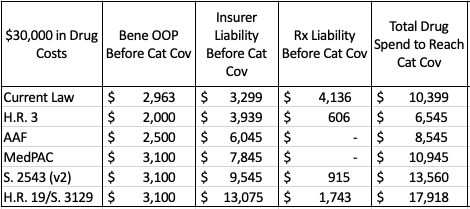
Table 2 illustrates various stakeholder liabilities and relevant spending thresholds on an individual level, assuming a beneficiary incurs enough costs to reach catastrophic coverage taking only brand-name drugs and/or biosimilars. Under all reform proposals, beneficiaries would not owe anything more once they reach the catastrophic phase; under current law, beneficiaries must continue to pay 5 percent of all costs in the catastrophic phase. OOP spending before the catastrophic phase would be closest to that expected under current law in S. 2543, H.R. 19/S. 3129, and the MedPAC proposal. Insurer liability before the catastrophic phase, shown in Column 3, would be closest to current law liabilities under H.R. 3.
Under current law, rebates are required in the coverage gap; under each of the proposals introduced in Congress, rebates would be required once a beneficiary reaches their deductible. Under the AAF and MedPAC proposals, rebates would not be required until the beneficiary reaches catastrophic coverage.
Table 3: Stakeholder Liability in the Catastrophic Phase for a Patient with $30,000 in Drug Costs
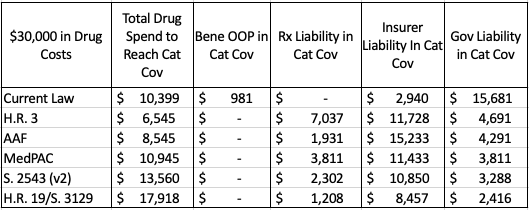
Table 3 shows the costs that would be covered by each stakeholder in the catastrophic phase for a beneficiary with $30,000 in spending solely on drugs for which the manufacturer would be liable for a share of the costs.
The chart below illustrates total costs by payer for the same scenario. Each proposal will significantly reduce government liability. Total manufacturer liability is smallest under the AAF proposal and largest under H.R. 3 from Speaker Pelosi. Insurer liability is most limited under current law and highest under H.R. 19 and S. 3129.
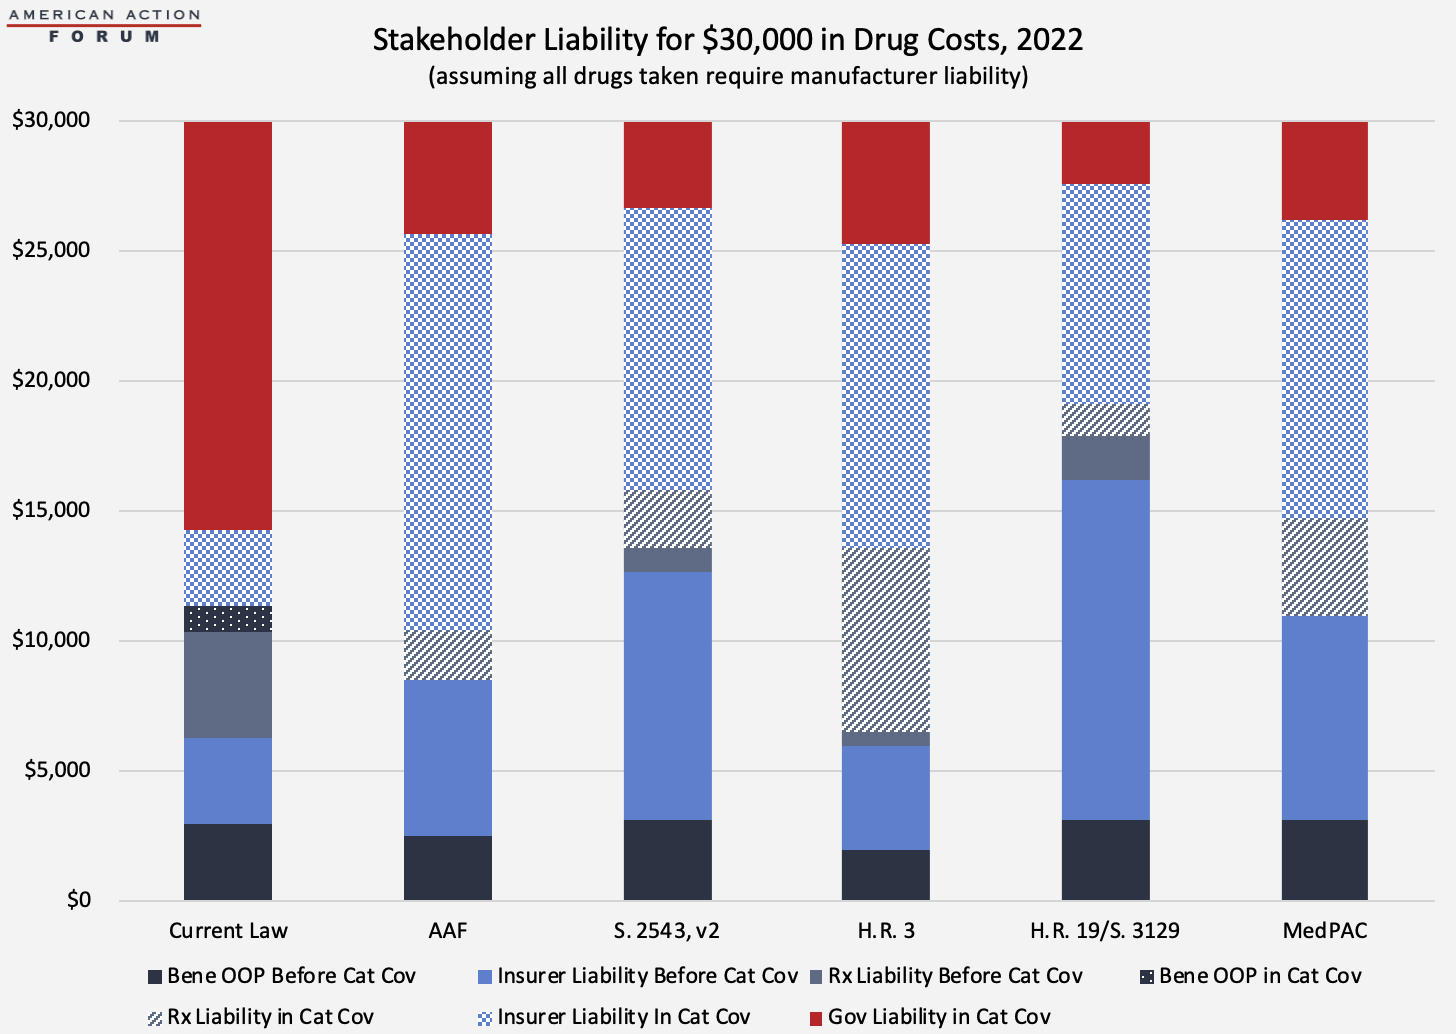
Aggregate Stakeholder Liability
Considering the effect of the various proposals at both the individual and aggregate level is important because, as shown in the preceding and succeeding graphs, the impacts at the individual level are not representative of the overall impact at the aggregate level. Both the graduated impact of the manufacturer liability as a drug’s cost increases and the significant differences in utilization across the beneficiary population drive this difference.
Using spending and utilization data from 2018 provided in the Centers for Medicare & Medicaid Services (CMS) Medicare Part D Drug Spending Dashboard, this analysis estimates some of the expected costs to the various stakeholders in 2022—the first year that these proposals would be implemented. Only drugs for which estimated average annual per beneficiary spending exceeds the threshold at which a rebate would be required are included in the estimate of total rebates that manufacturers must pay. Assumptions and limitations of this analysis are explained in the appendix, but one important note is that the limitations of this analysis likely most impact the estimates regarding manufacturer liability under the MedPAC and AAF proposals, and as a result these estimates most likely significantly underestimate manufacturers’ liability. The underestimate is a result of the fact that much less of the overall spending expected to occur in the catastrophic phase—the only phase under each of these plans when manufacturers would be required to cover a share of the costs—is captured by this analysis. The estimates for the other three proposals, because they require manufacturer liability for all spending above the deductible, capture a much greater share of total program spending and thus more fully capture the manufacturers’ liability. It should also be noted that none of these estimates assume any behavioral changes.
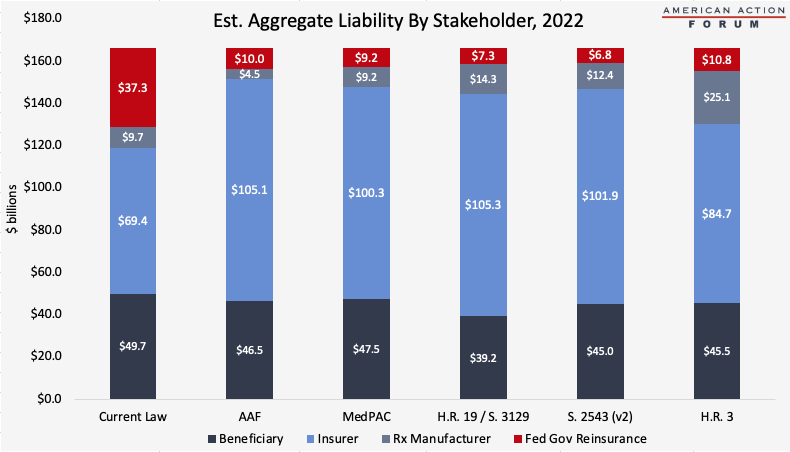
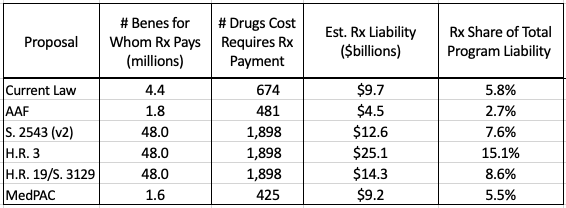
Table 4 illustrates the number of drugs and beneficiaries for which manufacturers would be required to pay a share of the costs under each of the plans (subject to the limitations of this detailed in the Appendix), as well as the expected total manufacturer liability for those drugs, both in nominal terms and as a share of overall program costs. The AAF proposal was designed not to extract additional funds from the pharmaceutical industry but rather to create natural market pressures to control costs. The congressional proposals and the MedPAC recommendations, on the other hand, would require significantly larger discounts from the pharmaceutical industry. The discount rates may be large enough to harm the industry and may result in reduced investment for future innovation. And that is to say nothing of the numerous other hits to the industry included in other sections of some of the bills, as discussed hereand here.
Table 4: Total Estimated Manufacturer Liability[1]
Costs to Beneficiaries and the Federal Government
The impact to beneficiaries depends on two primary components: any change in OOP costs and the change in premiums. Of course, beneficiaries may also be impacted by utilization management and formulary changes imposed by plan sponsors or product changes made by manufacturers as a result of the new policy, but those are beyond the scope of this analysis.
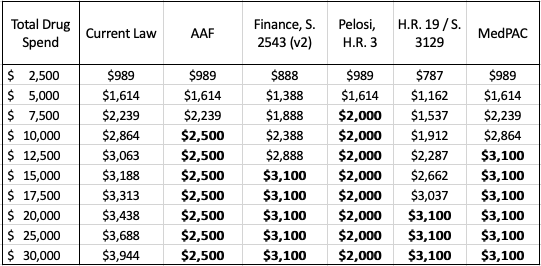
High-cost beneficiaries who are expected to reach the catastrophic phase under current law (roughly 1 million people) will certainly benefit from lower OOP costs under each of the proposals.[2] Table 5 below shows the various OOP requirements that would be required of beneficiaries under current law as well as each of the proposals at various total drug costs. Under H.R. 3, beneficiaries would begin to see OOP savings after just $6,545 in total drug costs. Under the revised Finance proposal, the $3,100 OOP cap would not reduce beneficiaries’ OOP liability, relative to current law, until total drug spending surpassed $13,560, while beneficiaries would not reach the OOP cap under H.R. 19 or S. 3129 until $17,918.
Table 5: Out-of-Pocket Requirements Under Various Proposals, 2022
The Milliman analysis of the AAF proposal, which does account for expected behavioral changes resulting from the reforms, estimates that beneficiaries would save up to $41.3 billion in OOP costs from 2020-2029. A preliminary estimate of the Finance proposal from the Congressional Budget Office (CBO), which also accounts for behavioral changes, found that beneficiaries would save $20 billion in OOP costs as a result of the redesign; an updated estimate of the revised proposal finds that from 2021-2030, OOP costs would be reduced by $72 billion—the increase resulting from reducing coinsurance below the OOP limit.
Beneficiaries with lower drug spending may be worse off under these proposals, as they may experience higher premiums without the benefit of reduced OOP costs.
Higher premiums, however, would be indicative of a better functioning insurance program. Premiums reflect expected insurer liability. The premise of these plans, in part, is that increasing insurer liability will increase their incentive to control costs. The proposals also aim to reduce OOP expenses for those with the highest costs; doing so typically requires shifting costs to other beneficiaries and the insurer, although in Part D the government and drug manufacturers also pay some of the costs. To the degree that insurer liability rises, premiums will necessarily rise proportionately, all else being equal. Under current law, beneficiaries in Medicare Part D pay 25.5 percent of the premiums, and the federal government subsidizes the remaining 74.5 percent; the cost of any increase in premiums will be distributed accordingly.
Because insurer liability is expected to be lowest under H.R. 3, some may expect premiums would be lowest under that plan; CBO estimates, however, that the Part D redesign in H.R. 3 would increase direct spending by the federal government by $9.5 billion. While CBO does not specify what would account for these costs, it may be the result of higher premiums (since insurer liability will increase relative to current law) without a commensurate decrease in reinsurance payments (since the low OOP threshold will result in beneficiaries reaching the catastrophic threshold much more quickly).
CBO’s analysis of the revised Finance proposal found that beneficiary premiums would likely be reduced by $1 billion, relative to current law, as a result of the redesign as well as the reduction in beneficiary premium liability from 25.5 percent to 24.5 percent (plus another $5 billion reduction associated with inflation rebate penalties). CBO also estimates federal spending would be reduced by $3.4 billion under the revised Finance proposal as a result of reduced reinsurance liability.
Premiums would likely be highest under H.R. 19 and S. 3129, the bills where insurers would have the greatest liability, relative to the other plans and current law. Milliman predicted beneficiary premiums under the AAF proposal (which is expected to increase insurer liability to a similar degree as H.R. 19 and S. 3129) would rise by $33.9 billion over 10 years (if behavioral assumptions proved true); when combined with the OOP savings, this premium increase would mean beneficiaries have an overall net savings of $7.4 billion.
Conclusion
In the 16 years since Congress created the Medicare Part D program, the prescription drug market, insurance structure, and pricing practices have changed. Patterns have emerged that make it clear the current system is encouraging undesirable behaviors that increase costs for the government and consumers. Reforming the benefit structure in a way that realigns the financial incentives of both the insurers and drug manufacturers may help to reverse these trends by putting downward pressure on drug prices. Such a substantial reform, however, requires careful consideration of the many trade-offs that will result from those changes. Putting too much pressure on drug prices could instead result in reduced innovation, fewer new treatments, and restricted access to existing medicines.
Appendix
Methodology, Assumptions, and Limitations
These estimates are based on the 2018 data provided in the Medicare Part D Drug Spending Dashboard. This data, provided by CMS, does not account for any discounts or rebates provided by drug manufacturers after the point of sale; as a result, total estimated spending is greater than the Medicare Trustees’ estimated net costs for the program.
In the estimates for aggregate stakeholder liability, it is assumed that the average cost per beneficiary using a given drug will increase 6 percent from 2018 to 2022 to account for expected price increases. Utilization of each drug is assumed to increase 10 percent, equal to the expected increase in program enrollment during that time, according to the latest Medicare Trustees Report.
The deductible under all proposals is assumed to be $485, as the Trustees estimate for 2022. In the current law estimate, the initial coverage limit is assumed to be $4,490 (also from the Trustees Report). For all other proposals, the initial coverage limit (also the catastrophic limit) was calculated based on the plan’s OOP cap and the beneficiary coinsurance rate. For these estimates, it is assumed that beneficiaries only take drugs for which a manufacturer would be required to pay a rebate. These estimates also assume no behavioral changes.
Further, only drugs for which estimated average annual per beneficiary spending exceeds the threshold at which a rebate would be required is included in the estimate of total rebates that must be paid. These estimates do not include rebates that will be required from all other drugs provided after a beneficiary surpasses the threshold for which rebates are required but have an average annual per beneficiary cost that is less than the rebate threshold. Since a beneficiary will likely also take lower-priced drugs throughout the year, these estimates may represent the low-end of the amount likely to be collected. Conversely, these estimates do not exclude drugs that may be generic products. Not every drug with a high price is a brand-name or biosimilar and thus, these estimates include discounts for possible generic products that would not be owed, resulting in a potential overestimate. Finally, it is important to note that these estimates do not account for any new drugs that have come to market or are expected to come to market after 2018. For these reasons, it is difficult to determine whether these estimates are overstated or understated. That said, these limitations apply equally to the analysis of each plan. The estimates for rebate collections under current law and each of the Congressional proposals are likely much closer to the total collection amount than the estimates for the AAF and MedPAC proposals, because the rebate collections under current law and the Congressional plans begin at a lower spending threshold and thus more of the total program spending is captured.
[1] See the Appendix for an explanation of why the estimates of the manufacturer liability under the AAF and MedPAC proposals are likely significantly less than the liability would be in actuality.
[2] This only includes beneficiaries who do not qualify for the Low-Income Subsidy (LIS) program since LIS beneficiaries have only very limited liability throughout the benefit.