Weekly Checkup
March 11, 2022
The Build Back Better Act and the Challenge of Insulin Prices
White House officials are once again circling Senator Joe Manchin in hopes of reviving a pared back version of the Build Back Better Act (BBBA)—this time centered on tax increases and cutting prescription drug prices, with the revenue split between deficit reduction and climate change. It seems unlikely, however, that House progressives are ready to jettison their domestic spending goals and embrace deficit reduction. If a larger deal on drug prices doesn’t emerge, Senate Majority Leader Chuck Schumer has floated carving out the BBBA’s provisions targeting insulin prices and moving that as a standalone bill. Recent developments in the insulin market, however, raise questions about whether the BBBA’s insulin proposals are really the right approach.
As detailed in past American Action Forum (AAF) research, diabetes cost the United States $327 billion in 2017, making it one of the nation’s most expensive chronic diseases, and the United States spent $48 billion on insulin—prior to any rebates or other discounts. Further, the average list price for insulin increased 11 percent annually between 2001–2018, climbing to an average per-capita insulin cost of almost $6,000 annually. List price, of course, is not indicative of what insurers or government payers are actually charged because of the complex system of rebates and discounts, but list price does dictate patient out-of-pocket costs.
President Biden highlighted one family’s struggle to afford insulin during the State of the Union, but there are myriad similar examples. The BBBA would require all insulin products to have their price set by the Secretary of Health and Human Services (HHS)—as part of a larger proposal to have Medicare “negotiate” drug prices—and would unilaterally limit cost-sharing for insulin through Part D to $35 per month. The BBBA’s insulin provisions would also reach into the group and individual insurance markets to limit patient insulin costs. Starting in 2023, health insurers offering group or individual health insurance coverage would be required to provide coverage for at least one of each insulin dosage form (vial, pump, or inhaler) of each type of insulin (rapid-acting, short-acting, intermediate-acting, long-acting, and premixed). Plans would also have to limit patient costs for insulin to either $35 for a 30-day supply or an amount equal to 25 percent of the HHS-negotiated price for a 30-day supply—net all price concessions—whichever is lower.
There have been regulatory hurdles to generic (or more accurately, biosimilar) insulins until recently, resulting in a lack of competition. New AAF research published this week, however, suggests that amid recent regulatory changes, competition is increasing. Several authorized generic insulins and a biosimilar have come to market, leading to a 6.8 percent drop in the per-unit price of insulin on average across all but ultra-long-acting insulin between 2018–2020. In other words, competition is lowering prices. Yet uptake of these lower priced alternatives is negligible—at least in Medicaid and Medicare Part D. It is likely that many insurers are still providing preferential treatment on the formulary to the brand-name products because such products typically come with substantial rebates—reportedly averaging between 30-50 percent.
While progressives focus on price-fixing—at the risk of curtailing innovation around insulin products and delivery mechanisms—competition is starting to take hold in the insulin market. The obstacle to lower prices for patients appears to be the complex system of rebates that serve to keep list prices high and more affordable insulins off formularies. Rather than seeking to artificially lower prices, Congress should revisit rebate reform as a means to change this dynamic and allow the public to reap the benefits of these lower cost products.
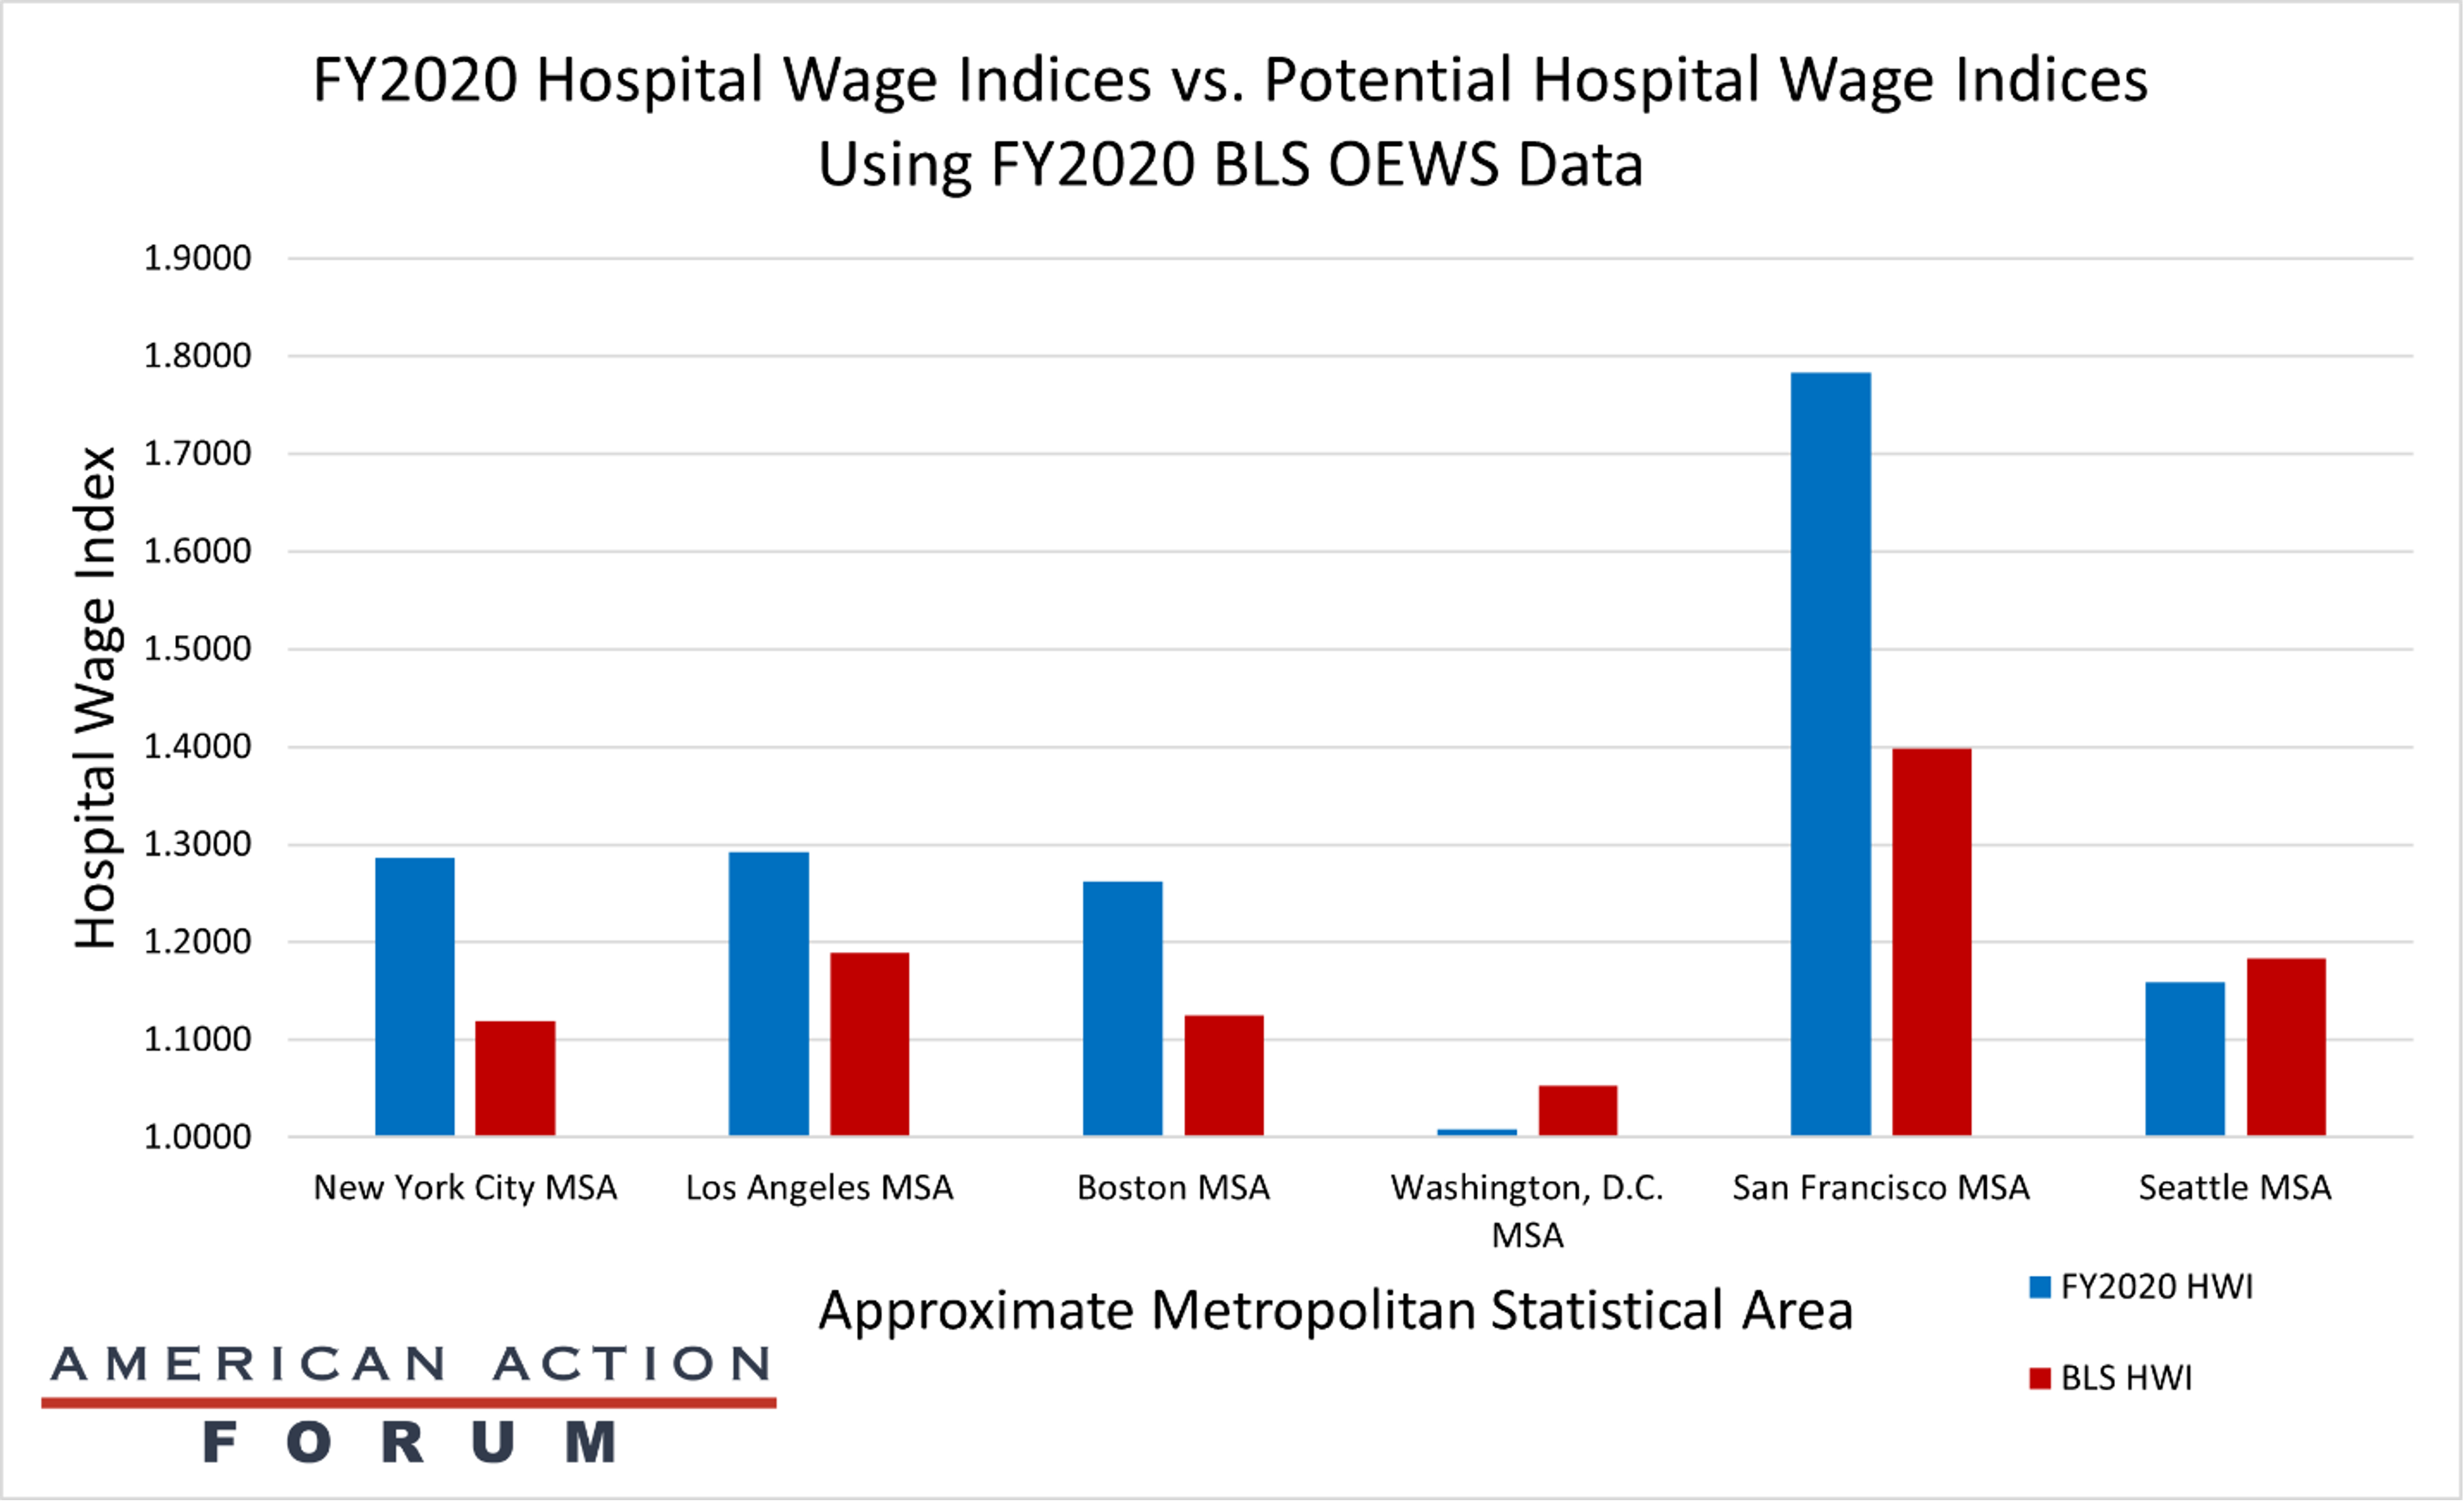
Chart Review: Impacts of Potential Fixes to the Hospital Wage Index
Jackson Hammond, Health Care Policy Analyst
To account for differences in cost based on geography, Medicare adjusts hospital reimbursements using two formulas, the Hospital Wage Index (HWI) and the Geographic Practice Cost Indices (GPCIs). Unfortunately, these indices are flawed and fail to accurately account for geographic variations, but attempts to better calculate for geography raise their own challenges, as discussed in a recent AAF primer. One solution is to change the data source of the HWI from hospital cost data to the Bureau of Labor Statistics’ Occupational Employment and Wage Statistics (BLS’ OEWS) data. The chart below demonstrates the potential HWIs this change would bring to high-cost areas, including the San Francisco, Los Angeles, Seattle, Boston, Washington, D.C., and New York City metropolitan statistical areas (MSAs). The calculations determined the average hourly wage for all health workers based on BLS’ OEWS data from May of 2020, the latest available. Of note, this chart shows there would likely be a significant decrease in the HWI for the San Francisco MSA (-21.59 percent) and substantive decreases for New York City (-13.02 percent), Boston (-10.85 percent), and Los Angeles (-7.98 percent), but a slight increase for Washington, D.C. (4.45 percent), and Seattle (2.12 percent). As a previous AAF analysis noted, both the San Francisco and Seattle MSAs already face substantial negative margins for Medicare Part A, at -41.2 percent and -27.7 percent, respectively. Based on the above calculations, a switch to BLS’ OEWS data may worsen these negative margin problems for several high-cost regions, but ease them somewhat for others. This may be true for several reasons, but ultimately, more study is needed to determine why two MSAs with high-margin losses would have different outcomes under a new system that used BLS’ OEWS data.
Tracking COVID-19 Cases and Vaccinations
Jackson Hammond, Health Care Policy Analyst
To track the progress in vaccinations, the Weekly Checkup will compile the most relevant statistics for the week, with the seven-day period ending on the Wednesday of each week.
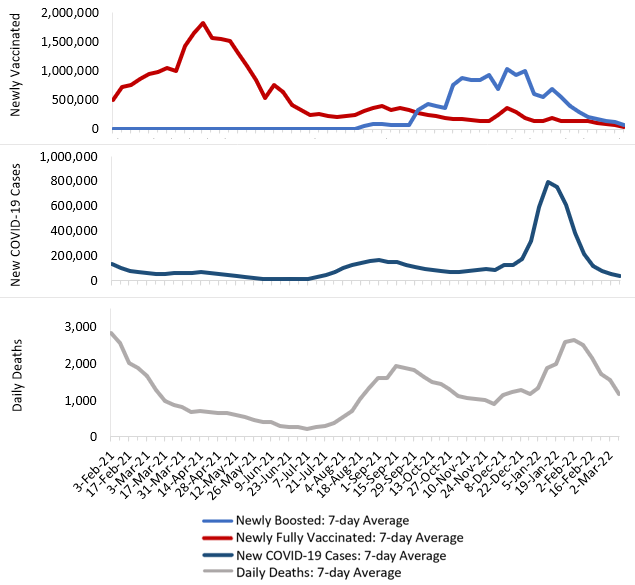
Sources: Centers for Disease Control and Prevention Trends in COVID-19 Cases and Deaths in the US, and Trends in COVID-19 Vaccinations in the USNote: The U.S. population is 332,551,254.