Weekly Checkup
October 23, 2020
The Story of ACA Premiums Under Trump
It’s that time of year when summer fades into fall and health policy wonks turn their attention to parsing insurer filings for the upcoming 2021 plan year. This week, the Trump Administration is touting three years of stable premiums, and based on a new report from the Centers for Medicare and Medicaid Services (CMS), it has a point. According to CMS, premiums for benchmark Silver plans offered through the Affordable Care Act’s (ACA) federally facilitated marketplace are decreasing—down 2 percent compared to 2020. This drop builds on a trend, as 2020 benchmark premiums for all states decreased on average 3 percent over 2019, while 2019 benchmark premiums increased by what was at the time the smallest year-over-year increase since the marketplace opened in 2014, just 5 percent.
Much has been made of the Trump Administration’s supposed attempts to destabilize the ACA marketplace in a bid to undermine the law, but closer examination tells a different story. Let’s go to the tape.
It’s hard to precisely measure the change in premiums in the individual market from 2013 to 2014 for a number of reasons; for one, you can’t do a straight apples-to-apples comparison of insurance products offered before the ACA to those after. Nonetheless, roughly a 40 to 50 percent increase in average 2014 premiums over 2013 is in the ballpark. After that, tracking benchmark Silver plan premiums year over year is straightforward. In 2015 benchmark premiums increased an average of 5.8 percent, then 10 percent in 2016, and finally 27 percent in 2017. All told the Obama Administration presided over an increase in individual market premiums on the order of 80 to 90 percent from 2013 to 2017.
Once Trump took office in 2017, benchmark premiums for 2018 jumped an astounding 36 percent. There are several factors that contributed. For one thing, the trend line already showed increasingly dramatic year-over-year increases prior to 2018, so even without major policy changes 2018 might have seen large increases. The largest factor, however, was the Trump Administration’s decision to stop making payments to insurers to reimburse them for the ACA’s requirement that they cover the cost-sharing requirements for certain ACA enrollees who purchase Silver plans. Call it a drafting error, but in effect the law required insurers to make those cost-sharing reduction payments (CSRs) with the government promising to make them whole, but the law didn’t appropriate funds for that purpose. Congress never did, and the Obama Administration responded by redirecting other funds to make the payments to insurers. Congress sued the White House, winning a lower court ruling, and the Trump Administration declined to appeal the case and suspended the payments. There is no question that decision had a dramatic impact on 2018 premiums.
Since 2018, however, we’ve seen the three best years for ACA premiums since the law took effect. These correspond with administration actions on short-term, limited-duration insurance, association health plans, health reimbursement arrangements, and reduced funding for enrollment outreach and assistance, all of which opponents predicted would have a detrimental impact on the law. In addition to lower premiums, and probably a cause of them, recent years have also seen an influx of plan offerings, and across the board beneficiaries are seeing increasing choice and competition in the marketplace. Of course, averages never tell the whole story; they mask regional differences. For example, in 2021 benchmark Silver plan premiums for Nebraska will increase 29 percent while they will drop 29 percent in Iowa. But the overall premium picture under Trump has been positive.
Correlation isn’t necessarily causation, and state actions such as implementing reinsurance programs have certainly had a positive impact, but you really can’t blame the Trump Administration’s health policies for the collapse of the ACA when the ACA isn’t collapsing, and has actually stabilized.
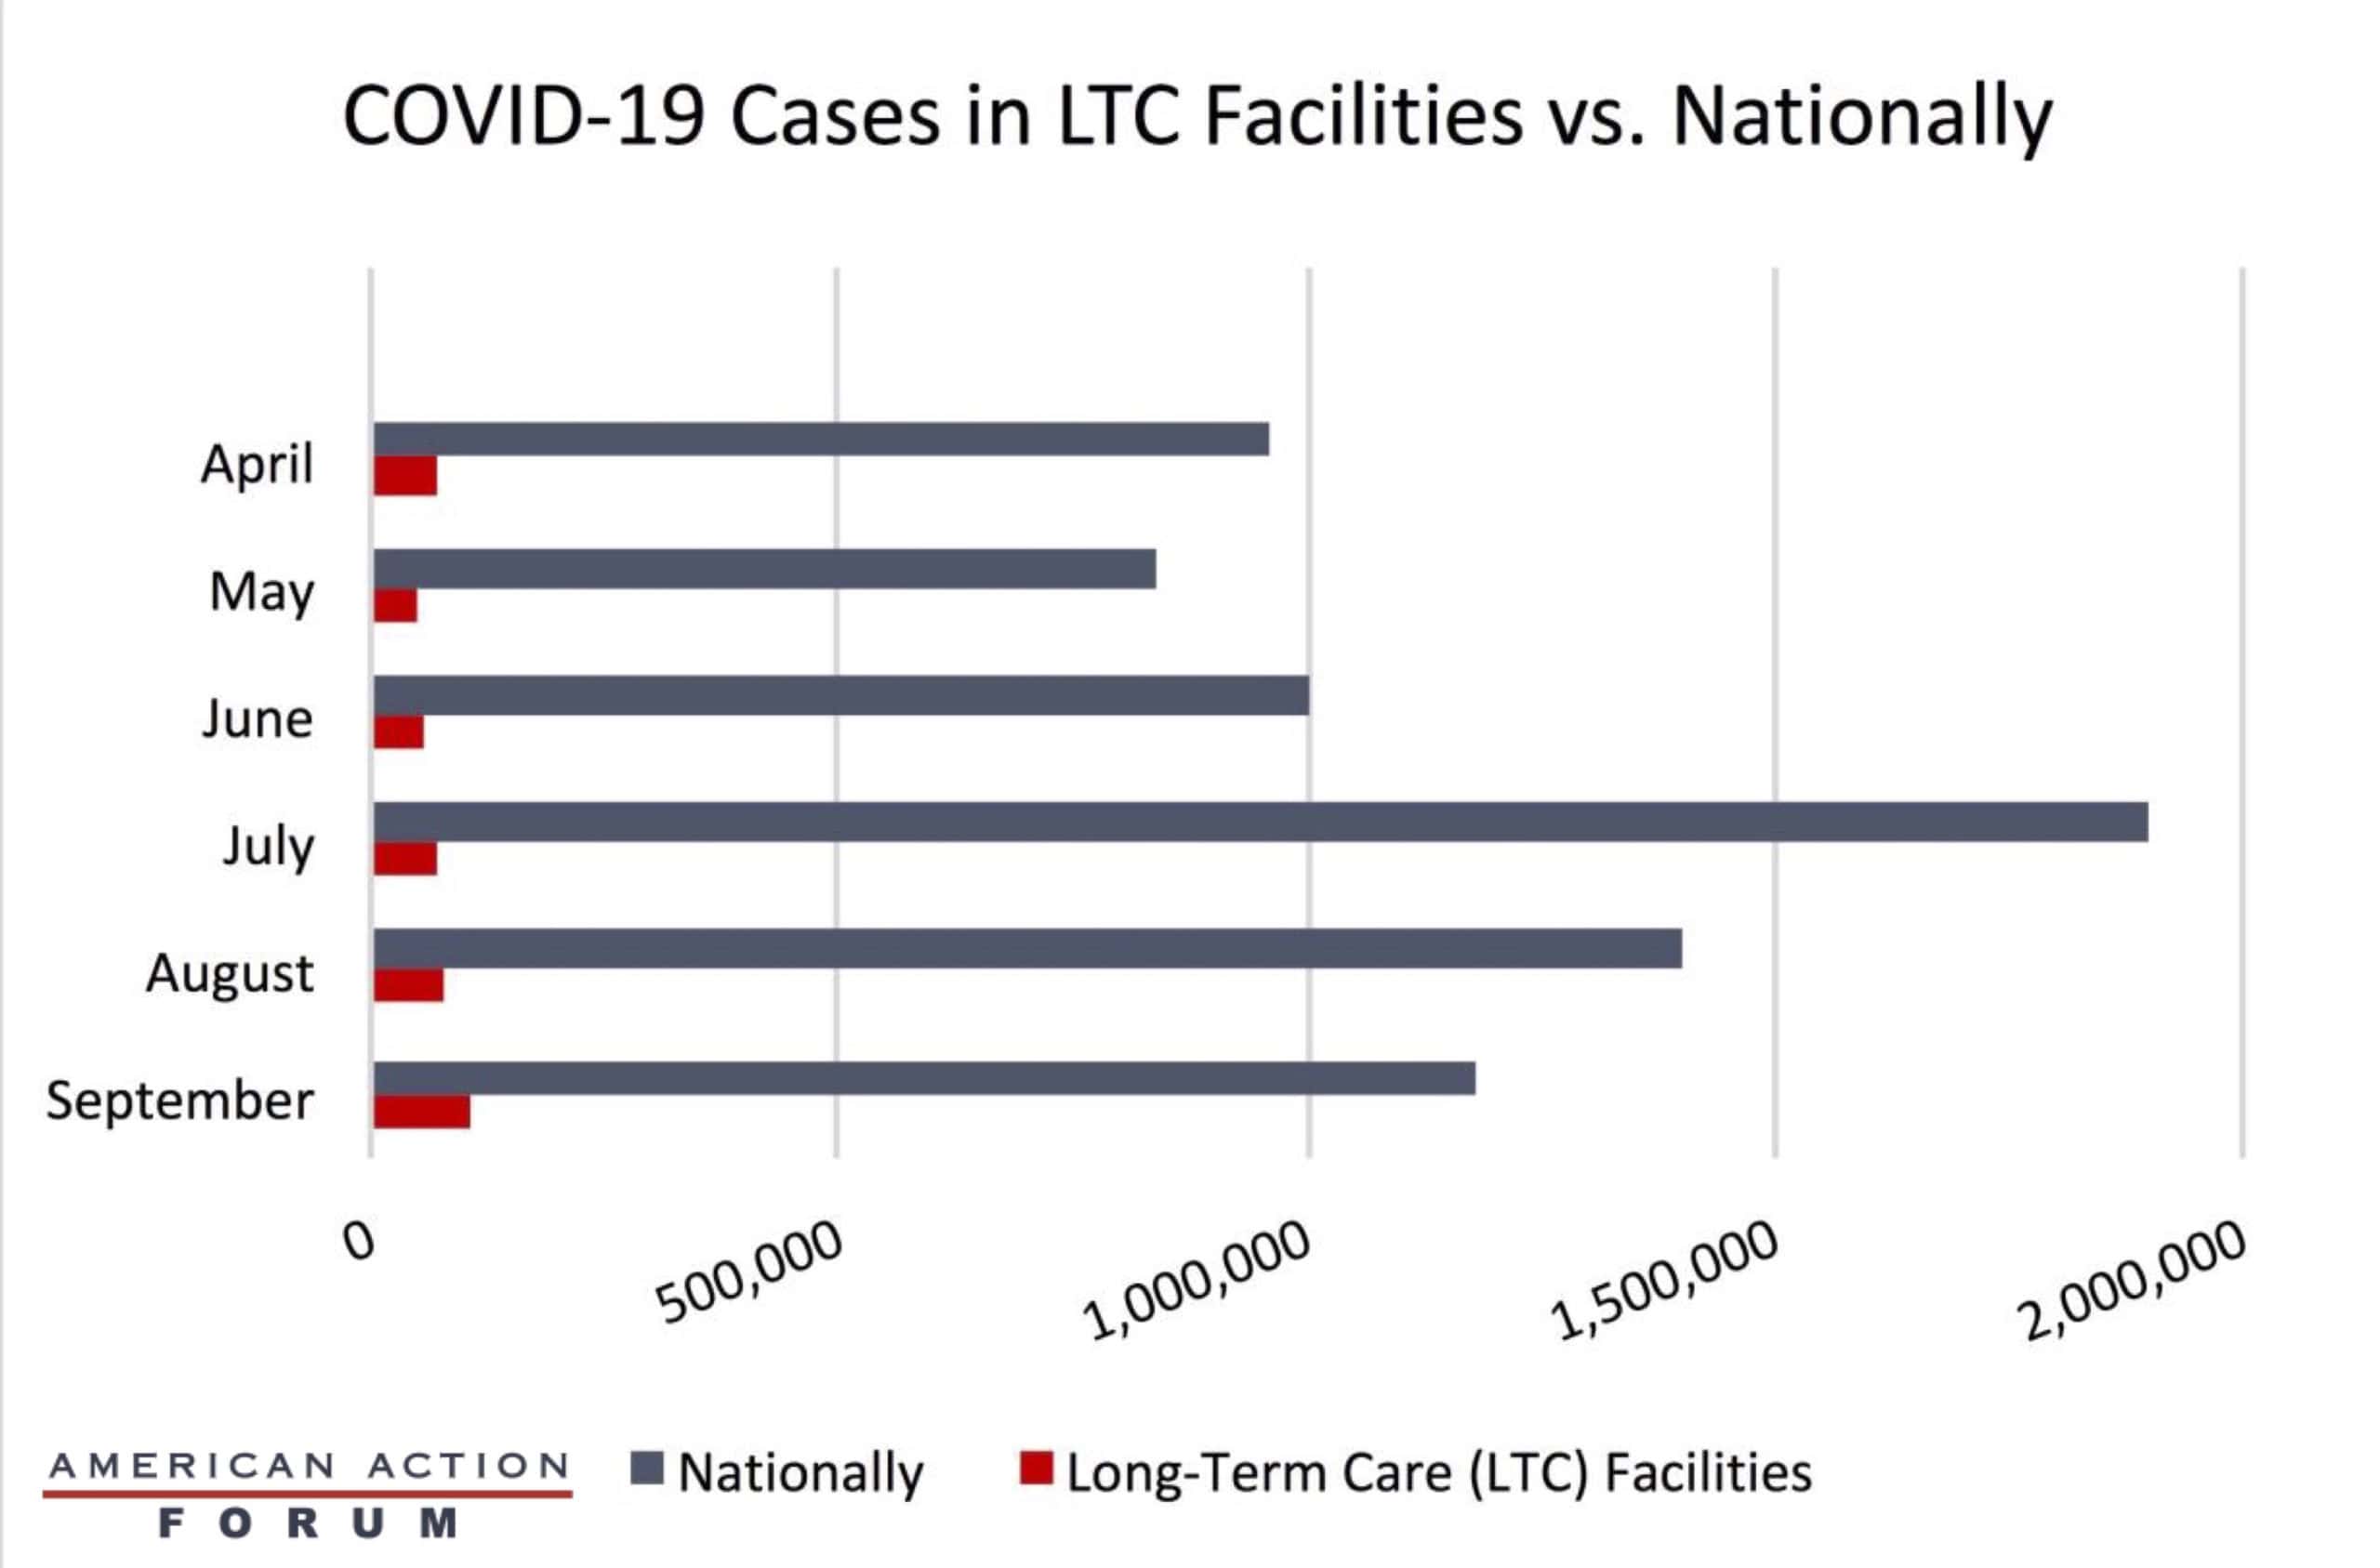
Chart Review: Rising Cases in Long-Term Care
Julia Demeester, Health Care Policy Intern
In April of this year, the COVID-19 virus swept through long-term care (LTC) facilities. Although the early months of the pandemic saw high cases in LTC facilities, May and June saw a decrease in cases from April. As the graph below shows, however, cases continued to grow nationally throughout the summer months, with every month except May higher than April, likely due to vacations and various social gatherings and new cases among younger individuals. July brought about a new high in terms of monthly cases with roughly 1.9 million new cases. Despite this jump in overall cases, the number of new cases decreased in August and September. While new cases decreased nationally, data obtained through the Kaiser Family Foundation show that the incidence of cases in LTC facilities gradually increased through August and September. While some LTC facilities were hotspots for the virus early in the outbreak, the continued growth of cases in these facilities indicates that the virus has not been contained in them. Policymakers must not ignore LTC facilities in any comprehensive strategy for fighting the pandemic.
From Team Health
The Health Care Choices Proposal – AAF President Douglas Holtz-Eakin and Christopher Holt
AAF’s Center for Health and Economy used its microsimulation model to assess a new health care reform proposal from the Health Policy Consensus Group.
Worth a Look
Reuters: Study finds AstraZeneca’s COVID-19 vaccine follows genetic instructions
Wall Street Journal: As Covid-19 Cases Rise Across Europe, Hospitals Are Rushing to Prepare for Winter